» Download this section as PDF (opens in a new tab/window)
A brief look at the history of infrastructure and what has led us to where we are today.
The datacenter has evolved significantly over the last several decades. The following sections will examine each era in detail.
The mainframe ruled for many years and laid the core foundation of where we are today. It allowed companies to leverage the following key characteristics:
But the mainframe also introduced the following issues:
With mainframes, it was very difficult for organizations within a business to leverage these capabilities which partly led to the entrance of pizza boxes or stand-alone servers. Key characteristics of stand-alone servers included:
These stand-alone servers introduced more issues:
Businesses always need to make money and data is a key piece of that puzzle. With direct-attached storage (DAS), organizations either needed more space than was locally available, or data high availability (HA) where a server failure wouldn’t cause data unavailability.
Centralized storage replaced both the mainframe and the stand-alone server with sharable, larger pools of storage that also provided data protection. Key characteristics of centralized storage included:
Issues with centralized storage included:
At this point in time, compute utilization was low and resource efficiency was impacting the bottom line. Virtualization was then introduced and enabled multiple workloads and operating systems (OSs) to run as virtual machines (VMs) on a single piece of hardware. Virtualization enabled businesses to increase utilization of their pizza boxes, but also increased the number of silos and the impacts of an outage. Key characteristics of virtualization included:
Issues with virtualization included:
The hypervisor became a very efficient and feature-filled solution. With the advent of tools, including VMware vMotion, HA, and DRS, users obtained the ability to provide VM high availability and migrate compute workloads dynamically. The only caveat was the reliance on centralized storage, causing the two paths to merge. The only down turn was the increased load on the storage array before and VM sprawl led to contention for storage I/O.
Key characteristics included:
Issues included:
SSDs helped alleviate this I/O bottleneck by providing much higher I/O performance without the need for tons of disk enclosures. However, given the extreme advances in performance, the controllers and network had not yet evolved to handle the vast I/O available. Key characteristics of SSDs included:
SSD issues included:
The term cloud can be very ambiguous by definition. Simply put it’s the ability to consume and leverage a service hosted somewhere provided by someone else.
With the introduction of cloud, the perspectives IT, the business and end-users have shifted.
Business groups and IT consumers require IT provide the same capabilities of cloud, its agility and time to value. If not, they will go directly to cloud which causes another issue for IT: data security.
Core pillars of any cloud service:
Most general classifications of cloud fall into three main buckets (starting at the highest level and moving downward):
Cloud poses an interesting dilemma for IT. They can embrace it, or they can try to provide an alternative. They want to keep the data internal, but need to allow for the self-service, rapid nature of cloud.
This shift forces IT to act more as a legitimate service provider to their end-users (company employees).
The figure below characterizes the various latencies for specific types of I/O:
| Item | Latency | Comments |
|---|---|---|
| L1 cache reference | 0.5 ns | |
| L2 cache reference | 7 ns | 14x L1 cache |
| DRAM access | 100 ns | 20x L2 cache, 200x L1 cache |
| 3D XPoint based NVMe SSD read | 10,000 of ns (expected) | 10 us or 0.01 ms |
| NAND NVMe SSD R/W | 20,000 ns | 20 us or 0.02 ms |
| NAND SATA SSD R/W | 50,000-60,000 ns | 50-60 us or 0.05-0.06 ms |
| Read 4K randomly from SSD | 150,000 ns | 150 us or 0.15 ms |
| P2P TCP/IP latency (phy to phy) | 150,000 ns | 150 us or 0.15 ms |
| P2P TCP/IP latency (vm to vm) | 250,000 ns | 250 us or 0.25 ms |
| Read 1MB sequentially from memory | 250,000 ns | 250 us or 0.25 ms |
| Round trip within datacenter | 500,000 ns | 500 us or 0.5 ms |
| Read 1MB sequentially from SSD | 1,000,000 ns | 1 ms, 4x memory |
| Disk seek | 10,000,000 ns or 10,000 us | 10 ms, 20x datacenter round trip |
| Read 1MB sequentially from disk | 20,000,000 ns or 20,000 us | 20 ms, 80x memory, 20x SSD |
| Send packet CA -> Netherlands -> CA | 150,000,000 ns | 150 ms |
(credit: Jeff Dean, https://gist.github.com/jboner/2841832)
The table above shows that the CPU can access its caches at anywhere from ~0.5-7ns (L1 vs. L2). For main memory, these accesses occur at ~100ns, whereas a local 4K SSD read is ~150,000ns or 0.15ms.
If we take a typical enterprise-class SSD (in this case the Intel S3700 - SPEC), this device is capable of the following:
For traditional storage, there are a few main types of media for I/O:
For the calculation below, we are using the 500MB/s Read and 460MB/s Write BW available from the Intel S3700.
The calculation is done as follows:
numSSD = ROUNDUP((numConnections * connBW (in GB/s))/ ssdBW (R or W))
NOTE: Numbers were rounded up as a partial SSD isn’t possible. This also does not account for the necessary CPU required to handle all of the I/O and assumes unlimited controller CPU power.
| Network BW | SSDs required to saturate network BW | ||
|---|---|---|---|
| Controller Connectivity | Available Network BW | Read I/O | Write I/O |
| Dual 4Gb FC | 8Gb == 1GB | 2 | 3 |
| Dual 8Gb FC | 16Gb == 2GB | 4 | 5 |
| Dual 16Gb FC | 32Gb == 4GB | 8 | 9 |
| Dual 32Gb FC | 64Gb == 8GB | 16 | 19 |
| Dual 1Gb ETH | 2Gb == 0.25GB | 1 | 1 |
| Dual 10Gb ETH | 20Gb == 2.5GB | 5 | 6 |
As the table shows, if you wanted to leverage the theoretical maximum performance an SSD could offer, the network can become a bottleneck with anywhere from 1 to 9 SSDs depending on the type of networking leveraged
Typical main memory latency is ~100ns (will vary), we can perform the following calculations:
If we assume a typical network RTT is ~0.5ms (will vary by switch vendor) which is ~500,000ns that would come down to:
If we theoretically assume a very fast network with a 10,000ns RTT:
What that means is even with a theoretically fast network, there is a 10,000% overhead when compared to a non-network memory access. With a slow network this can be upwards of a 500,000% latency overhead.
In order to alleviate this overhead, server side caching technologies are introduced.
One frequently debated topic is the argument between doing things in kernel vs. in user-space. Here I’ll explain what each is and their respective pros/cons.
Any operating system (OS) has two core areas of execution:
These two spaces work in conjunction for the OS to operate. Now before moving on let’s define a few key items:
For example, take the following use-case of a simple app writing some data to disk. In this the following would take place:
The following shows a sample of these interactions:
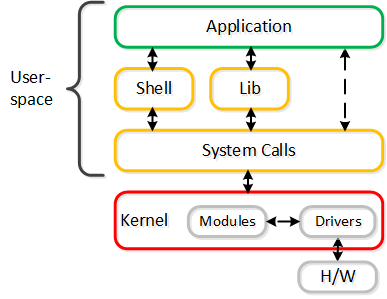 User and Kernel Space Interaction
Is one better than the other? In reality there are pros and cons for each:
Another core component is how the interaction between the two is handled. There are two key types of interaction:
As devices have become far faster (e.g. NVMe, Intel Optane, pMEM), the kernel and device interaction has become a bottleneck. To eliminate these bottlenecks, a lot of vendors are moving things out of the kernel to user space with polling and seeing much better results.
A great example of this are the Intel Storage Performance Development Kit (SPDK) and Data Plane Development Kit (DPDK). These projects are geared at maximizing the performance and reducing latency as much as possible, and have shown great success.
This shift is composed of two core changes:
This enables far superior performance when compared to the kernel based predecessors, as it eliminates:
The following shows the device interaction using user space drivers:
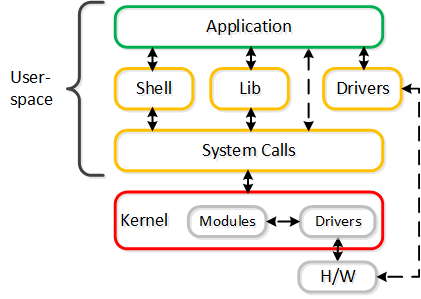 User Space and Polling Interaction
In fact, a piece of software Nutanix had developed for their AHV product (vhost-user-scsi), is actually being used by Intel for their SPDK project.
web·scale - /web ‘ skãl/ - noun - computing architecture
a new architectural approach to infrastructure and computing.
This section will present some of the core concepts behind “Web-scale” infrastructure and why we leverage them. Before we get started, it should be stated that the Web-scale doesn’t mean you need to be “web-scale” (e.g. Google, Facebook, or Microsoft). These constructs are applicable and beneficial at any scale (3-nodes or thousands of nodes).
Historical challenges included:
There are a few key constructs used when talking about “Web-scale” infrastructure:
Other related items:
The following sections will provide a technical perspective on what they actually mean.
There are differing opinions on what hyper-convergence actually is. It also varies based on the scope of components (e.g. virtualization, networking, etc.). However, the core concept comes down to the following: natively combining two or more components into a single unit. ‘Natively’ is the key word here. In order to be the most effective, the components must be natively integrated and not just bundled together. In the case of Nutanix, we natively converge compute + storage to form a single node used in our appliance. For others, this might be converging storage with the network, etc.
What it really means:
Benefits include:
Software-defined intelligence is taking the core logic from normally proprietary or specialized hardware (e.g. ASIC / FPGA) and doing it in software on commodity hardware. For Nutanix, we take the traditional storage logic (e.g. RAID, deduplication, compression, etc.) and put that into software that runs in each of the Nutanix Controller VMs (CVM) on standard hardware.
Nutanix currently supports both x86 and IBM POWER architectures.
What it really means:
Benefits include:
To elaborate on the last point: old hardware can run the latest and greatest software. This means that a piece of hardware years into its depreciation cycle can run the latest shipping software and be feature parity with new deployments shipping from the factory.
Distributed autonomous systems involve moving away from the traditional concept of having a single unit responsible for doing something and distributing that role among all nodes within the cluster. You can think of this as creating a purely distributed system. Traditionally, vendors have assumed that hardware will be reliable, which, in most cases can be true. However, core to distributed systems is the idea that hardware will eventually fail and handling that fault in an elegant and non-disruptive way is key.
These distributed systems are designed to accommodate and remediate failure, to form something that is self-healing and autonomous. In the event of a component failure, the system will transparently handle and remediate the failure, continuing to operate as expected. Alerting will make the user aware, but rather than being a critical time-sensitive item, any remediation (e.g. replace a failed node) can be done on the admin’s schedule. Another way to put it is fail in-place (rebuild without replace) For items where a “leader” is needed, an election process is utilized. In the event this leader fails a new leader is elected. To distribute the processing of tasks MapReduce concepts are leveraged.
What it really means:
Benefits include:
Incremental and linear scale out relates to the ability to start with a certain set of resources and as needed scale them out while linearly increasing the performance of the system. All of the constructs mentioned above are critical enablers in making this a reality. For example, traditionally you’d have 3-layers of components for running virtual workloads: servers, storage, and network – all of which are scaled independently. As an example, when you scale out the number of servers you’re not scaling out your storage performance. With a hyper-converged platform like Nutanix, when you scale out with new node(s) you’re scaling out:
What it really means:
Benefits include:
In summary:
©2025 Nutanix, Inc. All rights reserved. Nutanix, the Nutanix logo and all Nutanix product and service names mentioned are registered trademarks or trademarks of Nutanix, Inc. in the United States and other countries. All other brand names mentioned are for identification purposes only and may be the trademarks of their respective holder(s).