
The Nutanix Cloud Bible - Classic Edition
» Download The Nutanix Cloud Bible Classic Version as PDF (opens in a new tab/window)
Welcome to the classic edition of The Nutanix Cloud Bible The purpose of the The Nutanix Cloud Bible is to provide in-depth technical information about the Nutanix platform architecture.
The Basics: Compute, Storage and Networking
The BasicsLearn the basics of Webscale principles and core architectural concepts.
» Download this section as PDF (opens in a new tab/window)
web·scale - /web ‘ skãl/ - noun - computing architecture
a new architectural approach to infrastructure and computing.
Nutanix leverages “Web-scale” principles throughout our software stack. Web-scale doesn’t mean you need to be as big as Google, Facebook, Amazon, or Microsoft in order to leverage them. Web-scale principles are applicable and beneficial at any scale, whether 3-nodes or thousands of nodes.
There are a few key constructs used when talking about “Web-scale” infrastructure:
- Hyper-convergence
- Software defined intelligence
- Distributed autonomous systems
- Incremental and linear scale out
Other related items:
- API-based automation and rich analytics
- Security as a core tenant
- Self-healing
This book will cover these basics as well as the core architectural concepts.
» Download this section as PDF (opens in a new tab/window)
When Nutanix was conceived it was focused on one goal:
Make infrastructure computing invisible, anywhere.
This simplicity was to be achieved by focus in three core areas:
- Enable choice and portability (HCI/Cloud/Hypervisor)
- Simplify the “stack” through convergence, abstraction and intelligent software (AOS)
- Provide an intuitive user interface (UI) through focus on user experience (UX) and design (Prism)
HCI/Cloud/Hypervisor: “The Choice”
Though we started with a single hardware platform (NX) supporting a single hypervisor (ESXi), we’ve always known we were more than a single hypervisor/platform/cloud company. This was one of the reasons we chose to build our own UI from scratch vs. run as a plug-in in vCenter, run as a VM vs. natively in the kernel (a lot more reasons there), etc. Why you may ask? Choice.
Not one hypervisor, platform, or cloud will fit all customer’s needs. By supporting multiple under the same platform we give the customer choice and leverage. By giving them the ability to move between them, we give them flexibility. All delivered with the same experience since it’s all part of the Nutanix platform.
We now have support for over 12 different hardware platforms (direct/OEM/third-party), multiple hypervisors (AHV, ESXi, Hyper-V, etc.), and expanding integrations with all of the major cloud vendors (AWS, Azure, GCP). This allows the customer to choose what is best for them, as well as use this for negotiations purposes between vendors.
NOTE: Platform is one key word that is used throughout the section and in general. We’re not trying to build one-off products, we’re building a platform.
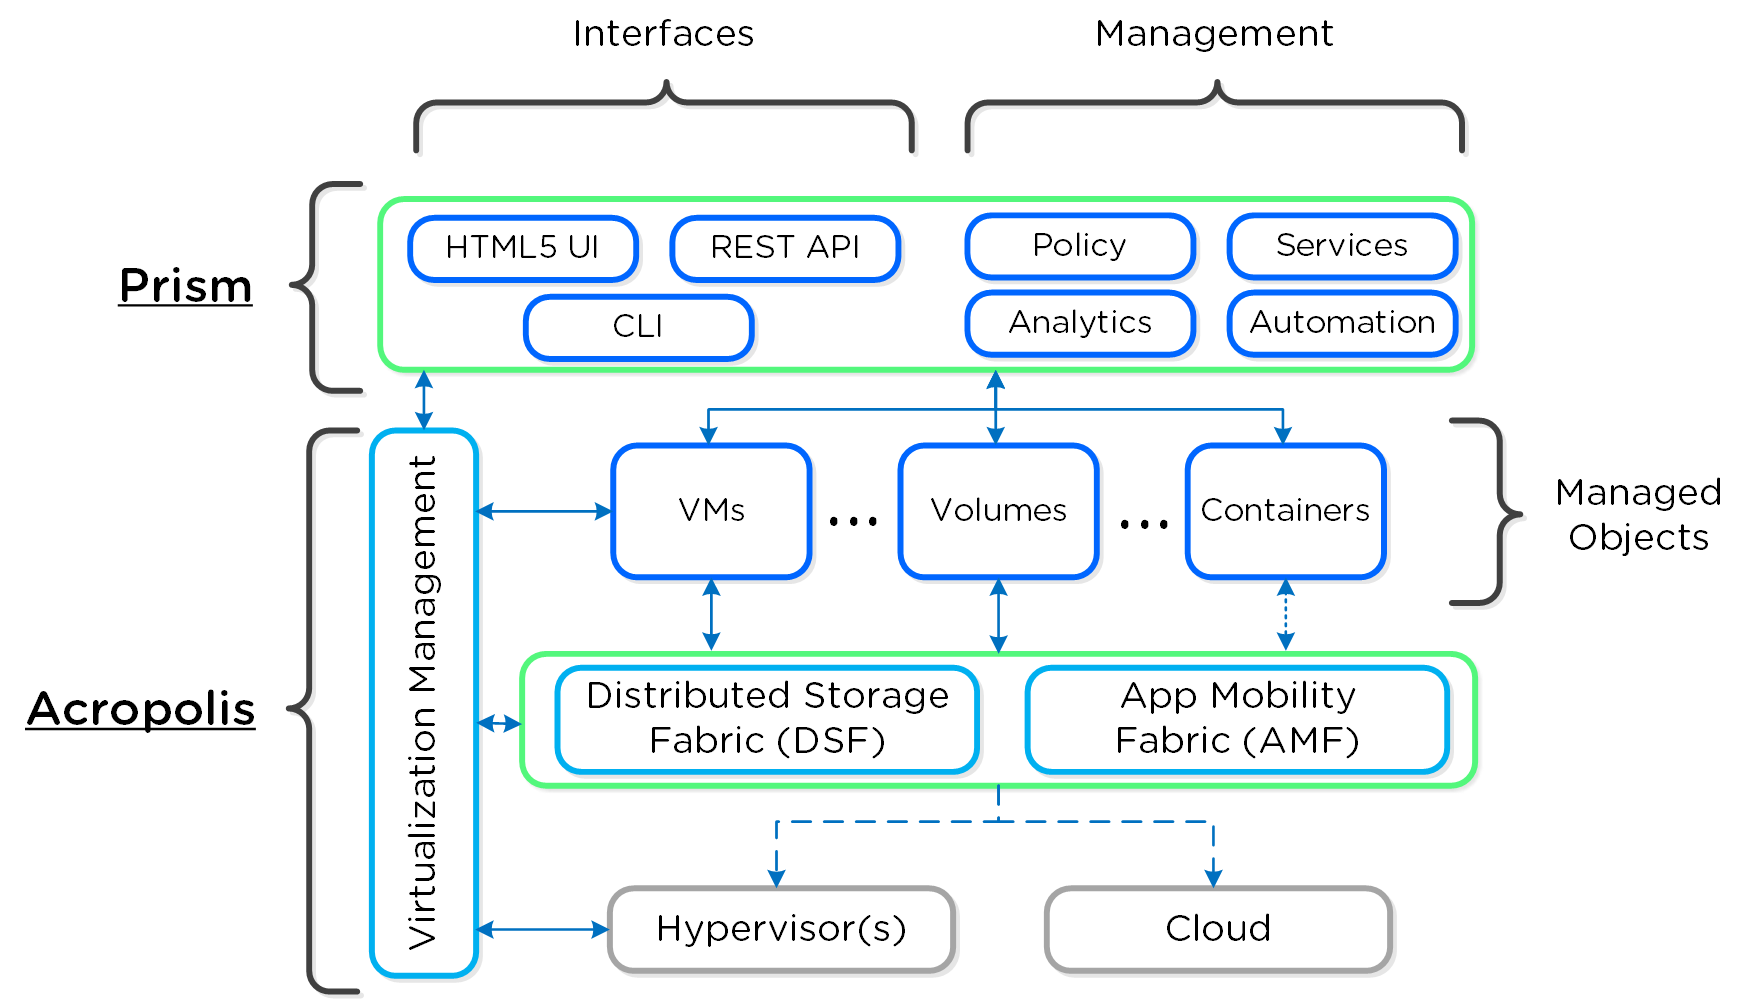
The following shows a high-level architecture of the Nutanix platform:
 Nutanix Platform - Architecture
AOS + AHV/Hypervisor: “The Runtime”
We started this journey by simplifying storage with a feature called the Distributed Storage Fabric (DSF then known as the Nutanix Distributed Filesystem aka NDFS), which combined local storage resources with intelligent software to provide “centralized storage” like capabilities.
Over the years, we’ve added a great deal of features and capabilities. To simplify things these have been broken down into two core areas:
- Core Services
- Foundational services
- Platform Services
- Services building upon core services providing additional capabilities/services
The core provides the foundational services and components that facilitate the running of workloads (VMs/Containers) and other higher-level Nutanix services. In the beginning this was just the DSF product, however we continue to expand the platform’s capabilities to help simplify and abstract the stack.
The following shows a high-level view of the AOS core platform:
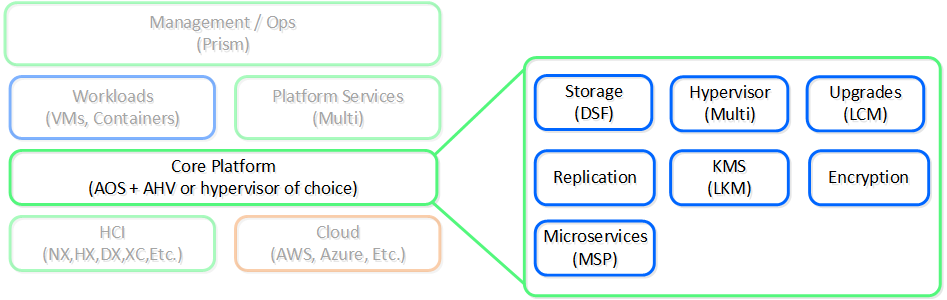 Nutanix Platform - AOS Core
Over the years this has expanded into things like abstracting virtualization (we believe this should be something transparent and part of the system) by introducing our own hypervisor (AHV), simplifying upgrades, and providing other essential services like security and encryption.
With these capabilities we solved for a lot of the infrastructure level issues, but we didn’t stop there. People still needed additional services like file shares, object storage, or containers.
Rather than requiring customers to use other vendors and products for some services we figured which ones we should partner on and which ones we should build ourselves. For backup we partnered with vendors like Veeam and Hycu, for others like file and object services we built them as services into the platform.
The following shows a high-level view of the Nutanix platform services:
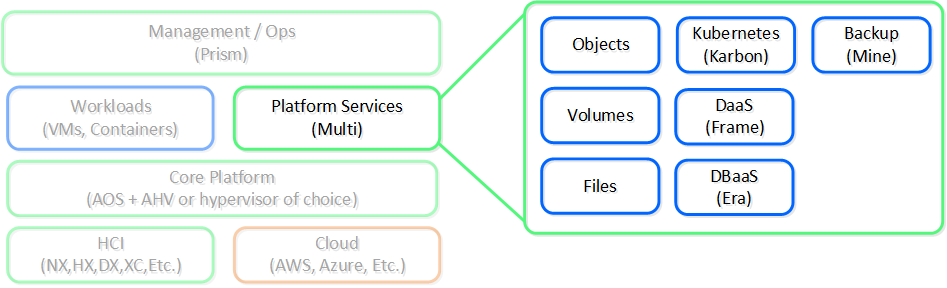 Nutanix Platform - Services
Prism: “The Interface”
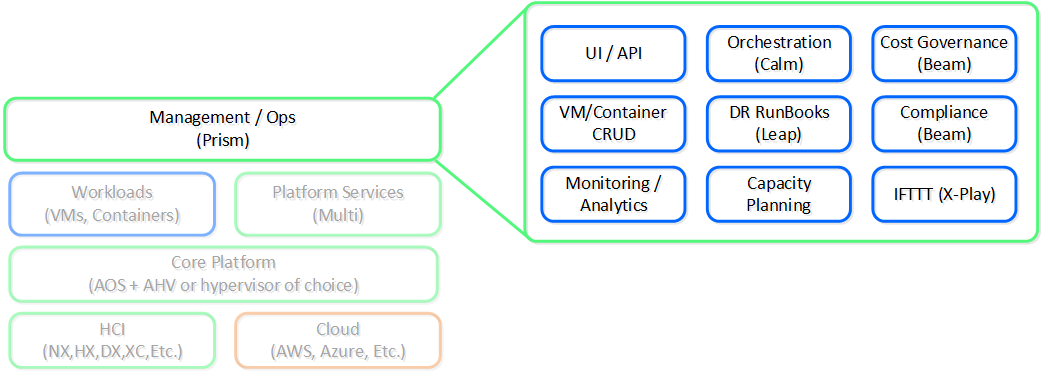 Nutanix Platform - Prism
Simply put, apply some of the design principles fostered by companies like Apple focused on simplicity, consistency and intuitiveness. Since the beginning we’ve invested significant time and effort on the Nutanix product’s “front-end”. Rather than being an afterthought, the UI/UX and design teams have always been pushing the boundaries. Case in point, we were one of the first enterprise software companies (besides the SaaS players), to have the management UI be written in HTML5.
Another core item here is the focus on providing a single interface for the platform and keeping the experience consistent throughout that. Our goal is to converge UIs like we’ve converged infrastructure. We want Prism to be a single interface allowing you to manage and consume the Nutanix platform, whether that is managing virtualization in your datacenter, file and object storage, Kubernetes®, AI or providing spend visibility.
This is important as we continue to expand the platform through feature / service creation and acquisition. Rather than bolting the new capabilities on, we’d rather spend the time to natively integrate them into the platform. It is a slower process, but in the long run it keeps the experience consistent and reduces risk.
Nutanix: The Platform
To summarize, our vision is simple: “One platform to run applications and data anywhere.”
Nutanix Platform - Architecture
This has been our goal from close to the beginning. Testament to this, below is an image created circa 2014 to talk about the Nutanix platform architecture. As you can see not much has changed, we just continue expanding and working towards this goal.
 Nutanix Platform - Circa 2014
» Download this section as PDF (opens in a new tab/window)
Products
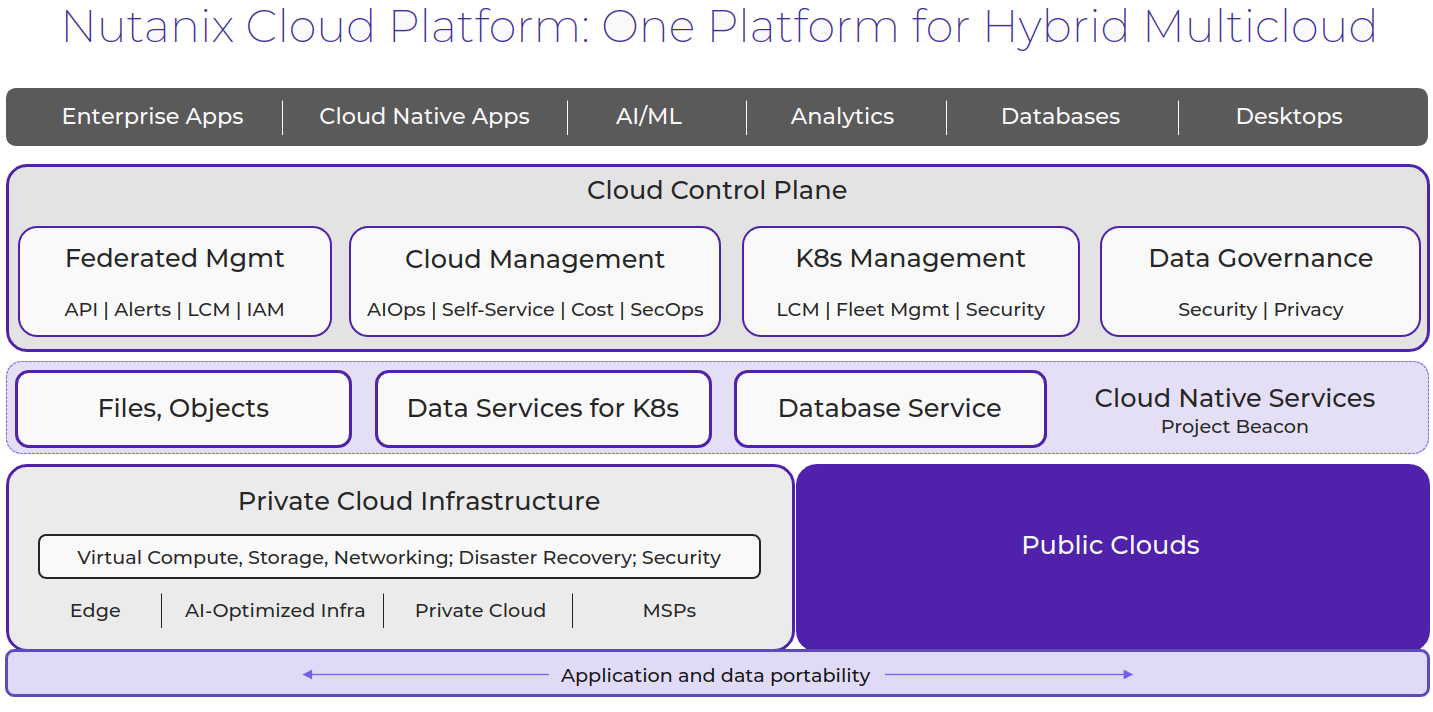
Nutanix pioneered hyperconverged infrastructure (HCI) to break down legacy silos by merging compute, storage, and networking into a single, easy-to-use datacenter platform. Now, as the cloud has emerged as a critical component of IT infrastructure, Nutanix is breaking down silos again—this time between on-premises, cloud, and the edge—to deliver a hybrid multicloud platform.
Nutanix Cloud Platform
The Nutanix Cloud Platform is a secure, resilient, and self-healing platform for building your hybrid multicloud infrastructure to support all kinds of workloads and use cases across public and private clouds, multiple hypervisors and containers, with varied compute, storage, and network requirements.
Nutanix Cloud Platform
The building blocks of Nutanix Cloud Platform are Nutanix Cloud Infrastructure and Nutanix Cloud Manager. These are the products that fall under each of them to form a complete solution.
Nutanix Cloud Infrastructure (NCI)
- AOS Scale-Out Storage
- This is the core of Nutanix Cloud Platform and provides a distributed, performant, and resilient storage platform that scales linearly.
- AHV Hypervisor
- Native enterprise class virtualization, management and monitoring capabilities are provided by AHV. The Nutanix Cloud Platform also supports ESXi and Hyper-V.
- Virtual Networking
- AHV comes with standard VLAN-backed virtual networking. You can also enable Flow Virtual Networking to provide virtual private cloud (VPC) and other advanced networking constructs in AHV for enhanced isolation, automation, and multi-tenancy.
- Disaster Recovery
- Integrated disaster recovery that is simple to deploy and easy to manage, providing flexible RPO and RTO options on-prem and in the cloud
- Container Services
- Nutanix Cloud platform provides an enterprise Kubernetes management solution (Nutanix Kubernetes Platform), to deliver and manage an end-to-end production ready Kubernetes environment.
- Data and Network Security
- Comprehensive security for data using encryption with a built-in local key manager and software-based firewalls for network and applications with Flow Network Security.
Nutanix Cloud Manager (NCM)
- AI Operations (NCM Intelligent Operations)
- Optimizes capacity, proactively detects performance anomalies and provides capability to automate operational tasks that can streamline infrastructure management
- Self-Service Infrastructure/App Lifecycle Management (NCM Self-Service)
- Orchestration with the ability to manage, deploy and scale applications across hybrid clouds with self-service, automation, and centralized role-based governance.
- Cost Governance
- Drive financial accountability with intelligent resource sizing and accurate visibility into cloud metering and chargeback.
- Security Central
- Security dashboard that unifies cloud security operations, identifies workload vulnerabilities, manages microsegmentation, and adheres to regulatory compliance requirements for strategic initiatives like Zero Trust.
In addition to NCI and NCM, the Nutanix Cloud Platform also provides the following services.
Nutanix Unified Storage Services
- Files Storage
- Simple, Secure, software-defined scale-out file storage and management
- Objects Storage
- Simple, Secure and scale-out S3 compatible object storage at massive scale
- Volumes Block Storage
- Enterprise class scale-out block storage that exposes storage resources directly to virtualized guest operating systems or physical hosts
Nutanix Database Service
Simplified and automated database lifecycle management across hybrid clouds
Nutanix Cloud Platform can be deployed on-prem, in public clouds using Nutanix Cloud Clusters (NC2), in a colocation, or at edge as required. For licensing and software options please visit Nutanix.com Software Options Page.
Platform
Nutanix supports a variety of vendor platforms and configurations. Platforms can be Nutanix appliances, OEM platforms and third-party server vendors for on-prem platforms. Additionally, Nutanix software also runs in public cloud platforms with NC2 and service provider clouds. For a complete list, please visit the Nutanix.com Platforms Page.
» Download this section as PDF (opens in a new tab/window)
For a video explanation you can watch the following video: LINK
There are a few core structs for hyperconverged systems:
- Must converge and collapse the computing stack (e.g. compute + storage)
- Must shard (distribute) data and services across nodes in the system
- Must appear and provide the same capabilities as centralized storage (e.g. HA, live-migration, etc.)
- Must keep data as close to the execution (compute) as possible (Importance of Latency)
- Should be hypervisor agnostic
- Should be hardware agnostic
The following figure shows an example of a typical 3-tier stack vs. hyperconverged:
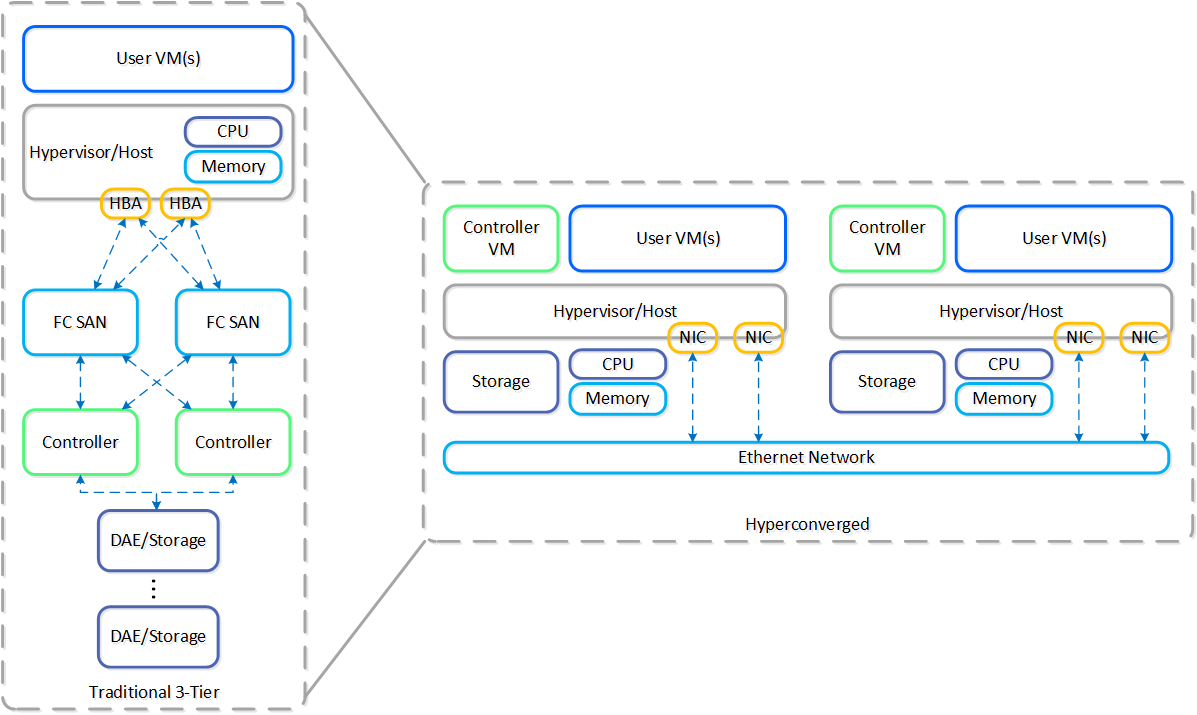 3-Tier vs. HCI
As you can see, the hyperconverged system does the following:
- Virtualizes and moves the controllers to the host
- Provides core services and logic through software
- Distributes (shards) data across all nodes in the system
- Moves the storage local to the compute
The Nutanix solution is a converged storage + compute solution which leverages local components and creates a distributed platform for running workloads.
Each node runs an industry-standard hypervisor (ESXi, AHV, and Hyper-V) and the Nutanix Controller VM (CVM). The Nutanix CVM is what runs the Nutanix software and serves all of the I/O operations for the hypervisor and all VMs running on that host.
The following figure provides an example of what a typical node logically looks like:
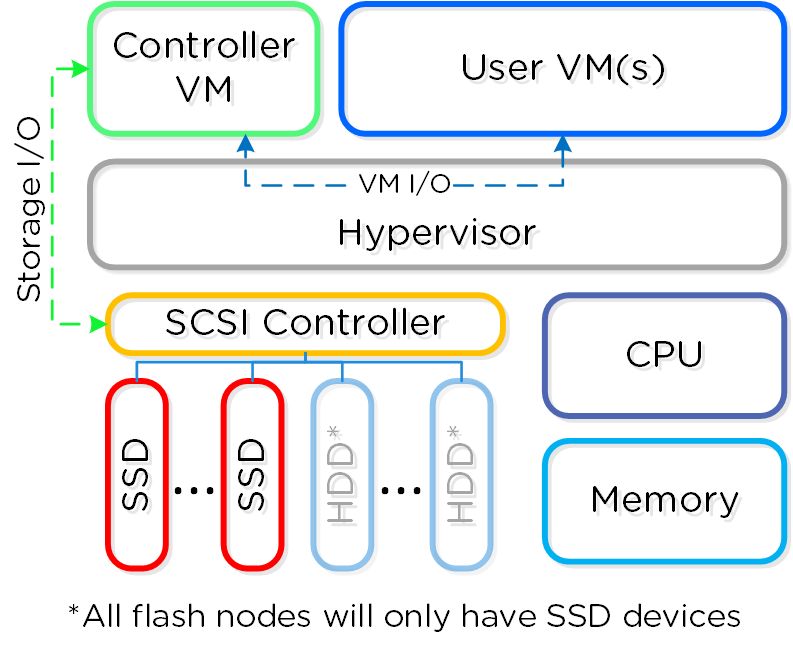 Converged Platform
The Nutanix CVM is responsible for the core Nutanix platform logic and handles services like:
- Storage I/O & transforms (Deduplication, Compression, EC)
- UI / API
- Upgrades
- DR / Replication
- Etc.
NOTE: Some services / features will spawn additional helper VMs or use the Microservices Platform (MSP). For example, Nutanix Files will deploy additional VMs, whereas Nutanix Objects will deploy VMs for MSP and leverage those.
For the Nutanix units running VMware vSphere, the SCSI controller, which manages the SSD and HDD devices, is directly passed to the CVM leveraging VM-Direct Path (Intel VT-d). In the case of Hyper-V, the storage devices are passed through to the CVM.
Note
Virtualizing the Controller
The key reasons for running the Nutanix controllers as VMs in user-space really come down to four core areas:
- Mobility
- Resiliency
- Maintenance / Upgrades
- Performance, yes really
Since the beginning we knew we were more than a single platform company. In that sense, choice has always been a big thing for us, whether it is with hardware, cloud or hypervisor vendors.
By running as a VM in user-space it decouples the Nutanix software from the underlying hypervisor and hardware platforms. This enabled us to rapidly add support for other hypervisors while keeping the core code base the same across all operating environments (on-premises & cloud). Additionally, it gave us flexibility to not be bound to vendor specific release cycles.
Due to the nature of running as a VM in user-space, we can elegantly handle things like upgrades or CVM "failures" as they are outside of the hypervisor. For example, if there is some catastrophic issue where a CVM goes down, the whole node still continues to operate with storage I/Os and services coming from other CVMs in the cluster. During a AOS (Nutanix Core Software) upgrade, we can reboot the CVM without any impact to the workloads running on that host.
But isn't being in the kernel is so much faster? Simple answer, NO.
A common discussion topic is the debate around being in the kernel vs. in user-space. It is recommended to read through the "User vs. Kernel Space" section; it covers what both actually are and the pros and cons of each.
To summarize, there are two areas of execution in an operating system (OS): the kernel (privileged core of the OS where drivers may sit) and user space (where applications/processes sit). Traditionally moving between user-space and the kernel (aka context switch) can be expensive in terms of CPU and time (~1,000ns / context switch).
The debate is that being in the kernel is always better / faster. Which is false. No matter what there will always be context switches in the guest VM's OS.
» Download this section as PDF (opens in a new tab/window)
There are three core principles for distributed systems:
- Must have no single points of failure (SPOF)
- Must not have any bottlenecks at any scale (must be linearly scalable)
- Must leverage concurrency (MapReduce)
Together, a group of Nutanix nodes forms a distributed system (Nutanix cluster) responsible for providing the Prism and AOS capabilities. All services and components are distributed across all CVMs in a cluster to provide for high-availability and linear performance at scale.
The following figure shows an example of how these Nutanix nodes form a Nutanix cluster:
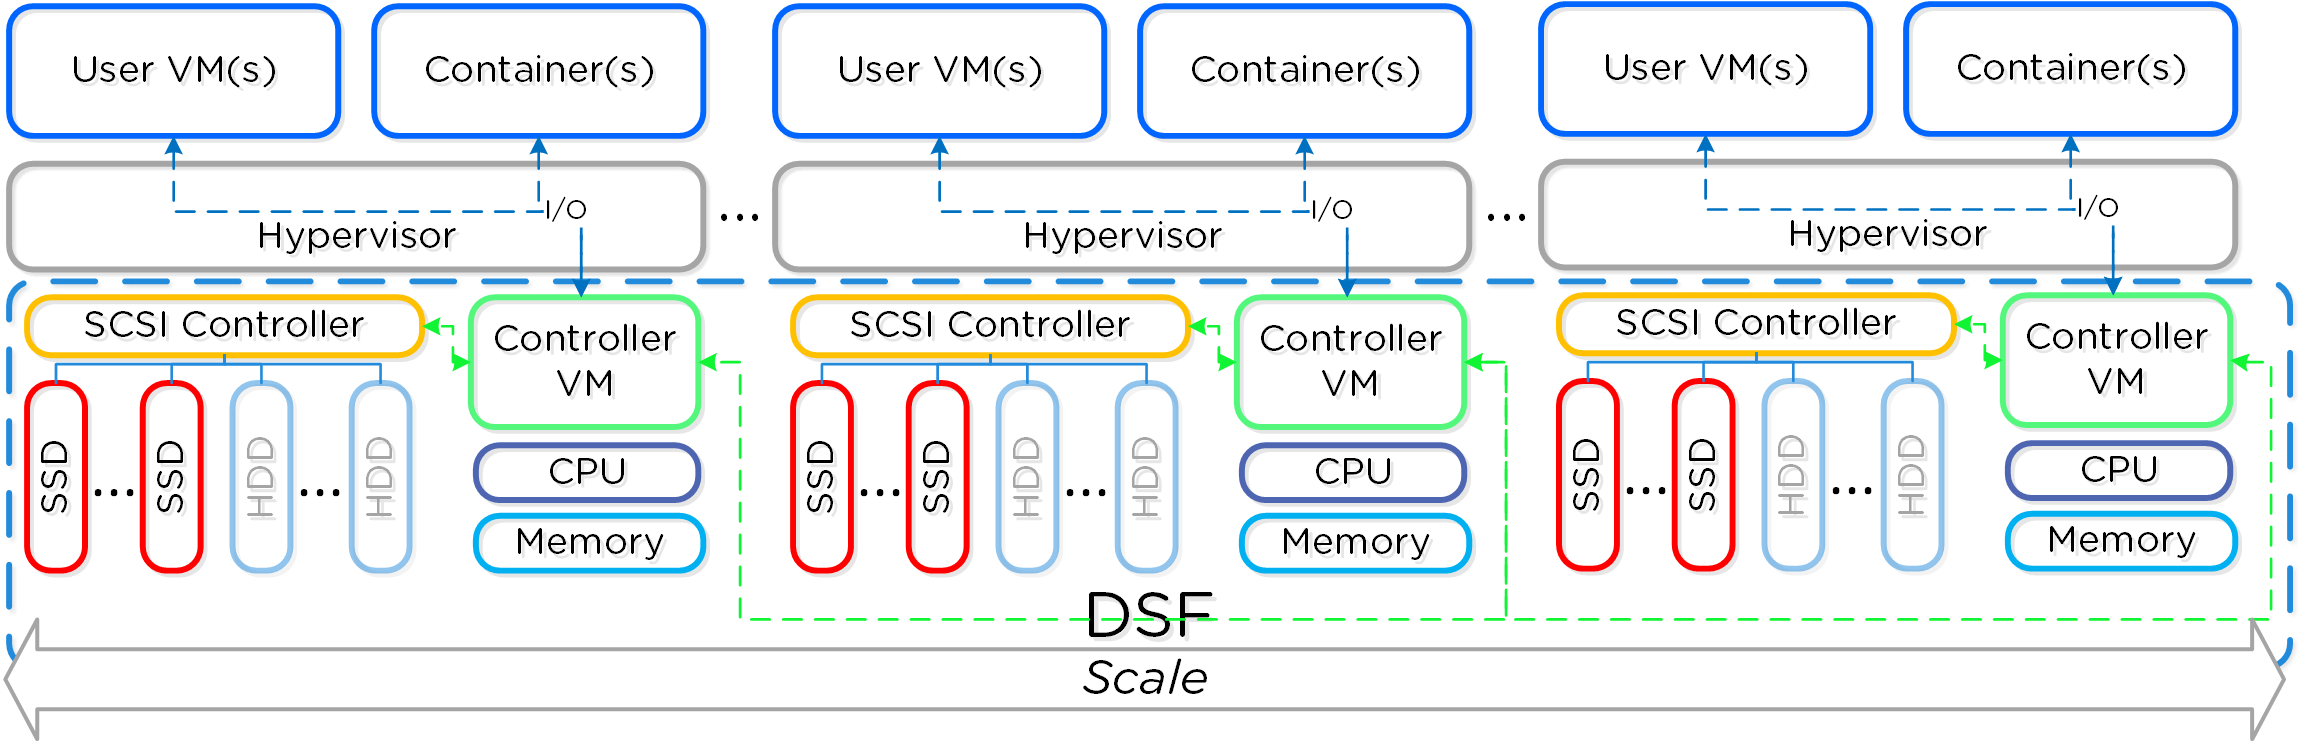 Nutanix Cluster - Distributed System
These techniques are also applied to metadata and data alike. By ensuring metadata and data is distributed across all nodes and all disk devices we can ensure the highest possible performance during normal data ingest and re-protection.
This enables our MapReduce Framework (Curator) to leverage the full power of the cluster to perform activities concurrently. Sample activities include that of data re-protection, compression, erasure coding, deduplication, etc.
The Nutanix cluster is designed to accommodate and remediate failure. The system will transparently handle and remediate the failure, continuing to operate as expected. The user will be alerted, but rather than being a critical time-sensitive item, any remediation (e.g. replace a failed node) can be done on the admin’s schedule.
If you need to add additional resources to your Nutanix cluster, you can scale out linearly simply by adding new nodes. With traditional 3-tier architecture, simply adding additional servers will not scale out your storage performance. However, with a hyperconverged platform like Nutanix, when you scale out with new node(s) you’re scaling out:
- The number of hypervisor / compute nodes
- The number of storage controllers
- The compute and storage performance / capacity
- The number of nodes participating in cluster wide operations
The following figure shows how the % of work handled by each node drastically decreases as the cluster scales:
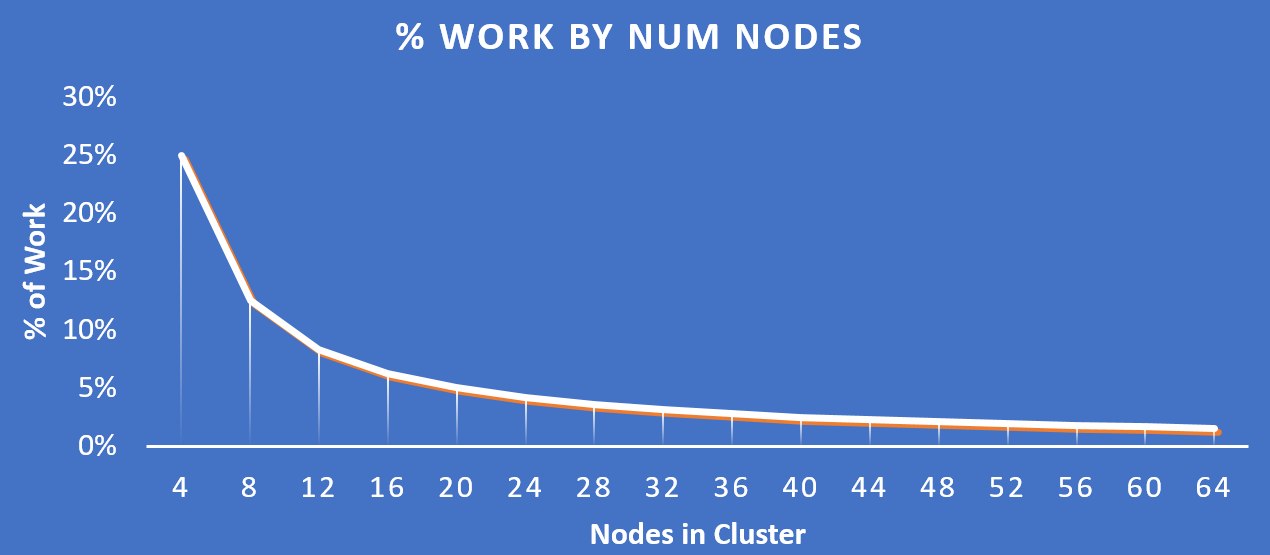 Work Distribution - Cluster Scale
Key point: As the number of nodes in a cluster increases (cluster scaling), certain activities actually become more efficient as each node is handling only a fraction of the work.
» Download this section as PDF (opens in a new tab/window)
There are four core principles for software definition systems:
- Must provide platform mobility (hardware, hypervisor)
- Must not be reliant on any custom hardware
- Must enable rapid speed of development (features, bug fixes, security patches)
- Must take advantage of Moore’s Law
As mentioned above (likely numerous times), the Nutanix platform is a software-based solution which ships as a bundled software + hardware appliance. The controller VM is where the vast majority of the Nutanix software and logic sits and was designed from the beginning to be an extensible and pluggable architecture. A key benefit to being software-defined and not relying upon any hardware offloads or constructs is around extensibility. As with any product life cycle, advancements and new features will always be introduced.
By not relying on any custom ASIC/FPGA or hardware capabilities, Nutanix can develop and deploy these new features through a simple software update. This means that the deployment of a new feature (e.g., deduplication) can be deployed by upgrading the current version of the Nutanix software. This also allows newer generation features to be deployed on legacy hardware models. For example, say you’re running a workload running an older version of Nutanix software on a prior generation hardware platform (e.g., 2400). The running software version doesn’t provide deduplication capabilities which your workload could benefit greatly from. To get these features, you perform a rolling upgrade of the Nutanix software version while the workload is running, and you now have deduplication. It’s really that easy.
Similar to features, the ability to create new “adapters” or interfaces into DSF is another key capability. When the product first shipped, it solely supported iSCSI for I/O from the hypervisor, this has now grown to include NFS and SMB. In the future, there is the ability to create new adapters for various workloads and hypervisors (HDFS, etc.). And again, all of this can be deployed via a software update. This is contrary to most legacy infrastructures, where a hardware upgrade or software purchase is normally required to get the “latest and greatest” features. With Nutanix, it’s different. Since all features are deployed in software, they can run on any hardware platform, any hypervisor, and be deployed through simple software upgrades.
The following figure shows a logical representation of what this software-defined controller framework looks like:
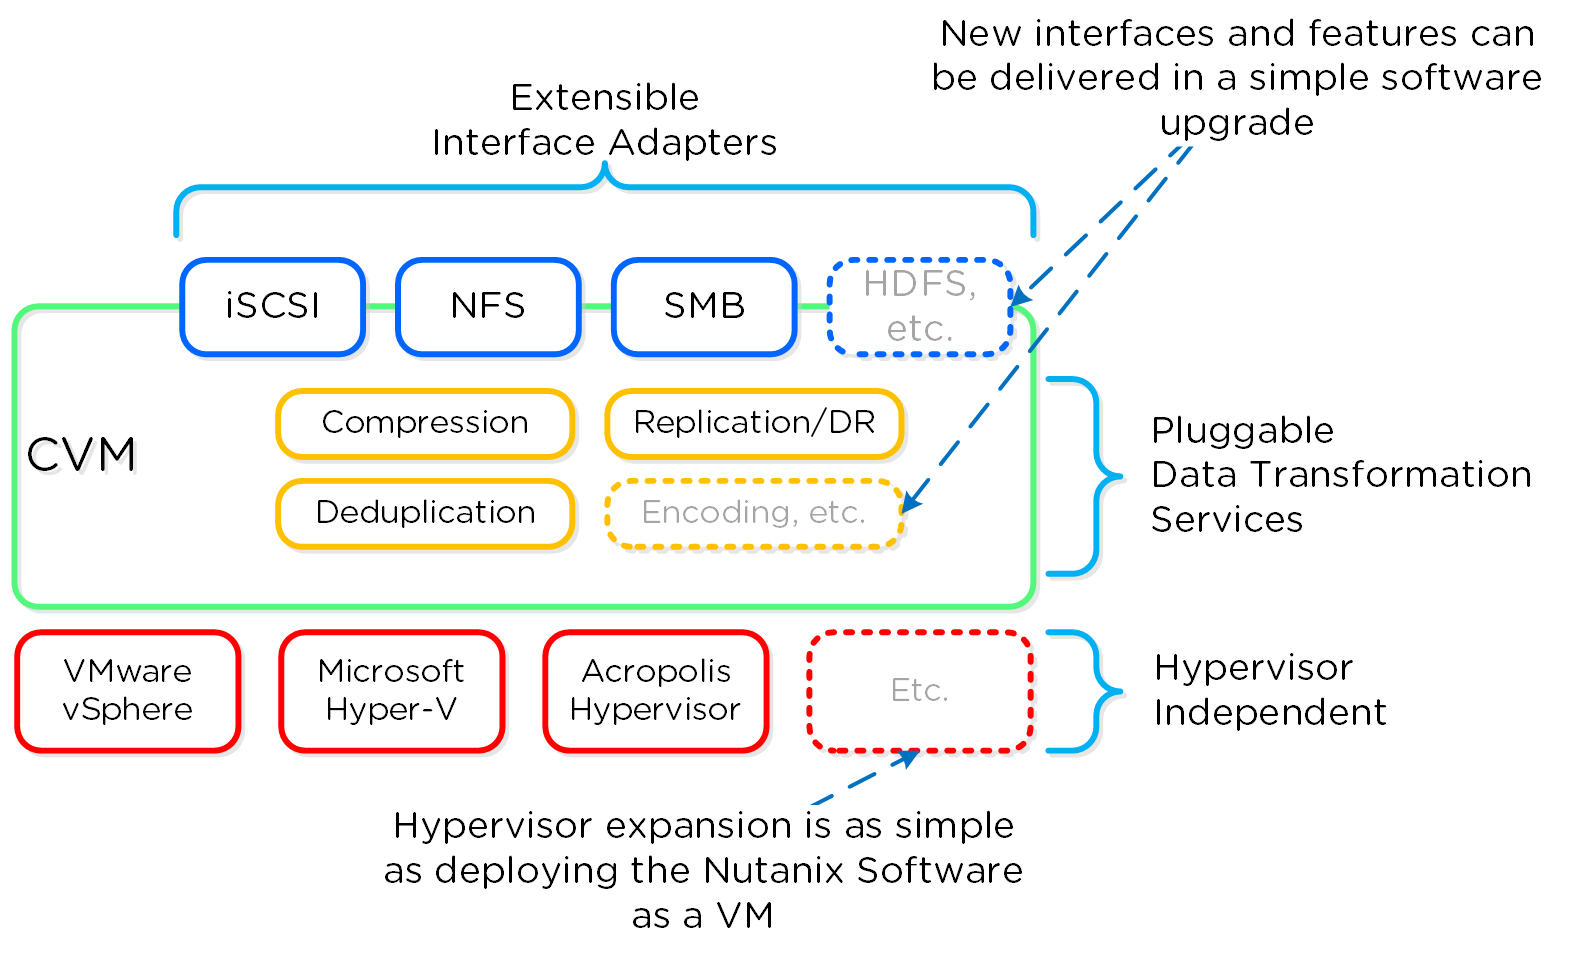 Software-Defined Controller Framework
» Download this section as PDF (opens in a new tab/window)
The user-facing Nutanix product is extremely simple to deploy and use. This is primarily possible through abstraction and a lot of automation / integration in the software.
The following is a detailed view of the main Nutanix Cluster components (don’t worry, no need to memorize or know what everything does):
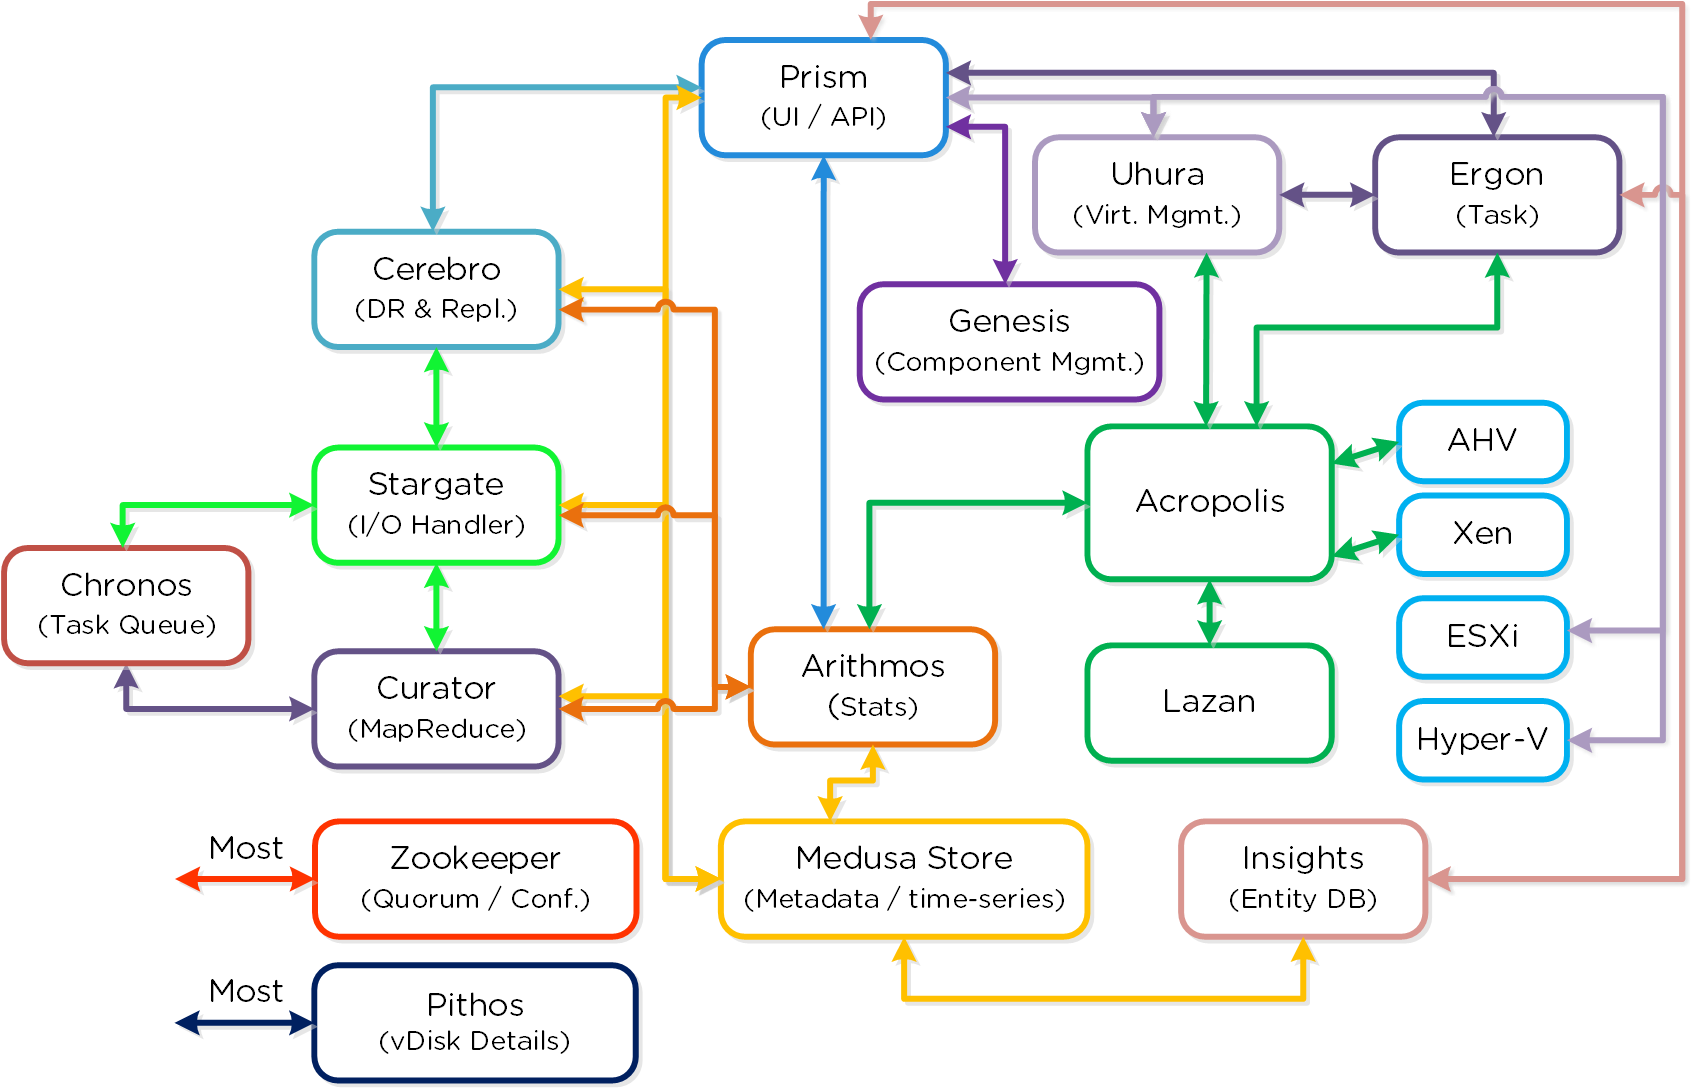 Nutanix Cluster Components
Cassandra
- Key Role: Distributed metadata store
- Description: Cassandra stores and manages all of the cluster metadata in a distributed ring-like manner based upon a heavily modified Apache Cassandra. The Paxos algorithm is utilized to enforce strict consistency. This service runs on every node in the cluster. The Cassandra is accessed via an interface called Medusa.
Zookeeper
- Key Role: Cluster configuration manager
- Description: Zookeeper stores all of the cluster configuration including hosts, IPs, state, etc. and is based upon Apache Zookeeper. This service runs on three nodes in the cluster, one of which is elected as a leader. The leader receives all requests and forwards them to its peers. If the leader fails to respond, a new leader is automatically elected. Zookeeper is accessed via an interface called Zeus.
Stargate
- Key Role: Data I/O manager
- Description: Stargate is responsible for all data management and I/O operations and is the main interface from the hypervisor (via NFS, iSCSI, or SMB). This service runs on every node in the cluster in order to serve localized I/O.
Curator
- Key Role: MapReduce cluster management and cleanup
- Description: Curator is responsible for managing and distributing tasks throughout the cluster, including disk balancing, proactive scrubbing, and many more items. Curator runs on every node and is controlled by an elected Curator Leader who is responsible for the task and job delegation. There are two scan types for Curator, a full scan which occurs around every 6 hours and a partial scan which occurs every hour.
Prism
- Key Role: UI and API
- Description: Prism is the management gateway for component and administrators to configure and monitor the Nutanix cluster. This includes Ncli, the HTML5 UI, and REST API. Prism runs on every node in the cluster and uses an elected leader like all components in the cluster.
Genesis
- Key Role: Cluster component & service manager
- Description: Genesis is a process which runs on each node and is responsible for any services interactions (start/stop/etc.) as well as for the initial configuration. Genesis is a process which runs independently of the cluster and does not require the cluster to be configured/running. The only requirement for Genesis to be running is that Zookeeper is up and running. The cluster_init and cluster_status pages are displayed by the Genesis process.
Chronos
- Key Role: Job and task scheduler
- Description: Chronos is responsible for taking the jobs and tasks resulting from a Curator scan and scheduling/throttling tasks among nodes. Chronos runs on every node and is controlled by an elected Chronos Leader that is responsible for the task and job delegation and runs on the same node as the Curator Leader.
Cerebro
- Key Role: Replication/DR manager
- Description: Cerebro is responsible for the replication and DR capabilities of DSF. This includes the scheduling of snapshots, the replication to remote sites, and the site migration/failover. Cerebro runs on every node in the Nutanix cluster and all nodes participate in replication to remote clusters/sites.
Pithos
- Key Role: vDisk configuration manager
- Description: Pithos is responsible for vDisk (DSF file) configuration data. Pithos runs on every node and is built on top of Cassandra.
» Download this section as PDF (opens in a new tab/window)
In ‘Nutanix Software Upgrade’ and ‘Hypervisor Upgrade’ within the Prism section, we highlighted the steps used to perform an upgrade of AOS and hypervisor versions. This section will cover the techniques allowing us to perform different types of upgrades in a non-disruptive manner.
AOS Upgrades
For an AOS upgrade there are a few core steps that are performed:
1 - Pre-upgrade Checks
During the pre-upgrade checks, the following items are verified. NOTE: This must complete successfully before an upgrade can continue.
- Check version compatibility between AOS, hypervisor versions
- Check cluster health (cluster status, free space, and component checks (e.g. Medusa, Stargate, Zookeeper, etc.)
- Check network connectivity between all CVMs and Hypervisors
2 - Upload upgrade software to 2 nodes
Once the pre-upgrade checks have been completed, the system will upload the upgrade software binaries to two nodes in the cluster. This is done for fault-tolerance and to ensure if one CVM is rebooting the other is available for others to pull the software from.
3 - Stage Upgrade Software
Once the software has been uploaded to two CVMs, all CVMs will stage the upgrade in parallel.
The CVMs have two partitions for AOS versions:
- Active partition (the currently running version)
- Passive partition (where upgrades are staged)
When an AOS upgrade occurs, we perform the upgrade on the non-active partition. When the upgrade token is received it will mark the upgraded partition as the active partition and reboot the CVM into the upgraded version. This is similar to a bootbank / altbootbank.
NOTE: the upgrade token is passed between nodes iteratively. This ensures only one CVM reboots at a time. Once the CVM reboots and is stable (check service status and communication) the token can be passed to the next CVM until all CVMs have been upgraded.
Note
Upgrade Error Handling
A common question is what happens if the upgrade is unsuccessful or has an issue partially through the process?
In the event some upgrade issue occurs we will stall the upgrade and not progress. NOTE: this is a very infrequent occurrence as pre-upgrade checks will find most issues before the upgrade actually begins. However, in the event the pre-upgrade checks succeed and some issue occurs during the actual upgrade, there will be no impact to workloads and user I/O running on the cluster.
The Nutanix software is designed to work indefinitely in a mixed mode between supported upgrade versions. For example, if the cluster is running x.y.foo and is upgrading to x.y.bar the system can run indefinitely with CVMs on both versions. This is actually what occurs during the upgrade process.
For example, if you have a 4 node cluster on x.y.foo and start the upgrade to x.y.bar, when the first node upgrades it will be running x.y.bar while the others are on x.y.foo. This process will continue and CVMs will reboot into x.y.bar as they receive the upgrade token.
» Download this section as PDF (opens in a new tab/window)
Foundation Imaging Architecture
Foundation is a Nutanix provided tool leveraged for bootstrapping, imaging and deployment of Nutanix clusters. The imaging process will install the desired version of the AOS software as well as the hypervisor of choice.
By default Nutanix nodes ship with AHV pre-installed, to leverage a different hypervisor type you must use foundation to re-image the nodes with the desired hypervisor. NOTE: Some OEMs will ship directly from the factory with the desired hypervisor.
The figure shows a high level view of the Foundation architecture:
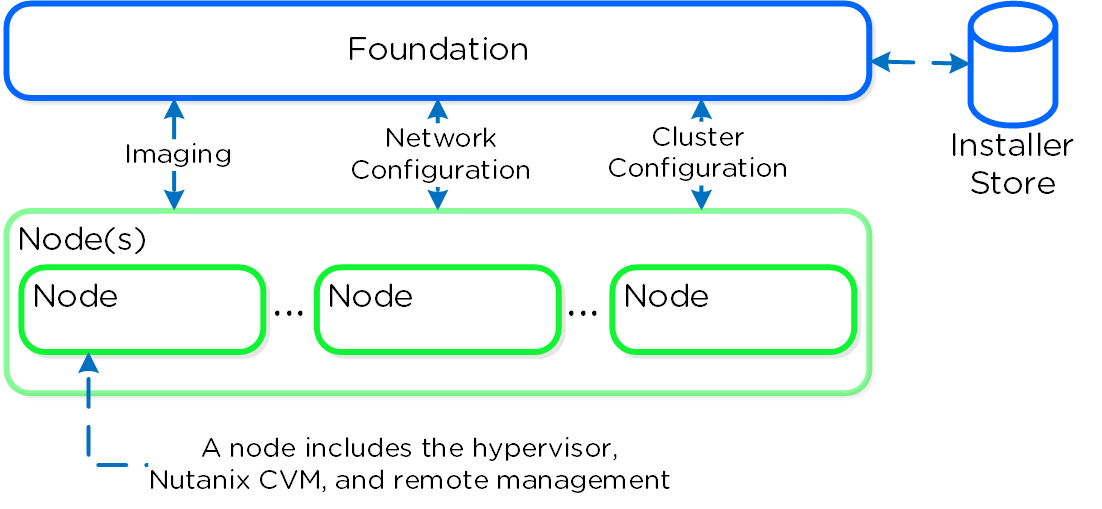 Foundation - Architecture
As of 4.5, Foundation is built in to the CVMs to simplify configuration. The installer store is a directory for storing uploaded images, these can be used for the initial imaging as well as cluster expansion when imaging is required.
The Foundation Discovery Applet (which can be found HERE) is responsible for discovering nodes and allowing the user to select a node to connect to. Once the user has selected a node to connect to, the applet will proxy localhost:9442 IPv4 to the CVM’s IPv6 link-local address on port 8000.
The figure shows a high level view of the applet architecture:
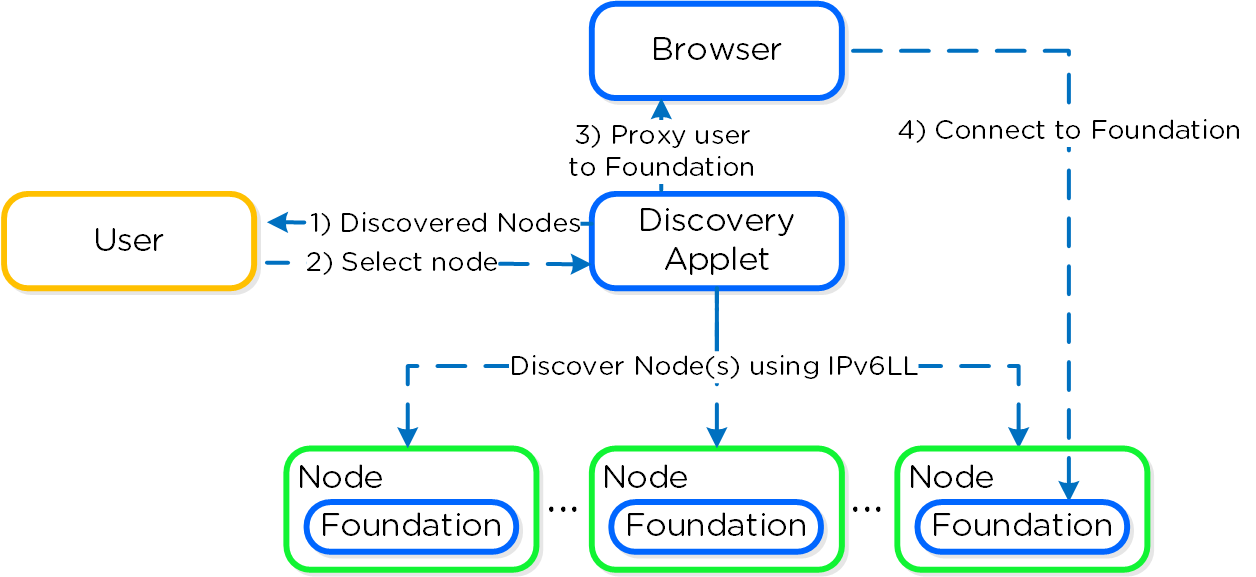 Foundation - Applet Architecture
NOTE: the discovery applet is merely a means of discovery and proxy to the Foundation service which runs on the nodes. All of the imaging and configuration is handled by the Foundation service, not the applet.
Note
Pro tip
If you're on a different network (L2) than your target Nutanix nodes (e.g. over the WAN) you can connect directly to the Foundation service on the CVM if it has an IPv4 address assigned (instead of using the discovery applet).
To directly connect browse to <CVM_IP>:8000/gui/index.html
Inputs
The Foundation tool has the following configuration inputs (below). A typical deployment requires 3 IP addresses per node (hypervisor, CVM, remote management (e.g. IPMI, iDRAC, etc.)). In addition to the per node addresses, it is recommended to set a Cluster and Data Services IP addresses.
- Cluster
- Name
- IP*
- NTP*
- DNS*
- CVM
- IP per CVM
- Netmask
- Gateway
- Memory
- Hypervisor
- IP per hypervisor host
- Netmask
- Gateway
- DNS*
- Hostname prefix
- IPMI*
- IP per node
- Netmask
- Gateway
NOTE: Items marked with ‘*’ are optional but highly advisable
System Imaging and Deployment
The first step is to connect to the Foundation UI which can be done via the discovery applet (if on same L2, node IPs unecessary):
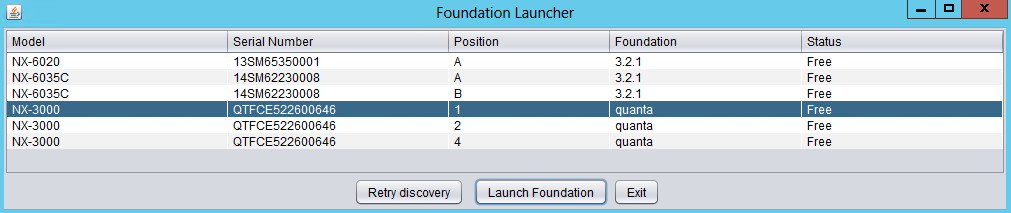 Foundation - Discovery Applet
If you can’t find the desired node, make sure you’re on the same L2 network.
After connecting into the selected node’s Foundation instance the main Foundation UI will appear:
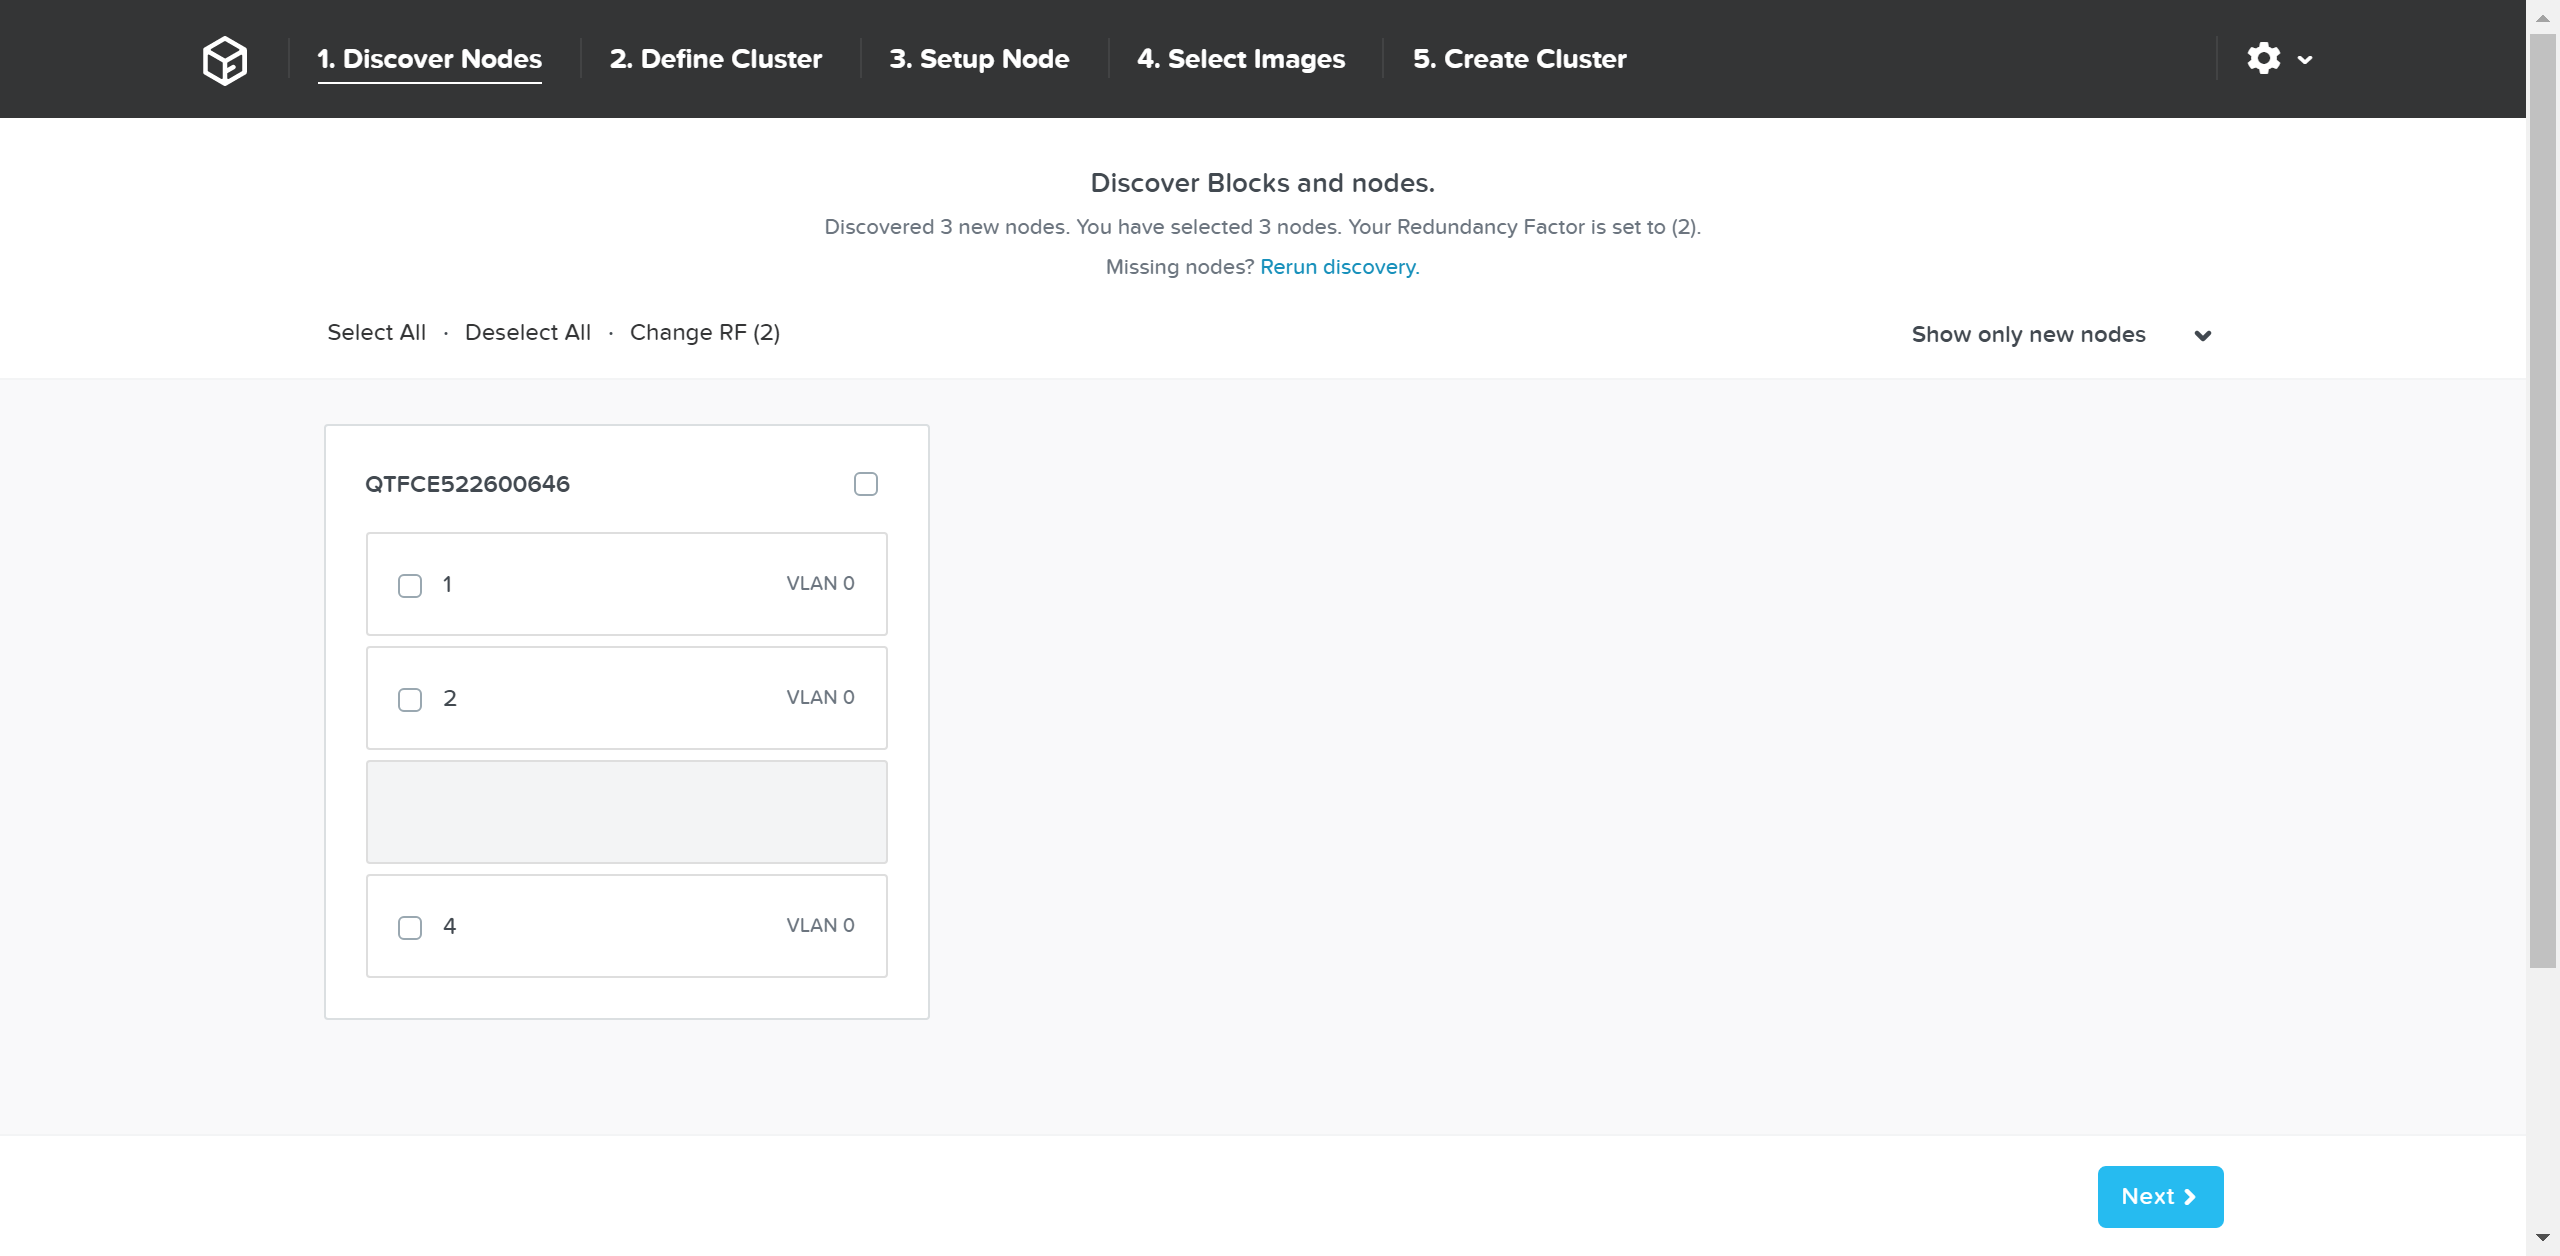 Foundation - Discovery Page
This will show all of the discovered nodes and their chassis. Select the desired nodes to form the cluster and click ‘Next’
 Foundation - Node Selection
The next page prompts for the cluster and network inputs:
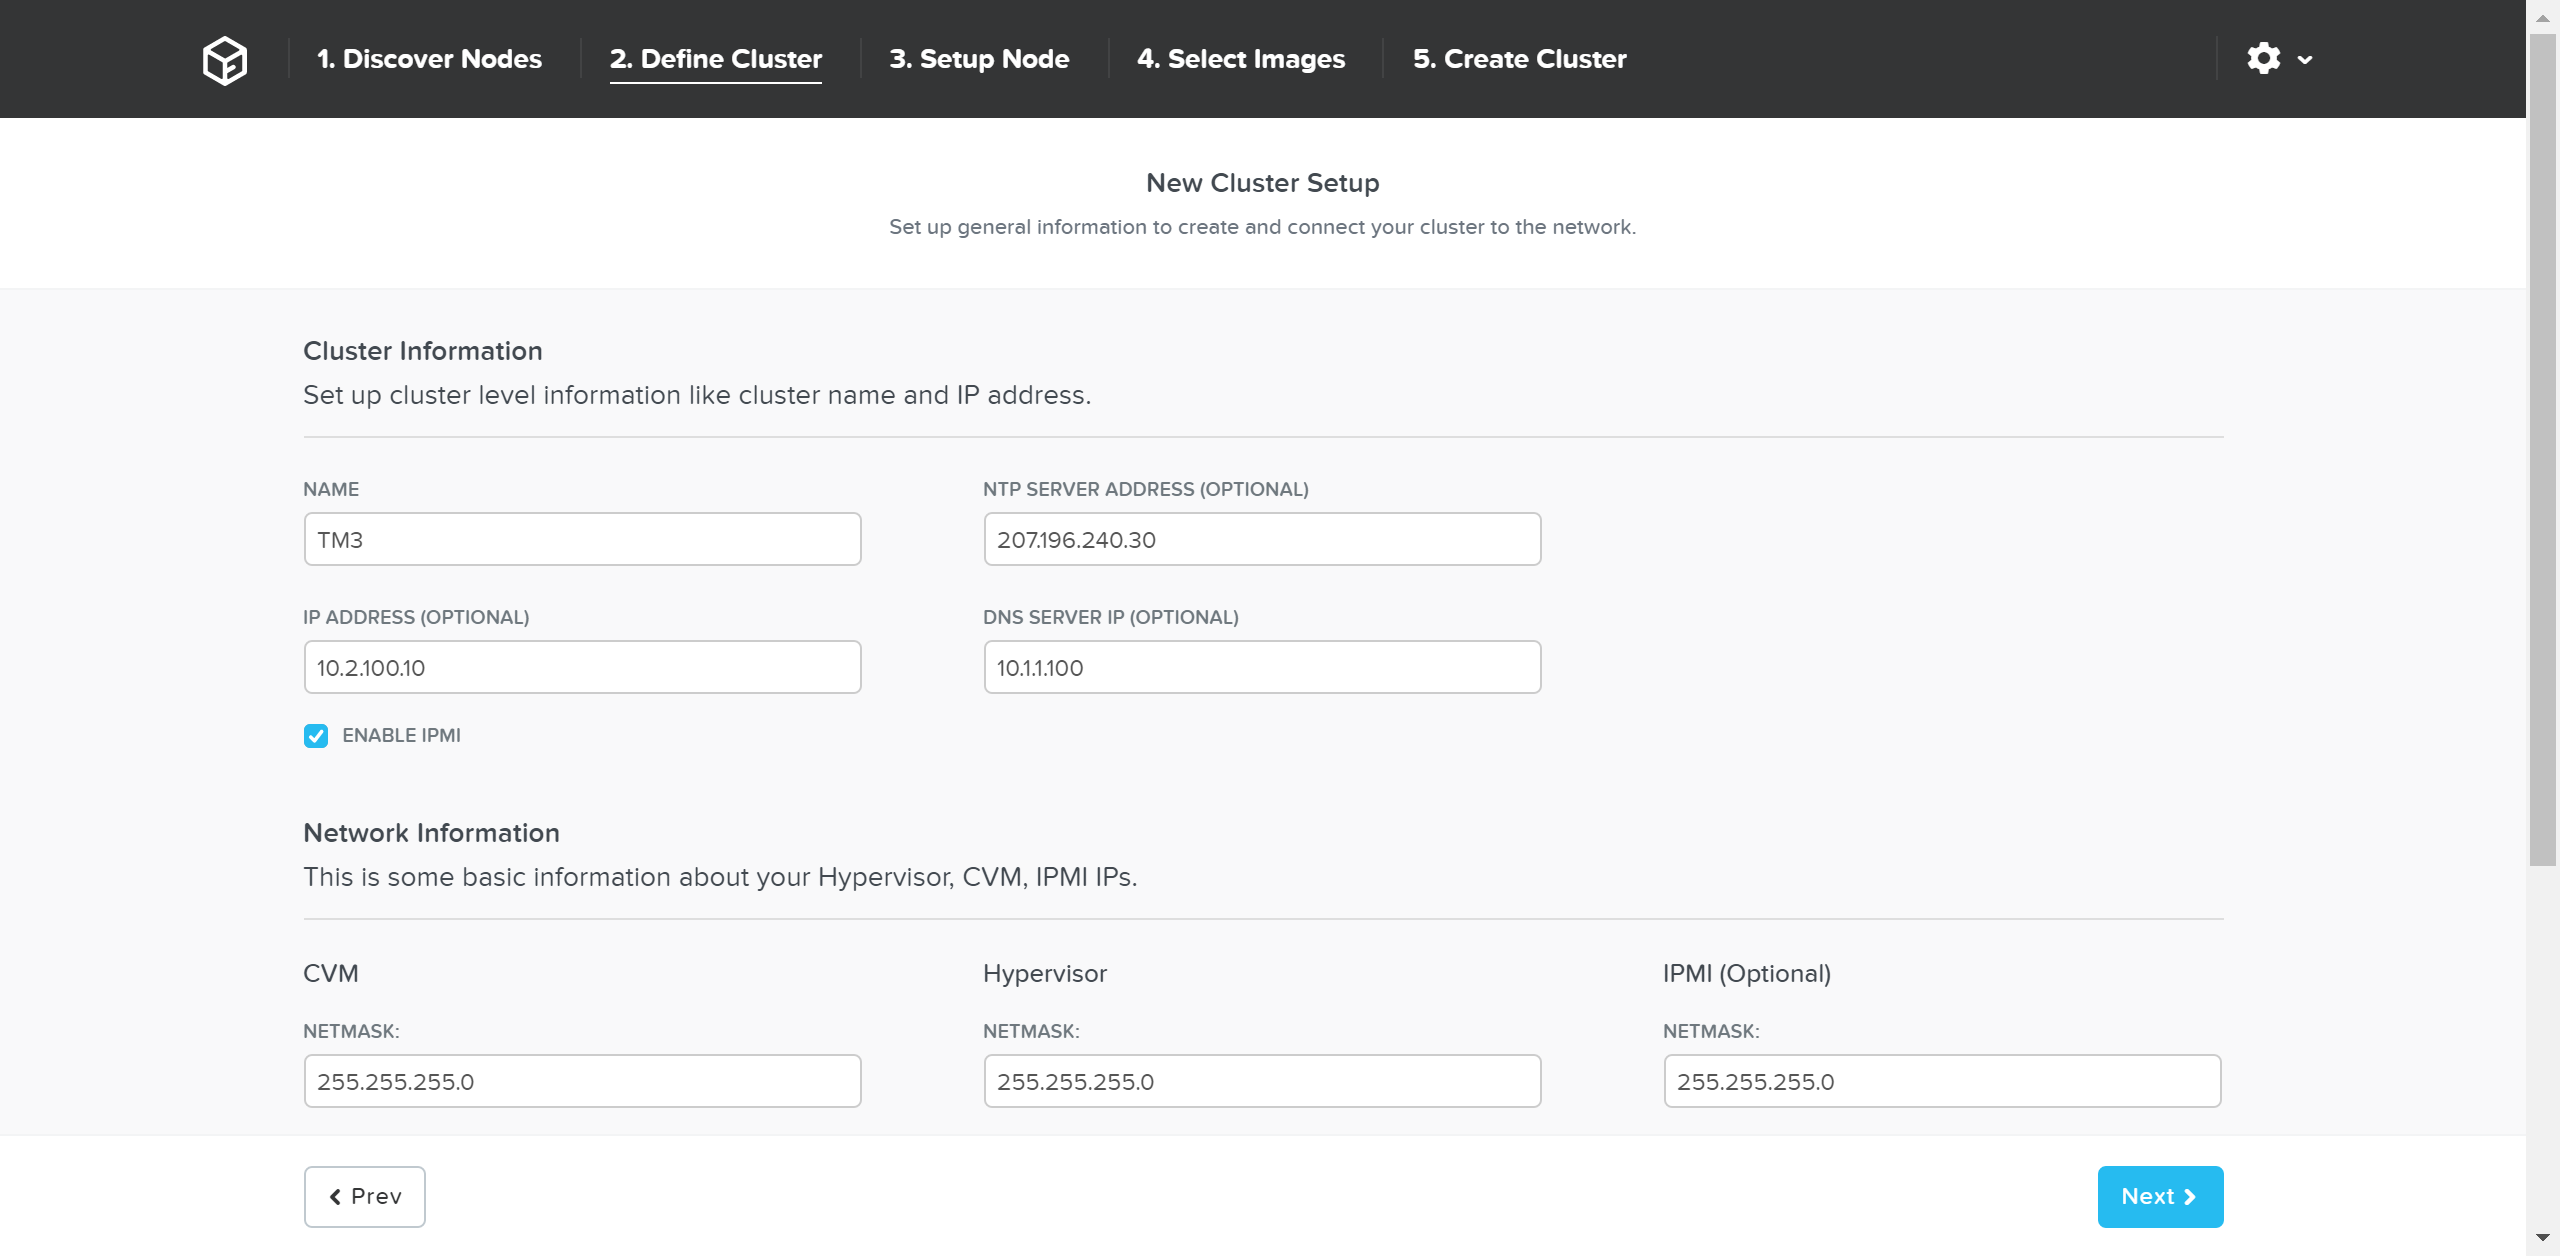 Foundation - Cluster Information
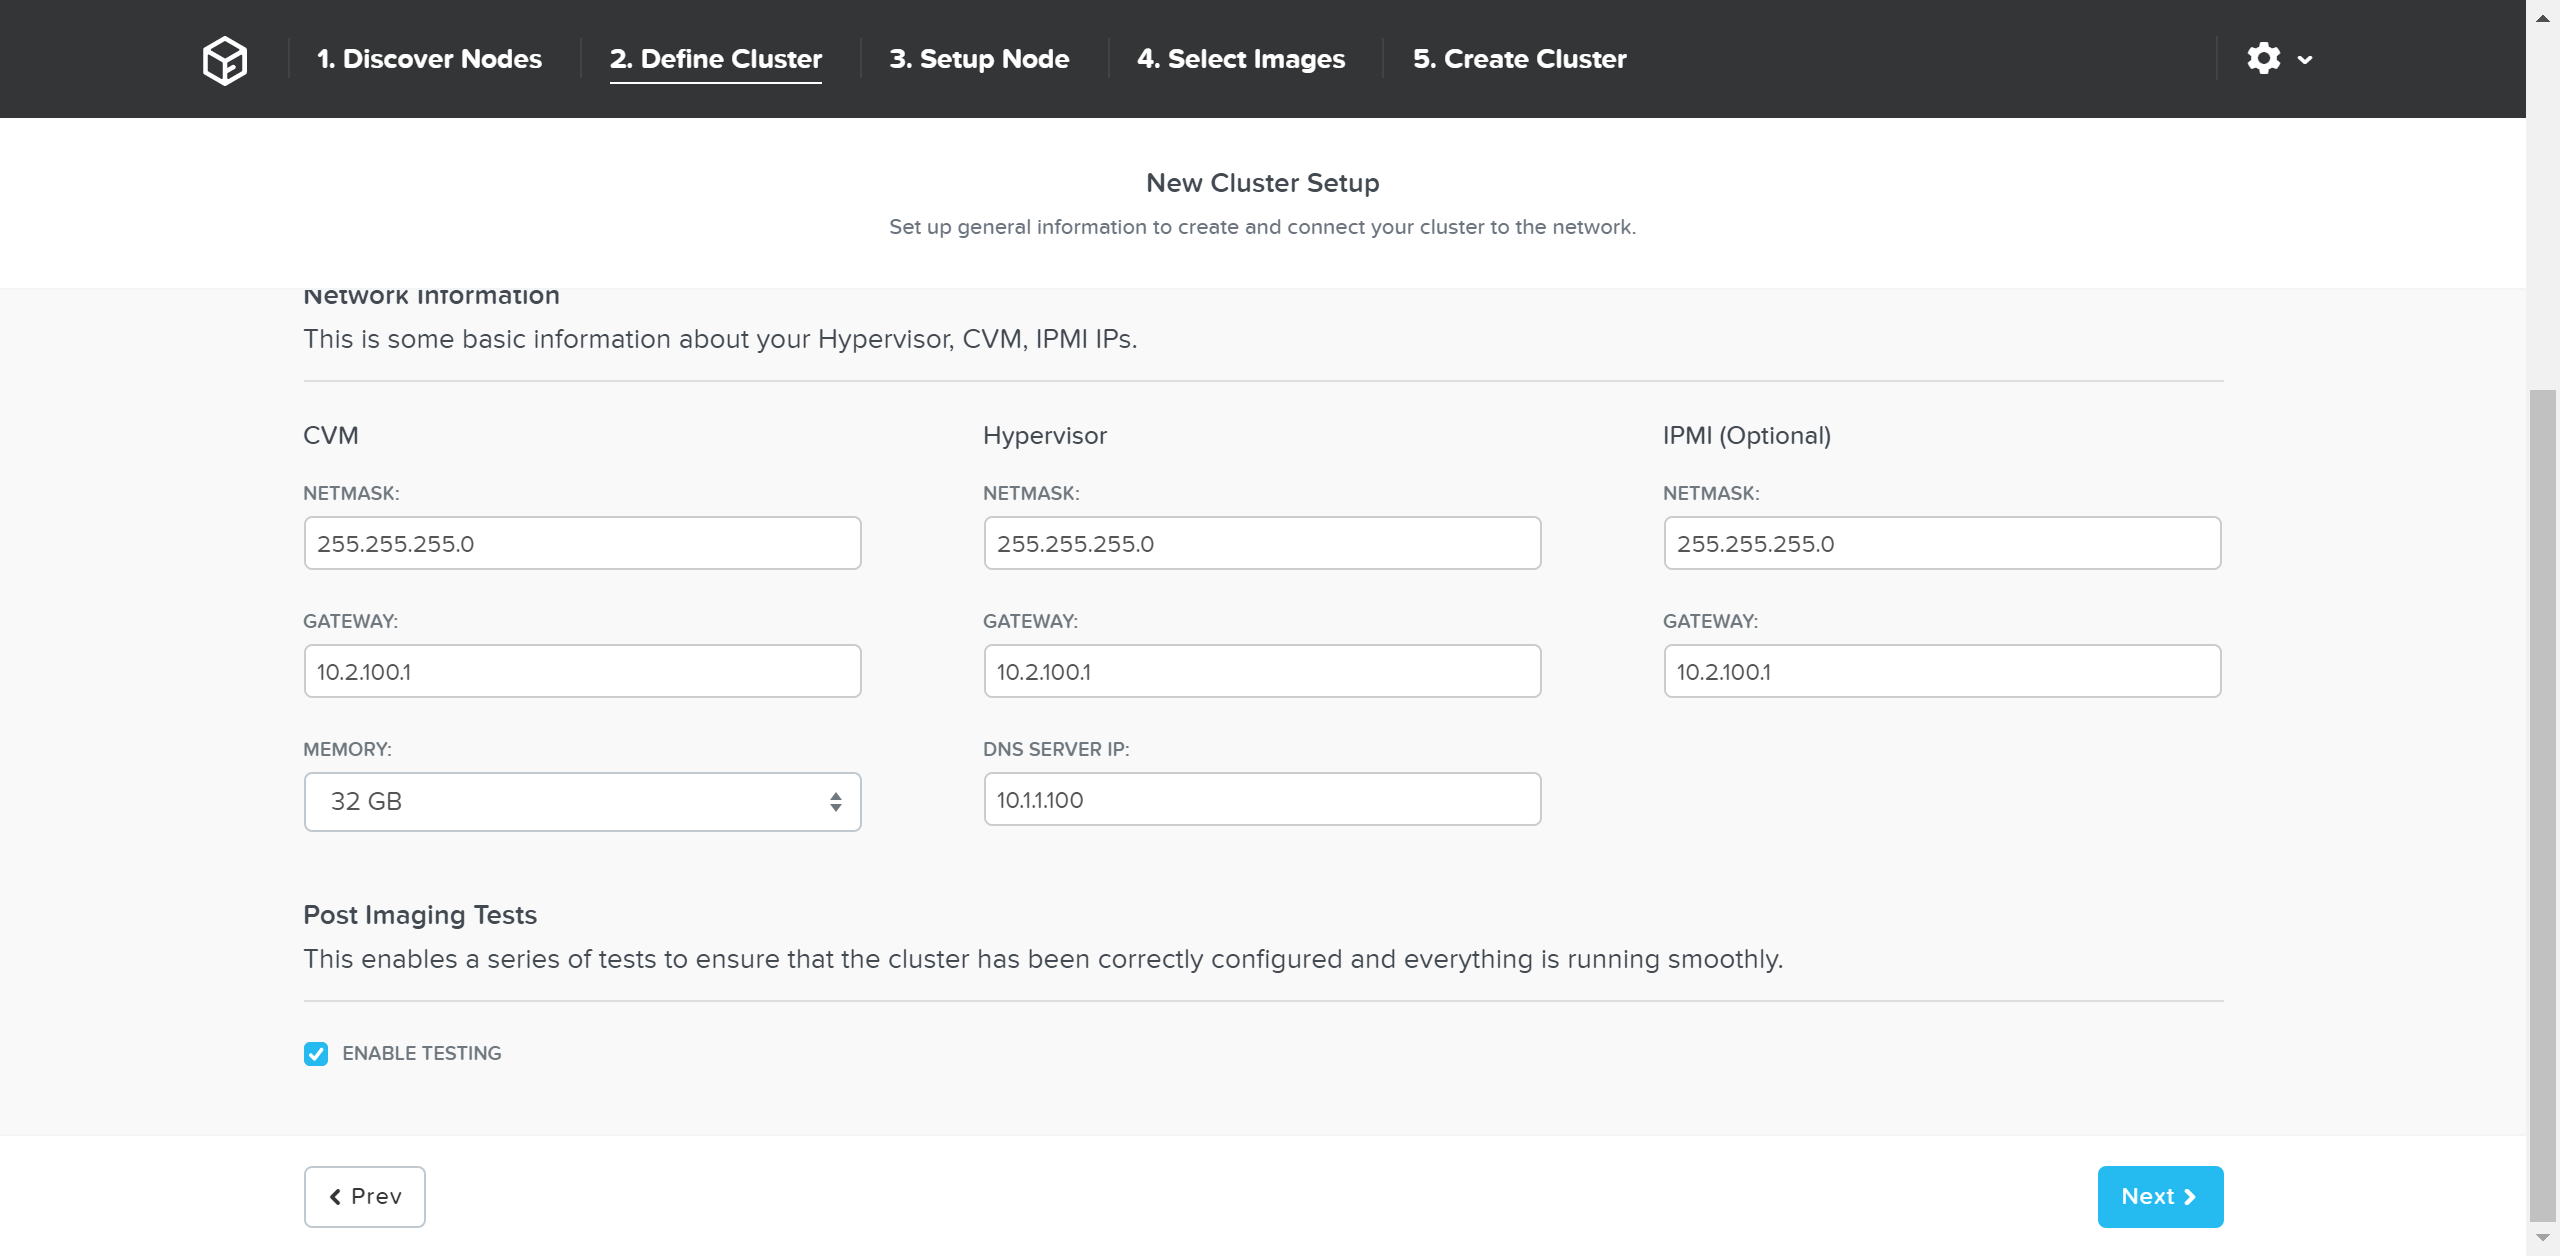 Foundation - Network Information
Once the details have been input, click ‘Next’
Next we’ll input the node details and IP addresses:
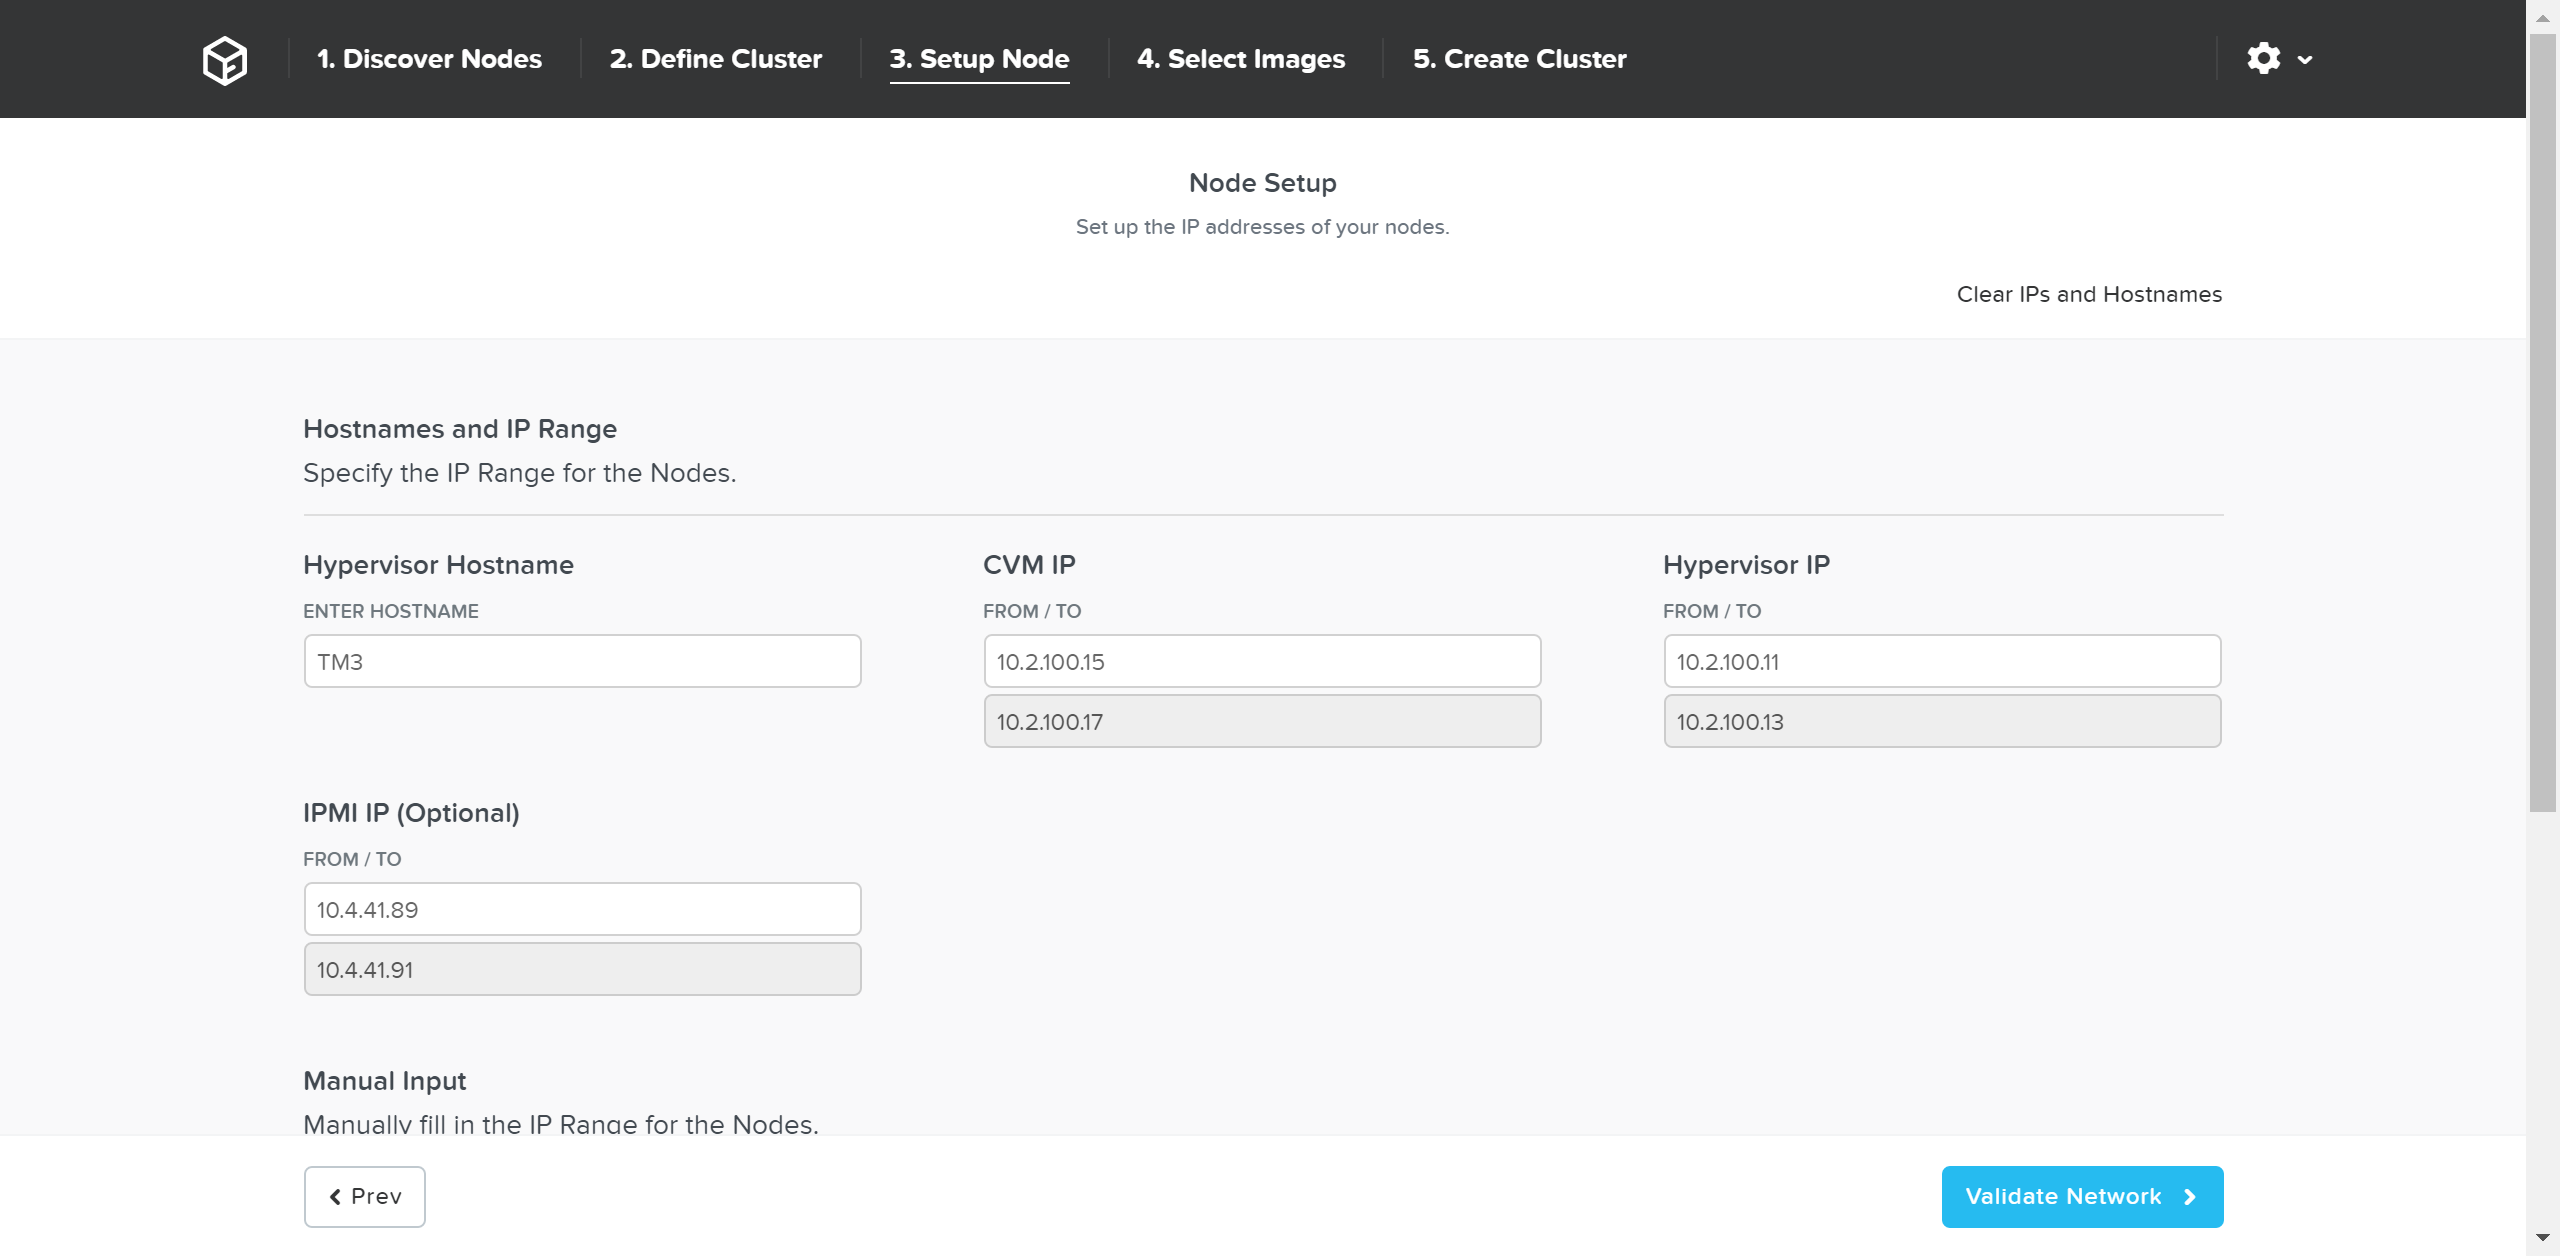 Foundation - Node Setup
You can manually override the hostname and IP addresses if necessary:
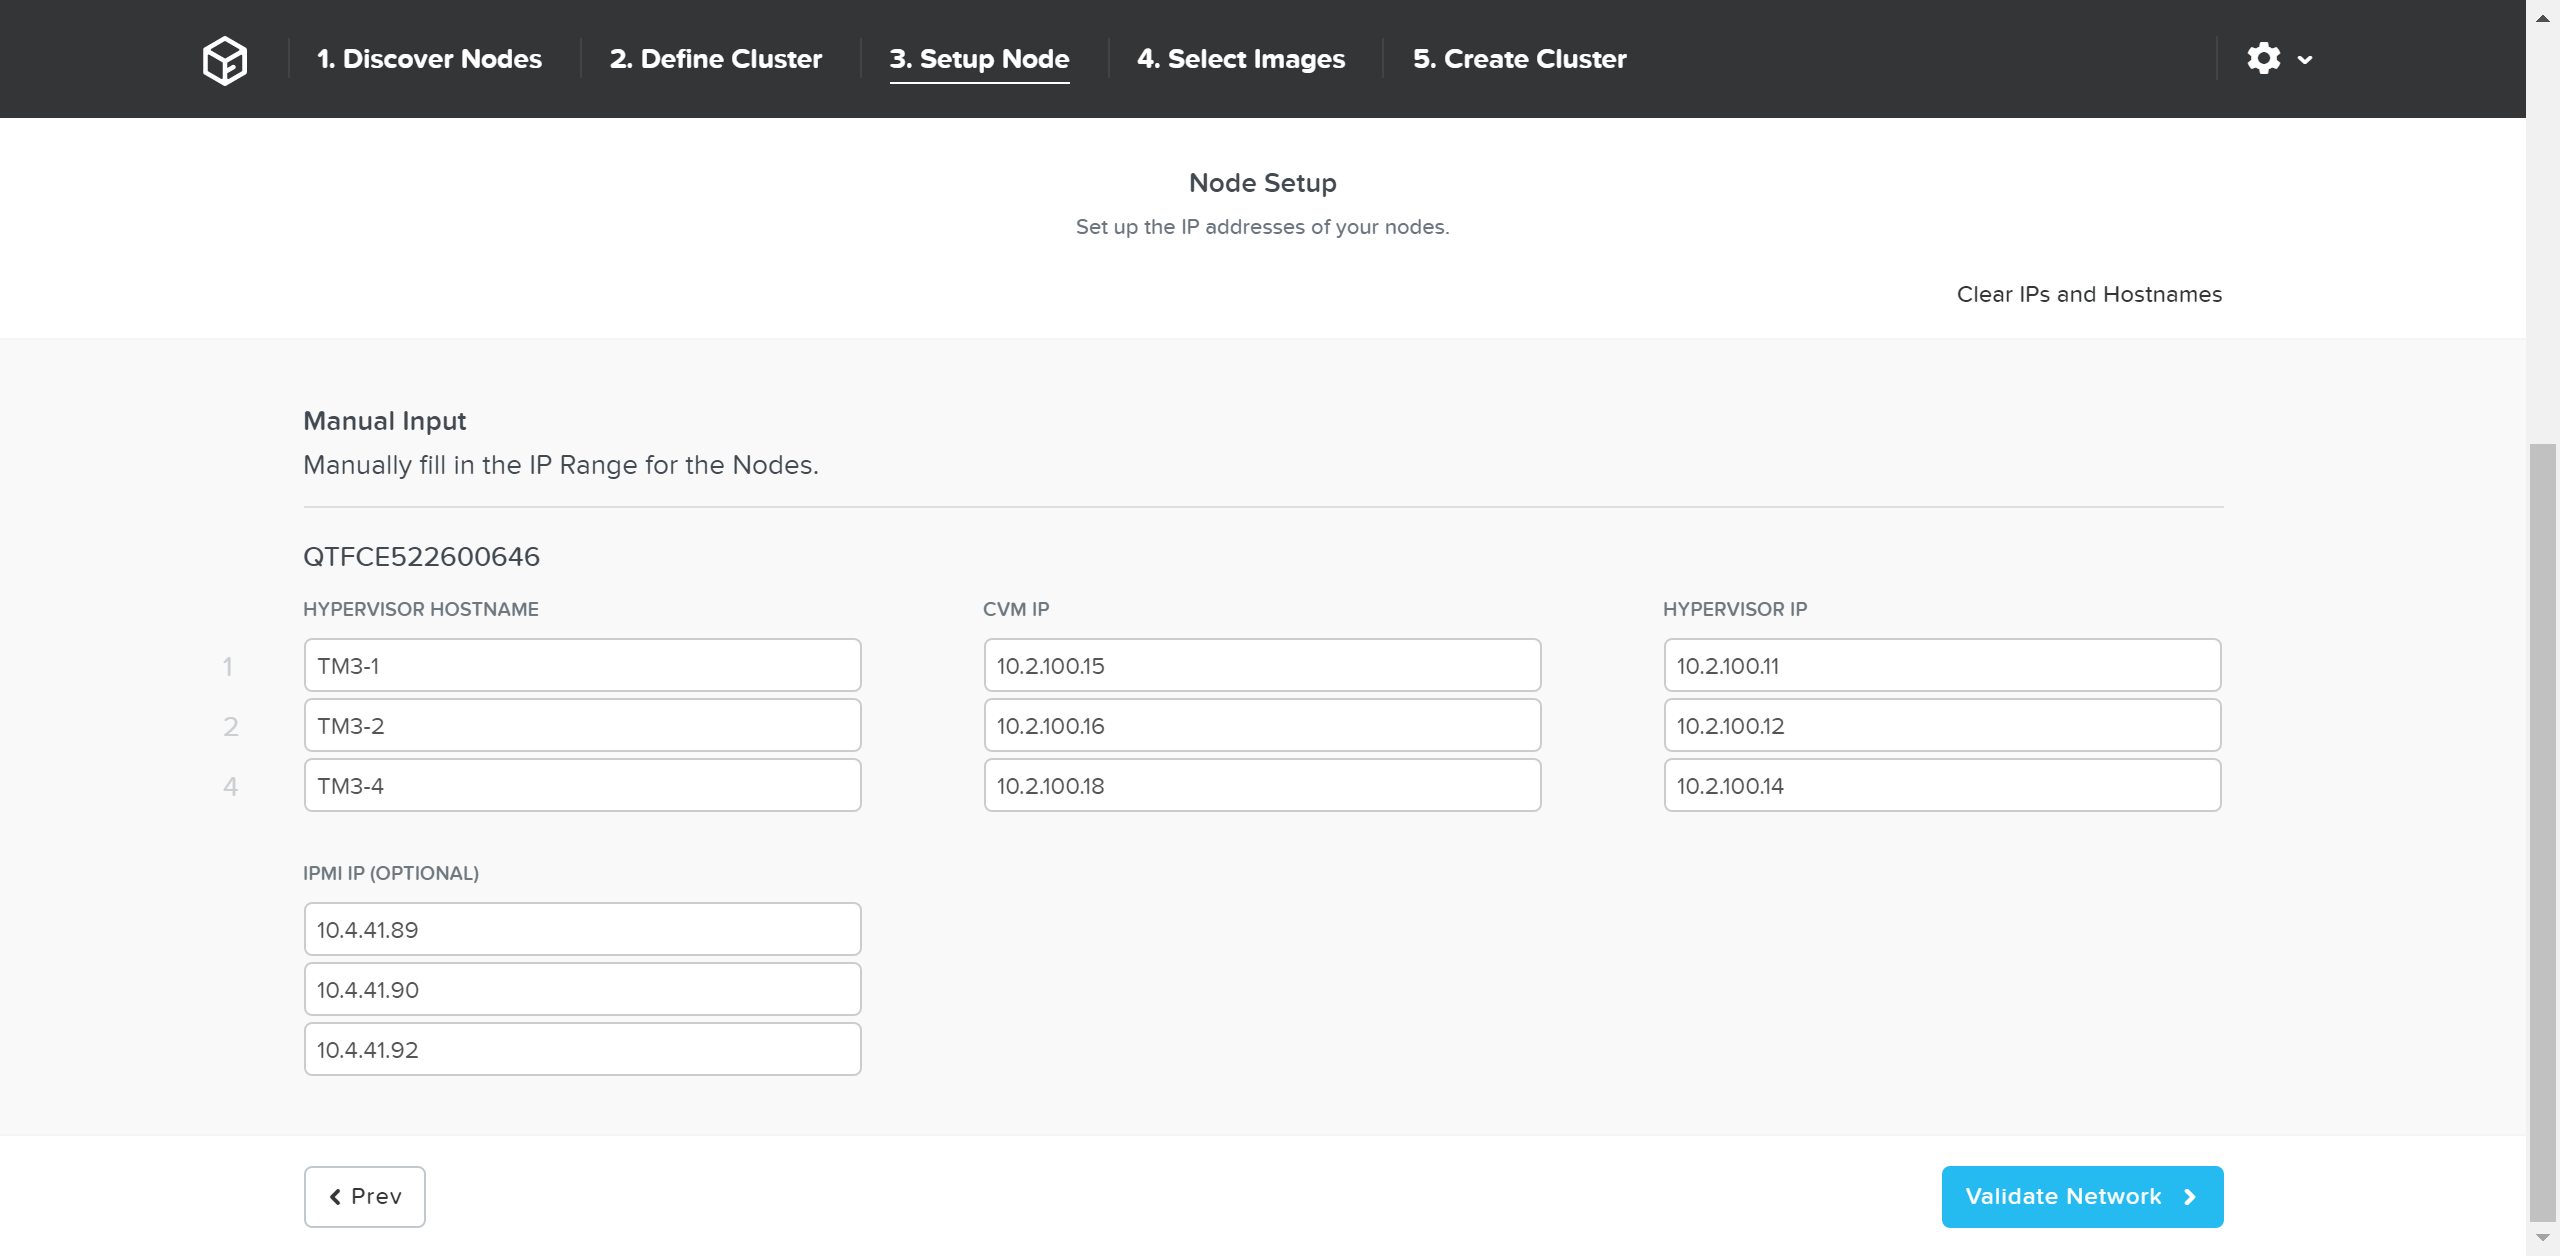 Foundation - Hostname and IP
Click ‘Validate Network’ to validate network configuration and proceed. This will check for IP address conflicts and ensure connectivity.
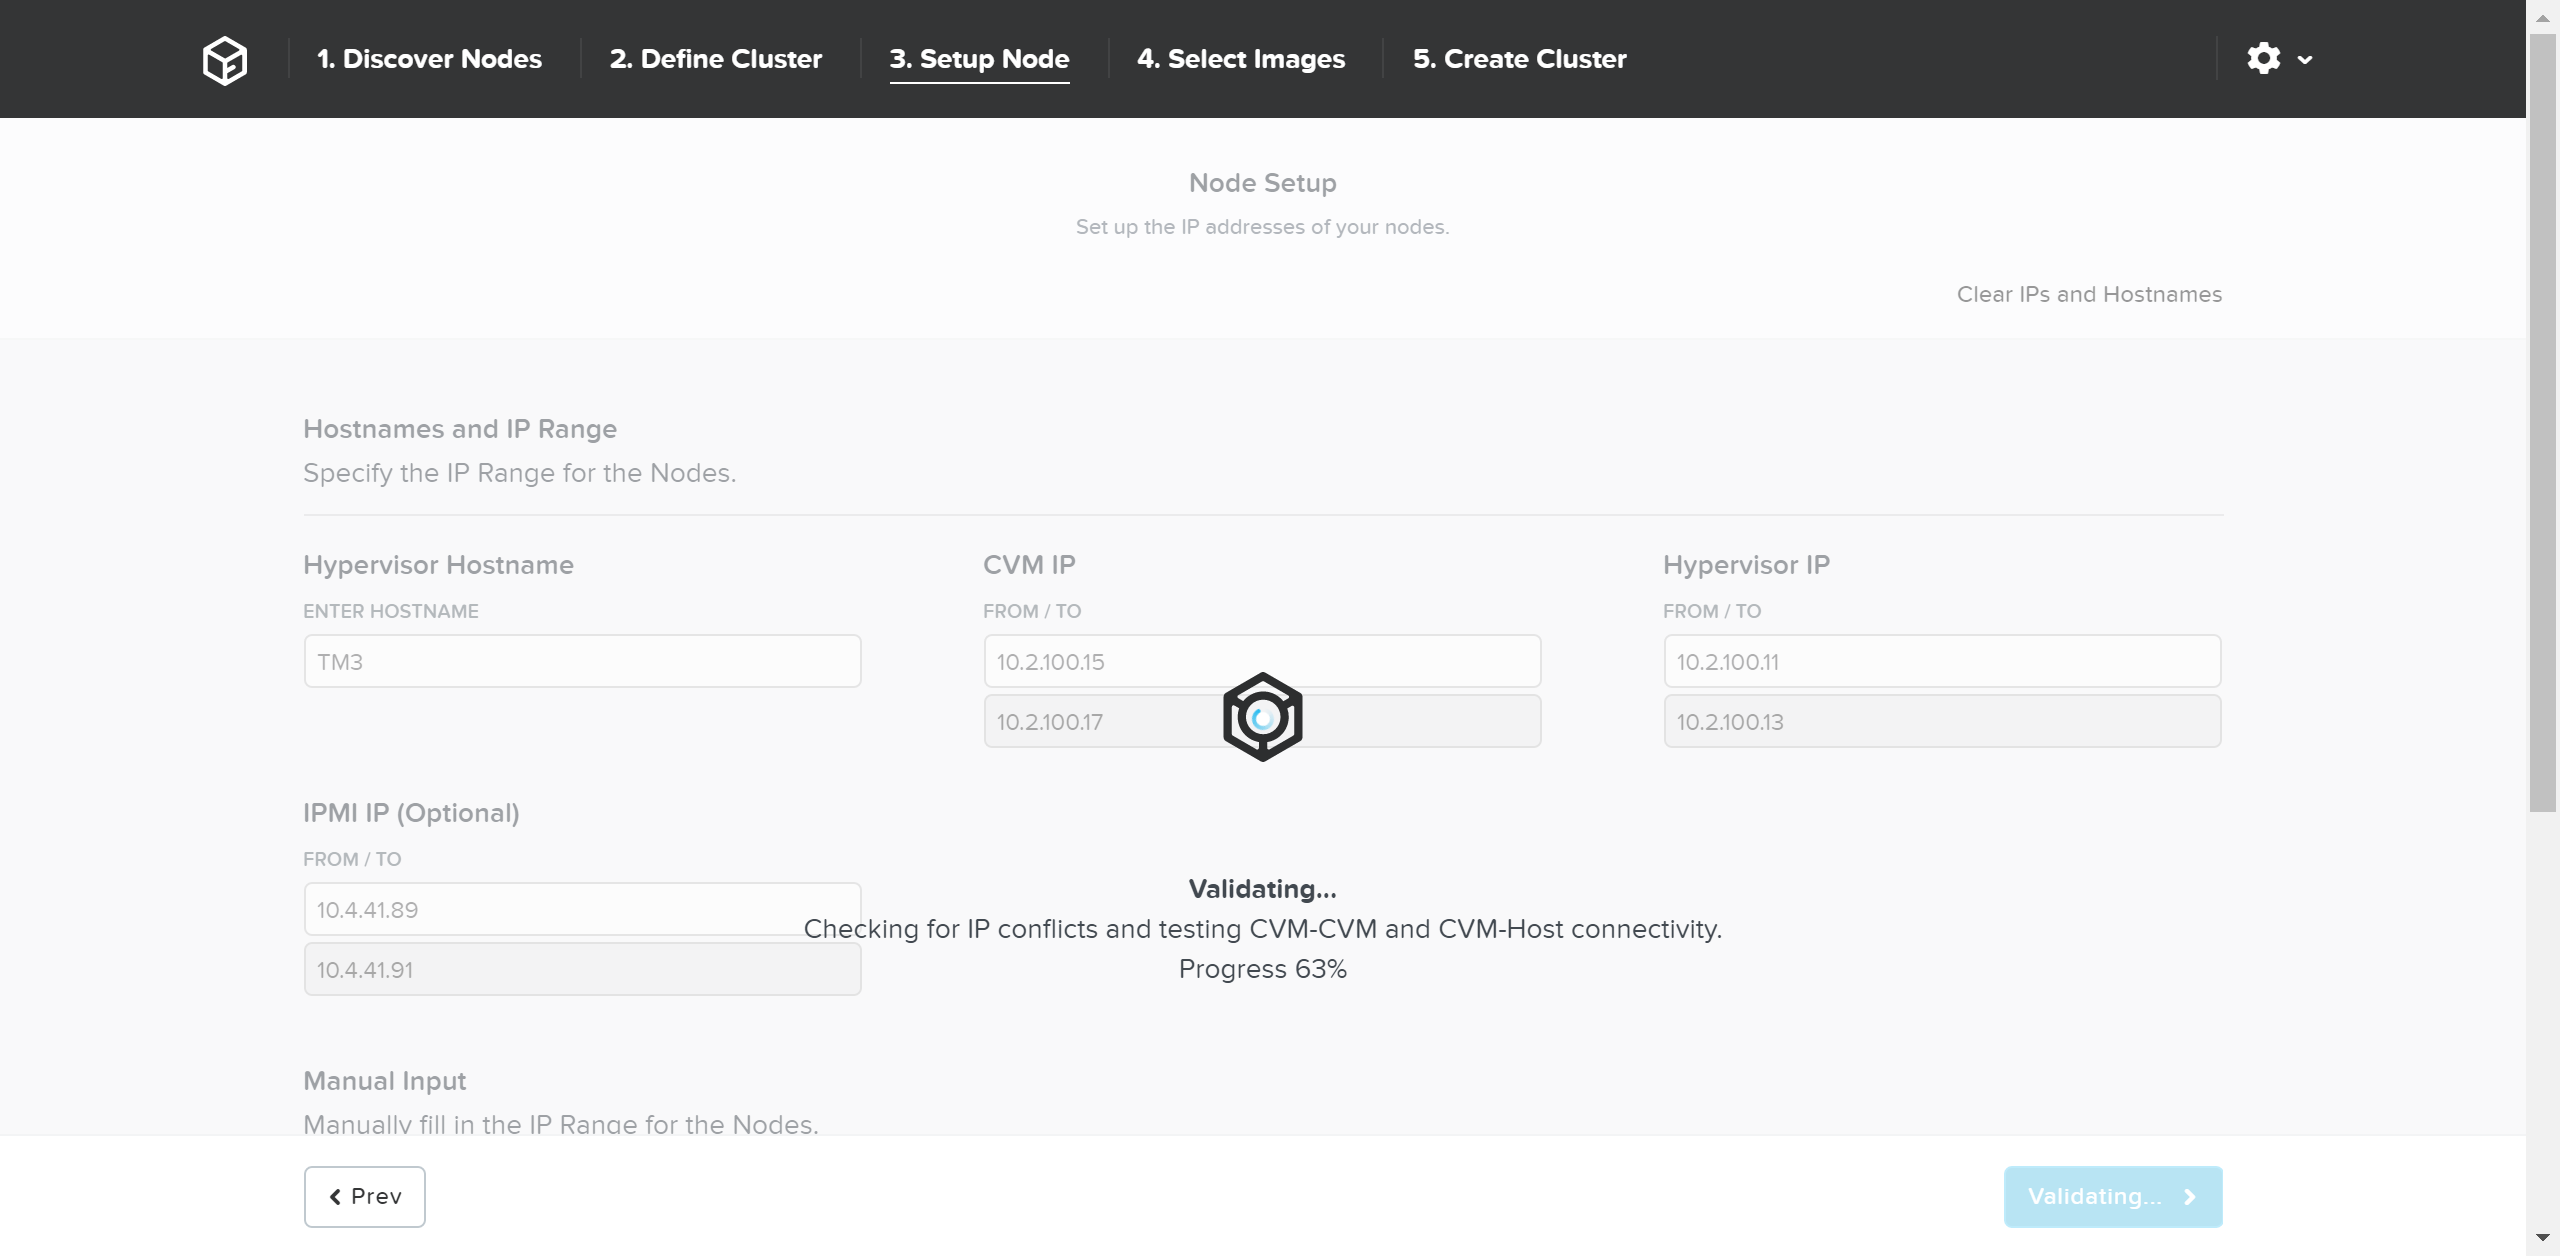 Foundation - Network Validation
Once network validation has completed successfully we’ll now proceed to selecting the desired images.
To upgrade AOS to a newer version than currently on the CVM, download it from the portal and upload the Tarball. Once we have the desired AOS image, we’ll select the hypervisor.
For AHV, the image is built-in to the AOS image. For others you must upload the desired hypervisor image. NOTE: make sure the AOS and hypervisor versions are on the compatibility matrix (LINK).
Once we have the desired images, click ‘Create’:
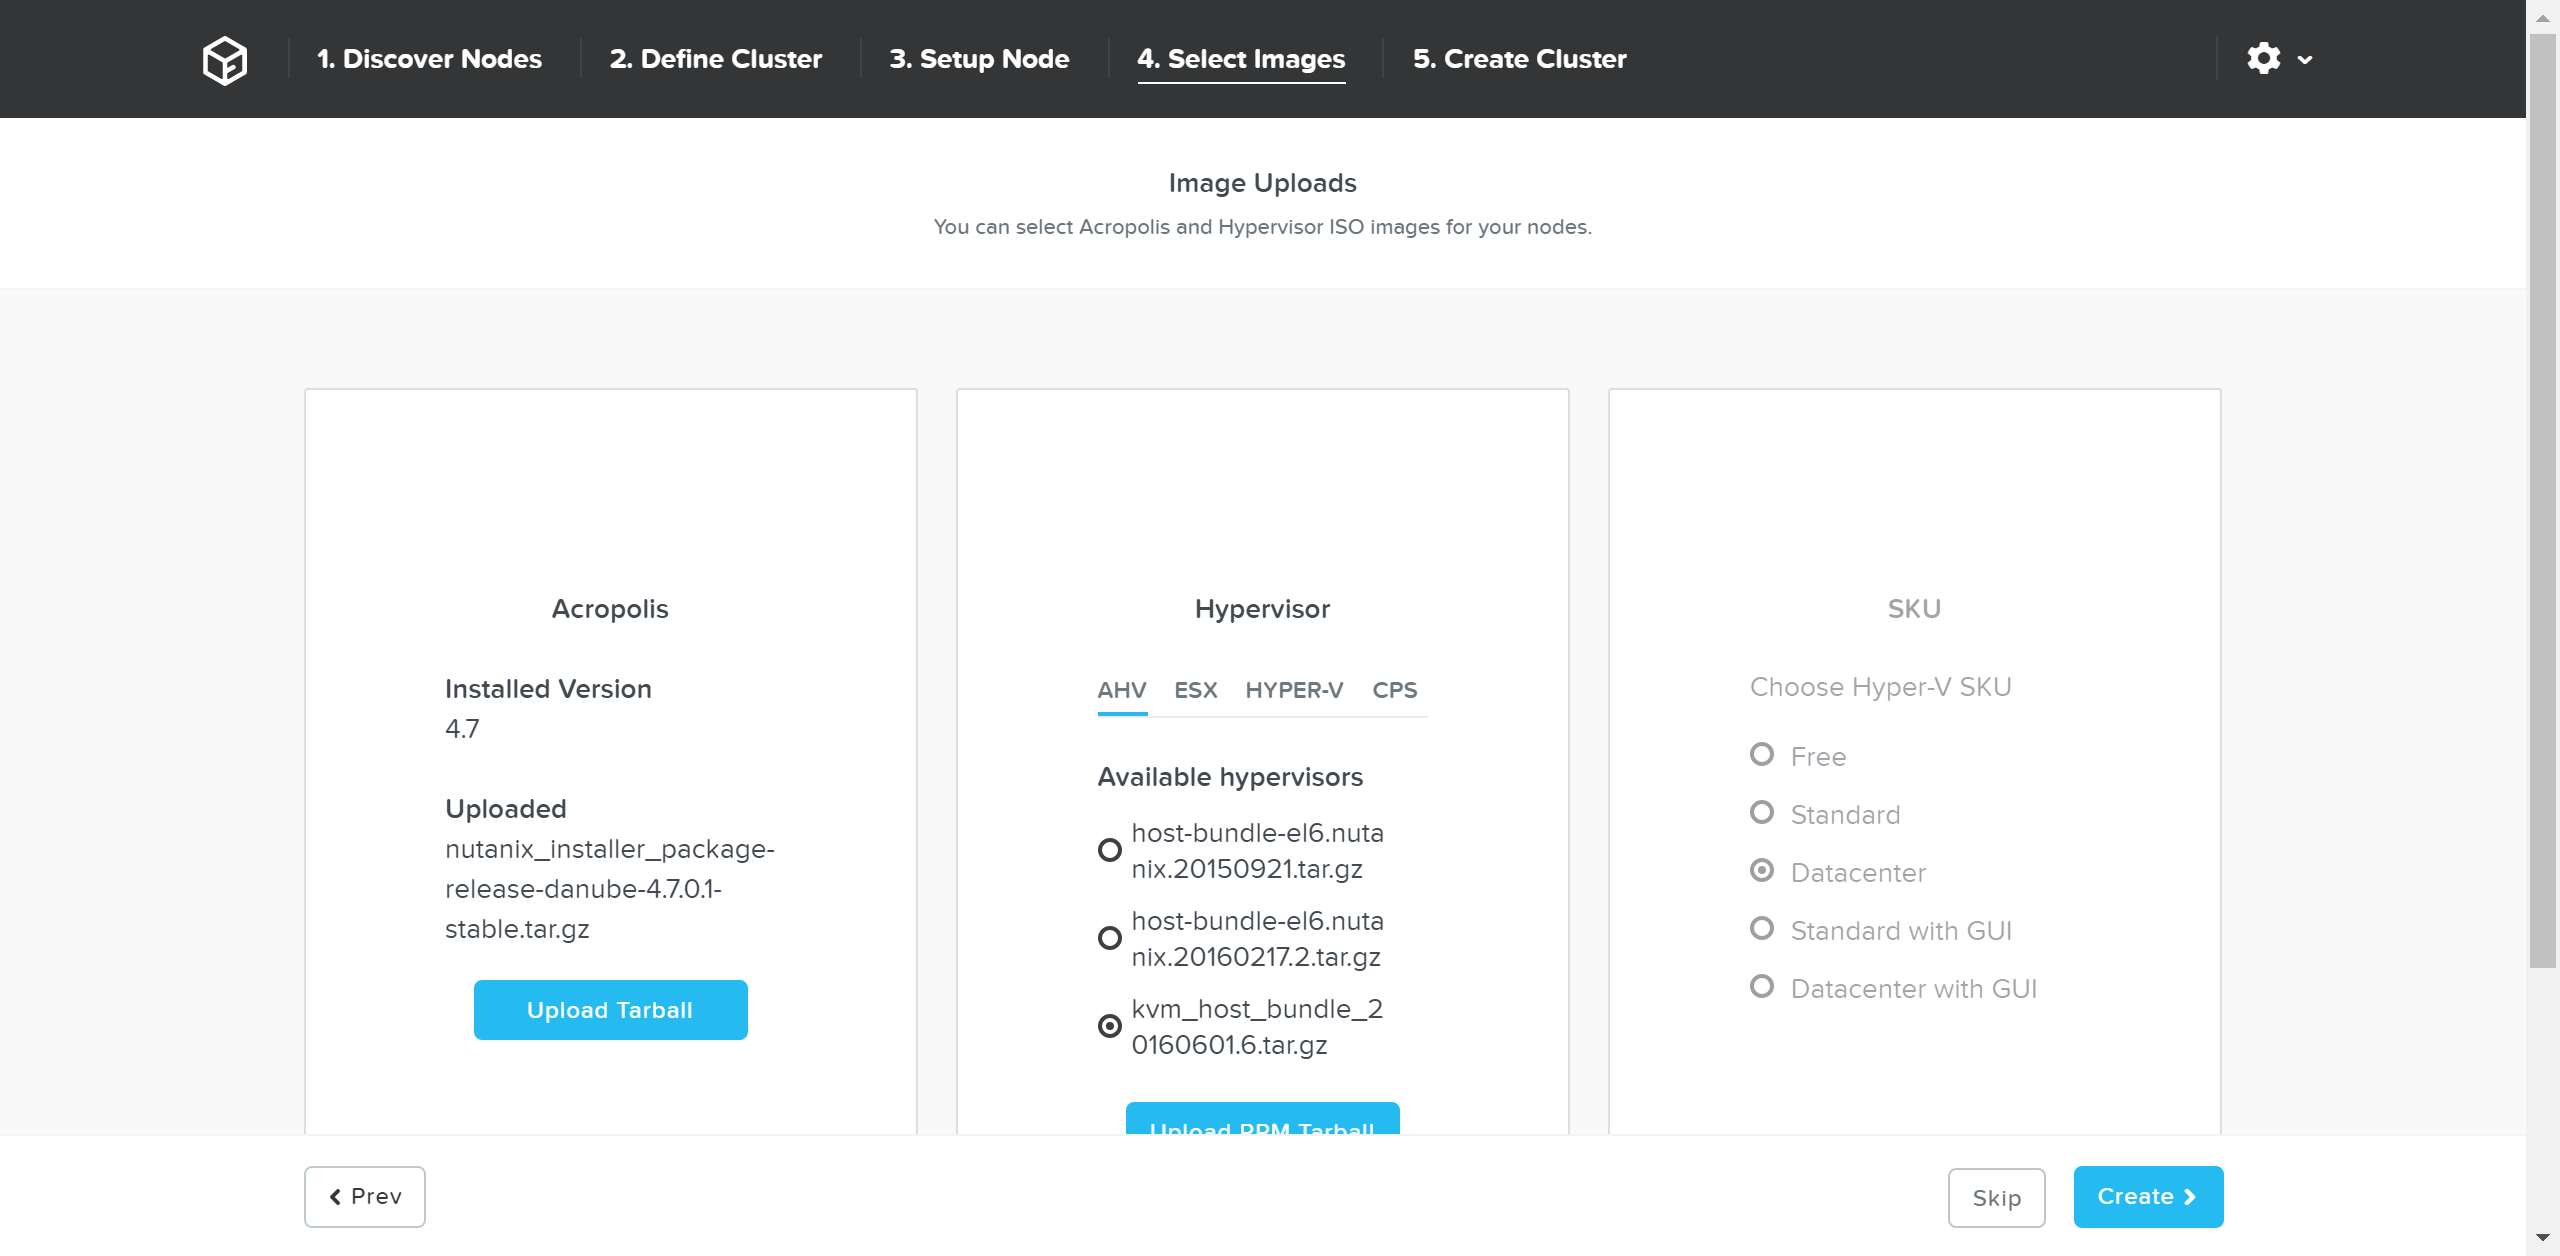 Foundation - Select Images
If imaging is not necessary you can also click ‘Skip’ to skip the imaging process. This will not re-image the hypervisor or Nutanix cluster, but just configure the cluster (e.g. IP addresses, etc.).
Foundation will then proceed with the imaging (if necessary) and cluster creation process.
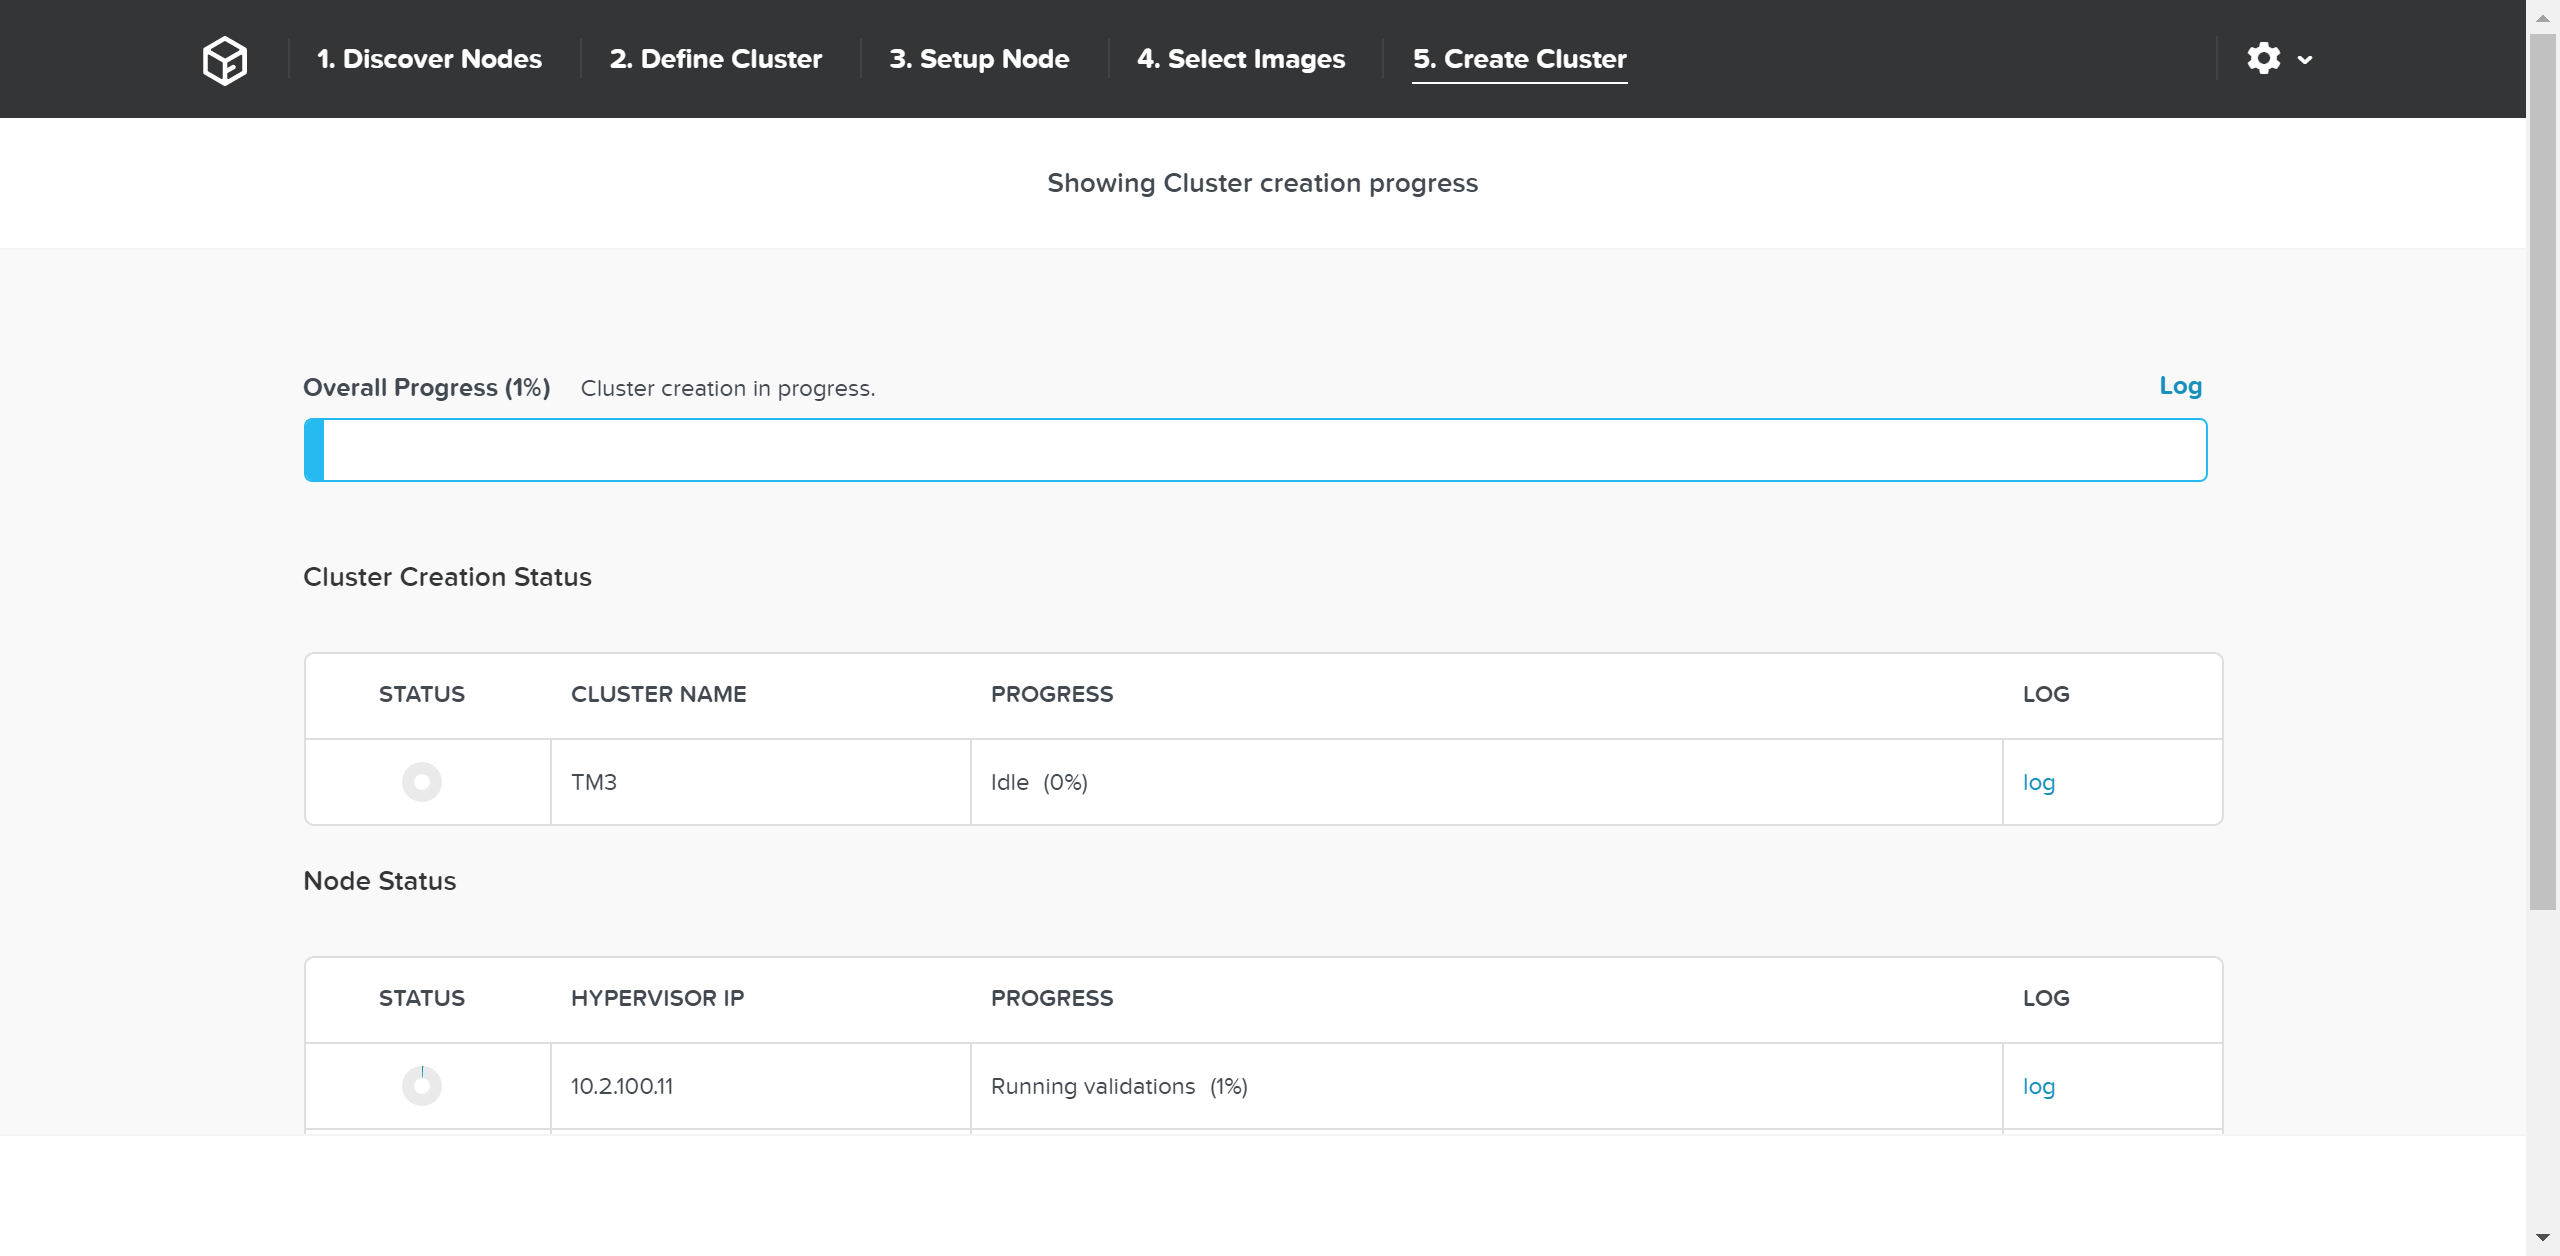 Foundation - Cluster Creation Process
Once the creation is successful you’ll get a completion screen:
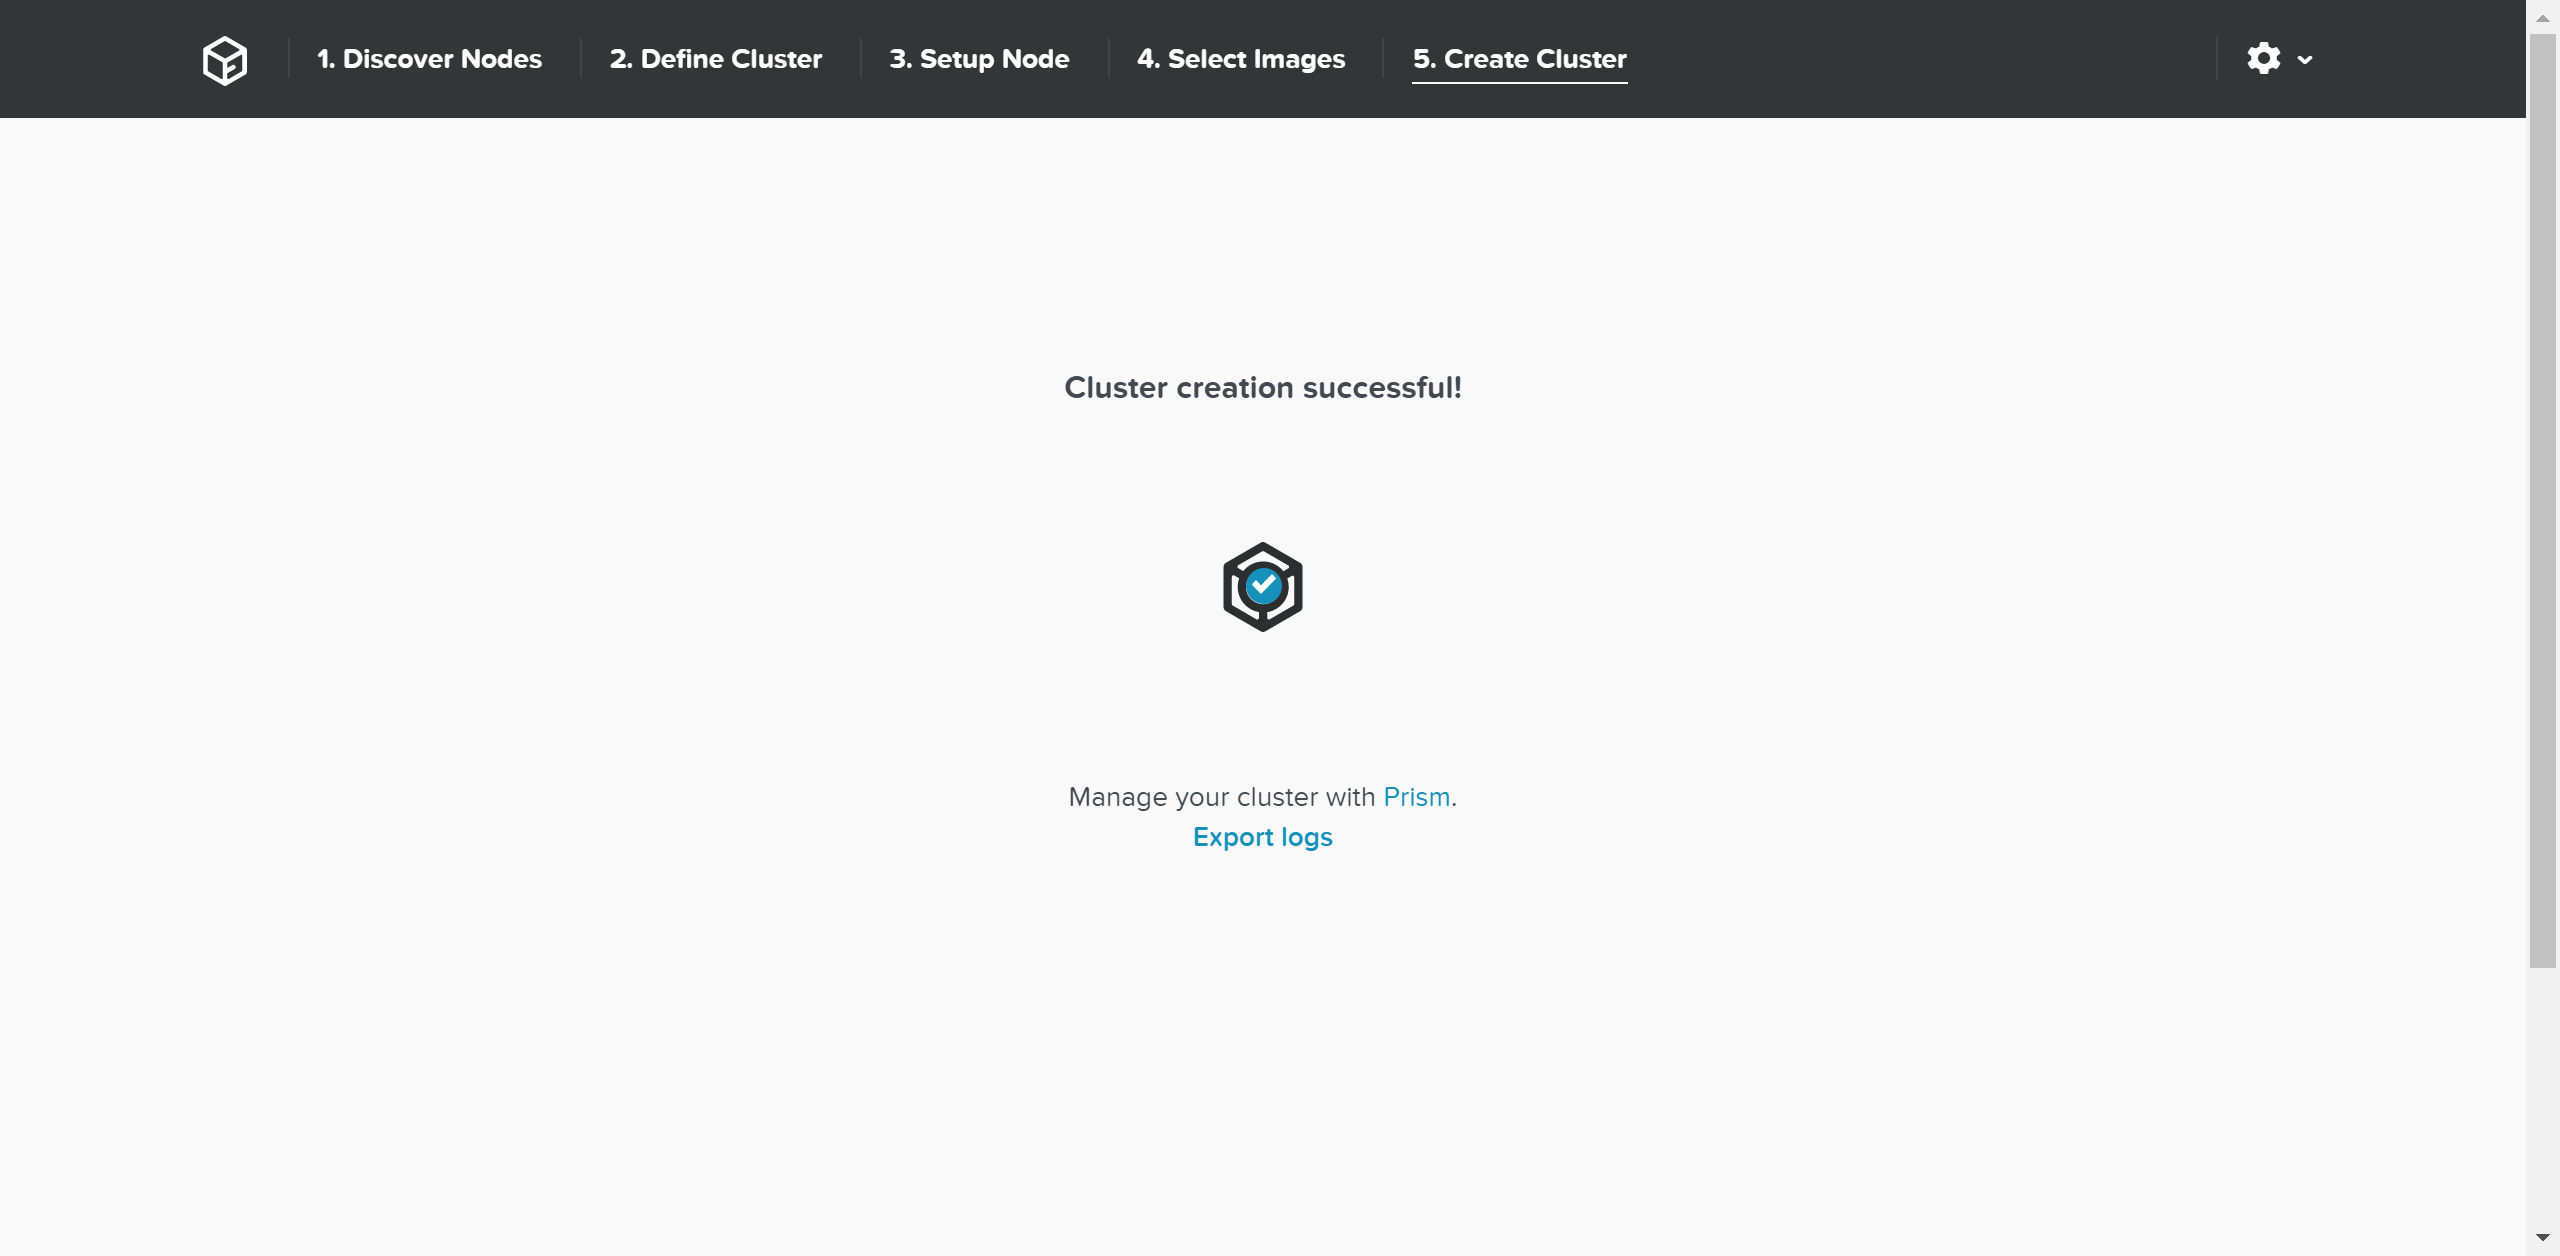 Foundation - Cluster Creation Complete
At this point you can now log into any CVM or the Cluster IP and start using the Nutanix platform!
» Download this section as PDF (opens in a new tab/window)
In this section, I’ll cover how the various storage devices (Performance (NVMe/SSD) / Capacity (SSD/HDD) are broken down, partitioned, and utilized by the Nutanix platform. NOTE: All of the capacities used are in Base2 Gibibyte (GiB) instead of the Base10 Gigabyte (GB). Formatting of the drives with a filesystem and associated overheads has also been taken into account.
Performance Disk Devices
Performance devices are the highest performance device in a node. These can be NVMe or a mix of NVMe and SSD devices. They store a few key items, as explained below
- Nutanix Home (CVM core)
- Metadata (Cassandra / AES storage)
- OpLog (persistent write buffer)
- Extent Store (persistent storage)
The following figure shows an example of the storage breakdown for a Nutanix node’s performance device:
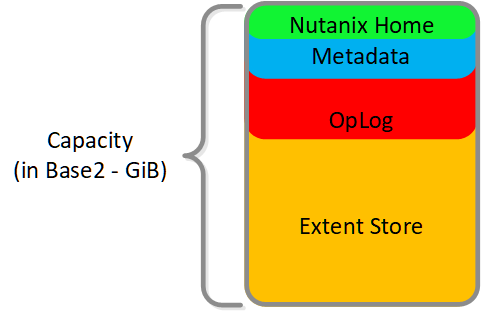 Performance Drive Breakdown
Graphics and proportions aren’t drawn to scale. When evaluating the Remaining GiB capacities, do so from the top down. For example, the Remaining GiB to be used for the OpLog calculation would be after Nutanix Home and Cassandra have been subtracted from the formatted SSD capacity.
Nutanix Home is mirrored across the first two SSDs to ensure availability and has a 60GiB reservation for two devices.
As of 5.0 Cassandra is sharded across multiple SSDs in the node (currently up to 4) with an initial reservation of 15GiB per SSD (can leverage some Stargate SSD if metadata usage increases). In dual SSD systems, metadata will be mirrored between the SSDs. The metadata reservation per SSD is 15 GiB (30GiB for dual SSD, 60GiB for 4+ SSD).
Prior to 5.0, Cassandra was on the first SSD by default, if that SSD fails the CVM will be restarted and Cassandra storage will then be on the 2nd. In this case the metadata reservation per SSD is 30 GiB for the first two devices.
The OpLog is distributed among all SSD devices up to a max of 12 per node (Gflag: max_ssds_for_oplog). If NVMe devices are available, OpLog will be placed on those devices instead of SATA SSD.
The OpLog reservation per disk can be calculated using the following formula: MIN(((Max cluster RF/2)400 GiB)/ numDevForOplog), ((Max cluster RF/2)25%) x Remaining GiB). NOTE: The sizing for OpLog is done dynamically as of release 4.0.1 which will allow the extent store portion to grow dynamically. The values used are assuming a completely utilized OpLog.
For example, in a RF2 (FT1) cluster with 8 SSD devices that are 1TB the result would be:
- MIN(((2/2)400 GiB)/ 8), ((2/2)25%) x ~900GiB) == MIN(50, 225) == 50 GiB reserved for Oplog per device.
For a RF3 (FT2) cluster this would be:
- MIN(((3/2)400 GiB)/ 8), ((3/2)25%) x ~900GiB) == MIN(75, 337) == 75 GiB reserved for Oplog per device.
For a RF2 (FT1) cluster with 4 NVMe and 8 SSD devices that are 1TB the result would be:
- MIN(((2/2)400 GiB)/ 4), ((2/2)25%) x ~900GiB) == MIN(100, 225) == 100 GiB reserved for Oplog per device.
The Extent Store capacity would be the remaining capacity after all other reservations are accounted for.
HDD Devices
Since HDD devices are primarily used for bulk storage, their breakdown is much simpler:
- Curator Reservation (Curator storage)
- Extent Store (persistent storage)
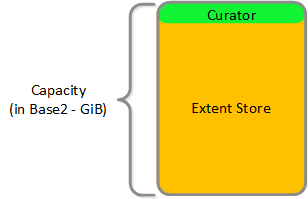 HDD Drive Breakdown
Compute
AHVLearn about the native Nutanix hypervisor, including the architecture, I/O path, and administration.
» Download this section as PDF (opens in a new tab/window)
Node Architecture
In AHV deployments, the Controller VM (CVM) runs as a VM and disks are presented using PCI passthrough. This allows the full PCI controller (and attached devices) to be passed through directly to the CVM and bypass the hypervisor. AHV is based upon Linux, QEMU, and KVM. Full hardware virtualization is used for guest VMs (HVM).
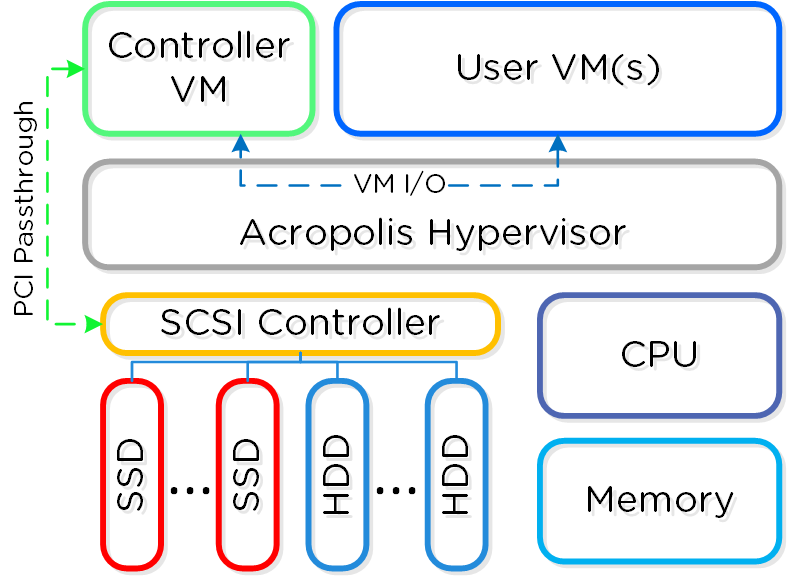 AHV Node
KVM Architecture
Within KVM there are a few main components:
- KVM-kmod
- KVM kernel module
- Libvirtd
- An API, daemon and management tool for managing KVM and QEMU. Communication between AOS and KVM / QEMU occurs through libvirtd.
- Qemu-kvm
- A machine emulator and virtualizer that runs in userspace for every Virtual Machine (domain). In AHV it is used for hardware-assisted virtualization and VMs run as HVMs.
The following figure shows the relationship between the various components:
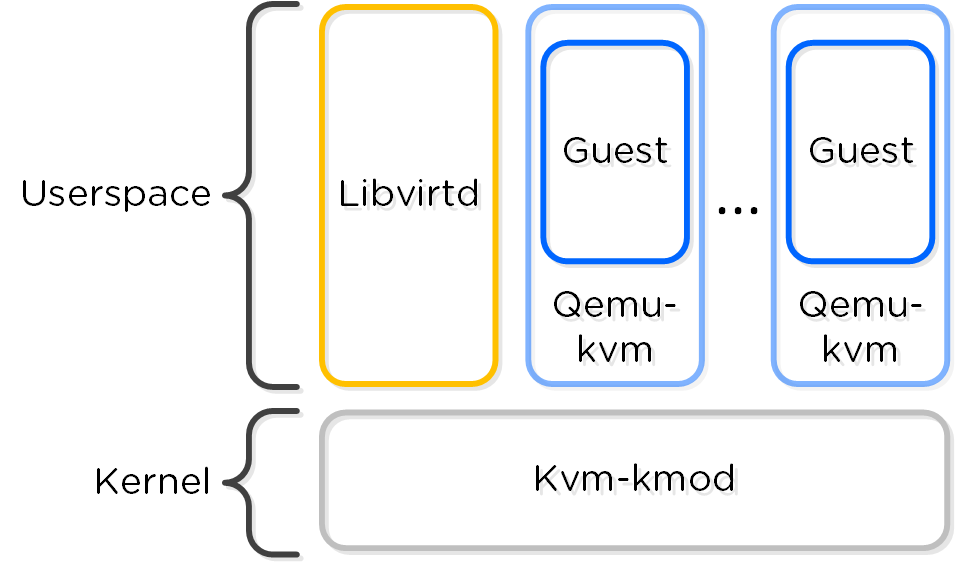 KVM Component Relationship
Communication between AOS and KVM occurs via Libvirt.
Note
Processor generation compatibility
Similar to VMware's Enhanced vMotion Capability (EVC) which allows VMs to move between different processor generations; AHV will determine the lowest processor generation in the cluster and constrain all QEMU domains to that level. This allows mixing of processor generations within an AHV cluster and ensures the ability to live migrate between hosts.
Configuration Maximums and Scalability
The following configuration maximums and scalability limits are applicable:
- Maximum cluster size: 32
- Maximum vCPUs per VM: Check Configuration Maximums page for relevant AHV version
- Maximum memory per VM: 4.5TB or available physical node memory
- Maximum virtual disk size: 64TB
- Maximum VMs per host: Check Configuration Maximums page for relevant AHV version
- Maximum VMs per cluster: Check Configuration Maximums page for relevant AHV version
*The 64TB max vdisk size is the size that has been internally tested by Nutanix Engineering.
The above are true as of AHV 20230302.100173 and AOS 6.8. Refer to Configuration Maximums for other versions.
Compute
The following sections outline key capabilities of Nutanix AHV compute for workload management.
VM Templates
AHV has always had the image library which focused on capturing the data within a single vDisk so that it could be easily cloned, but input from the admin was needed to complete the process of declaring the CPU, memory and network details. VM Templates take this concept to the next level of simplicity and provides a familiar construct for admins that have utilized templates on other hypervisors.
AHV VM Templates are created from existing virtual machines, inheriting the attributes of the defining VM such as the CPU, memory, vdisks, and networking details. The template can then be configured to customize the guest OS upon deployment and can optionally provide a Windows license key. Templates allow for multiple versions to be maintained, allowing for easy updates such as operating system and application patches to be applied without the need to create a new template. Admins can choose which version of the template is active, allowing the updates to be staged ahead of time or the ability to switch back to a previous version if needed.
Memory Overcommit
One of the central benefits of virtualization is the ability to overcommit compute resources, making it possible to provision more CPUs to VMs than are physically present on the server host. Most workloads don’t need all of their assigned CPUs 100% of the time, and the hypervisor can dynamically allocate CPU cycles to workloads that need them at each point in time.
Much like CPU or network resources, memory can be overcommitted also. At any given time, the VMs on the host may or may not use all their allocated memory, and the hypervisor can share that unused memory with other workloads. Memory overcommit makes it possible for administrators to provision a greater number of VMs per host, by combining the unused memory and allocating it to VMs that need it.
AOS 6.1 brings memory overcommit to AHV as an option to allow administrators flexibility in environments such as test and development where additional memory and VM density are required. Overcommit is disabled by default and can be defined on a per-VM basis allowing sharing to be done on all or just a subset of the VMs on a cluster.
VM Affinity Policies
Different types of applications can have requirements that dictate whether the VMs should run on the same host or a different host. This is typically done for performance or availability benefits. Affinity controls enable you to govern where VMs run. AHV has two types of affinity controls:
- VM-host affinity
- Strictly ties a VM to a host or group of hosts, so the VM only runs on that host or group. Affinity is particularly applicable for use cases that involve software licensing or VM appliances. In such cases, you often need to limit the number of hosts an application can run on or bind a VM appliance to a single host.
- Anti-affinity
- AHV lets you declare that a given list of VMs shouldn’t run on the same hosts. Anti-affinity gives you a mechanism for allowing clustered VMs or VMs running a distributed application to run on different hosts, increasing the application’s availability and resiliency. To prefer VM availability over VM separation, the system overrides this type of rule when a cluster becomes constrained.
Virtual Trusted Platform Module (vTPM)
TPM technologies are designed to provide enhanced security and privacy in handling encryption operations. The purpose of the TPM is to ensure information storage is better protected from unauthorized access. The primary use case is storing secrets, making it difficult to access them without proper authorization.
The Trusted Computing Group outlines the TPM as a dedicated hardware chip that is soldered onto the motherboard in the computer, which works great in a bare metal deployment. In a virtualized environment using a hypervisor such as AHV or ESXi, the physical TPM chip approach does not scale to support multiple guest OS running on a single hardware configuration due to the following limitations.
- Key Storage – The storage available in a physical TPM chip can hold roughly three transient keys.
- TPM Isolation – The TPM chip does not provide any separation or isolation between multiple guest OS running on the same physical device.
To address the scaling issues for a virtualized environment, the hypervisor vendors have implemented a hypervisor-level software called virtual TPM (vTPM), which conforms to the Trusted Computing Group’s TPM specification. vTPM emulates these TPM specifications in the same functional manner as a physical TPM chip creating a private TPM instance per VM guest within the hypervisor. vTPM allows each VM guest to have its own key storage, isolating it from the other guests running on the same physical server. To maintain this isolation, the vTPM does not use the hardware physical TPM chip on the server.
Each hypervisor vendor is responsible for protecting the vTPM instance from outside access. Nutanix AHV, for example, ensures isolation between VMs and encrypts vTPM data using a secure distributed secrets service called Mantle, preventing unauthorized access or tampering.
Live Migrations
Live migration allows the system to move VMs from one host to another while the VM is turned on without workload interruption, regardless of whether the administrator or an automatic process initiates the movement. Live migrations occur regularly in the cluster nodes, triggered by maintenance operations, ADS workload balancing, node expansion, or administrator-driven requests.
You can also use live migration to migrate VMs to another physical cluster in the same location or in a different location to rebalance workloads, run maintenance operations, or avoid planned interruptions. For cross-cluster live migrations, we recommend a network with 5ms of latency and support a maximum 40ms latency between clusters.
There are several stages to a VM live migration:
- Create a VM placeholder on the destination host
- Iteratively copy the source VMs memory to the destination VM placeholder
- Pause the VM on the source host
- Copy the final VM state from the source VM to the destination VM placeholder
- Update the network switches to ensure continued connectivity
- Resume the VM on the destination host
- Delete the paused VM from the source
Step 2, the copying of the VM’s memory, can occur over and up to a specific number of iterations (50 at the time of writing). As the VM is still running, AHV will keep track of the VM’s memory which is actively being modified during the copy process in each iteration. Once an iteration is complete, AHV will analyze the amount of memory that has changed and still needs to be copied over to the destination, as well as the achieved rate of memory transfer over the network, to determine if another iteration is required or if the migration can proceed to the next step. The rate at which a VM is modifying memory is more important to a successful migration than the amount of memory in a VM, so AHV will proactively manage the speed of the VM to reduce the amount of memory needing to be sent in the next iteration.
Step 3, pausing of the VM on the source host, will only occur when AHV detects it can transfer the remaining memory in 300ms or less, ensuring that the VM will respond on the destination host after a very short period. This is the maximum stun window. If the remaining memory cannot be transferred within this window after the final iteration, then the migration can abort with a ‘failure to converge’ error. The migration may be automatically re-tried by ADS, host evacuation, or by the administrator manually triggering another migration.
Step 5, updating the network switches, is enacted by sending a RARP broadcast network packet to all devices on the subnet while the VM is being brought up. This ensures that external network switches are aware of where the VM is now running and can route packets appropriately, for example ensuring that TCP connections are not lost during the migration.
Generation ID
There are a range of applications that use the Generation ID to access a virtual machine identifier to validate if the VM was cloned or duplicated for licensing or functionality verification. Starting in AOS release 6.7, AHV creates a Generation ID for each VM that is created, which applications running inside of that VM have access to. Applications can then make decisions on how they want to behave based on whether the correct Generation ID is present. One notable example where this is important is in the case of Windows domain controllers, which can experience problems if accidentally cloned or rolled back without proper safeguards. Generation ID is a mechanism that provides this information to a VM, allowing these restrictions to be tested and enforced by the app.
Advanced Processor Compatibility
Advanced Processor Compatibility (APC) streamlines upgrades and helps the transition of clusters to the latest generation CPUs. Clusters are no longer limited by the lowest common denominator CPU. VMs can now accurately identify and utilize the CPU features available to them, improving migrations.
APC offers flexibility in a few different ways. First, clusters can be leveled for consistent CPU presentation to guest VMs, which is the default behavior. Also a baseline CPU model can be set on a per-VM basis for on-demand cross-cluster live migration to different generations of hardware.
Automatic Cluster Selection
Automatic Cluster Selection makes it easy for Nutanix administrators to deliver a cloud-like experience with minimum management overhead. Many organizations have general-purpose environments with multiple clusters managed by a single Prism Central instance, but the utilization of the different clusters previously had to be manually managed by an administrator.
Automatic Cluster Selection intelligently determines the optimal cluster for VM deployment based on resource availability, host affinities, project specifications, and image distribution policies when a VM is created. This capability ensures that resources are automatically balanced across the clusters as new VMs are deployed. Automatic Cluster Selection also saves valuable time helps evenly distribute workloads for maximum performance and utilization across the infrastructure.
Acropolis Dynamic Scheduler (ADS)
ADS, the Acropolis Dynamic Scheduler, is a key component in the AHV stack. ADS is responsible for VM migrations and placements during many operations including resolving host hotspots (hosts with high CPU and storage usage), maintaining High Availability guarantees, optimizing VM placement to free up resources, and enforcing administrator-defined policies. ADS is always running in the background, continuously monitoring and optimizing the infrastructure.
Key features of ADS include:
- Initial VM placement - Choosing the AHV host for a VM and defragmenting the cluster if needed to ensure sufficient resources are available for the new VM
- Dynamic hotspot mitigation - Monitoring each host and, when a hotspot is detected, resolving that hotspot
- Background policy enforcement - for example moving VMs around to respect VM:Host affinity policies and VM:VM anti-affinity policies
- Enforcing High Availability guarantees - When HA guarantees are enabled, ADS will move VMs in the running system to ensure all VMs on each host can be recovered following the failure of an individual host.
- Dynamic GPU management - Supports NVIDIA GPUs to provide specific vGPU profiles based on the VMs running in the system
- Creating remediation plans based on the cost of movement to address each of the above cases
As ADS focuses on hotspot mitigation and has cost-minimizing remediation plans, this results in fewer VM movements than would be required for an active load-balancing scenario.
Hotspot Mitigation Example - Simple Plan
Figure 1 in the following example shows a host utilizing 90% of available CPU capacity. The CPU hotspot threshold is 85%, so ADS identifies that VM movements are required.
In Figure 2, ADS computes a plan that will move one of the 8GB VMs from the third host to the second host, making sufficient space for one of the VMs on the first host to move over.
The amount of memory on each of the VMs on the first host is taken into account when deciding which VM can be moved more easily. The final state in Figure 3 shows the smaller of the two VMs on the first host moving over to the third host as that is the lowest cost move.
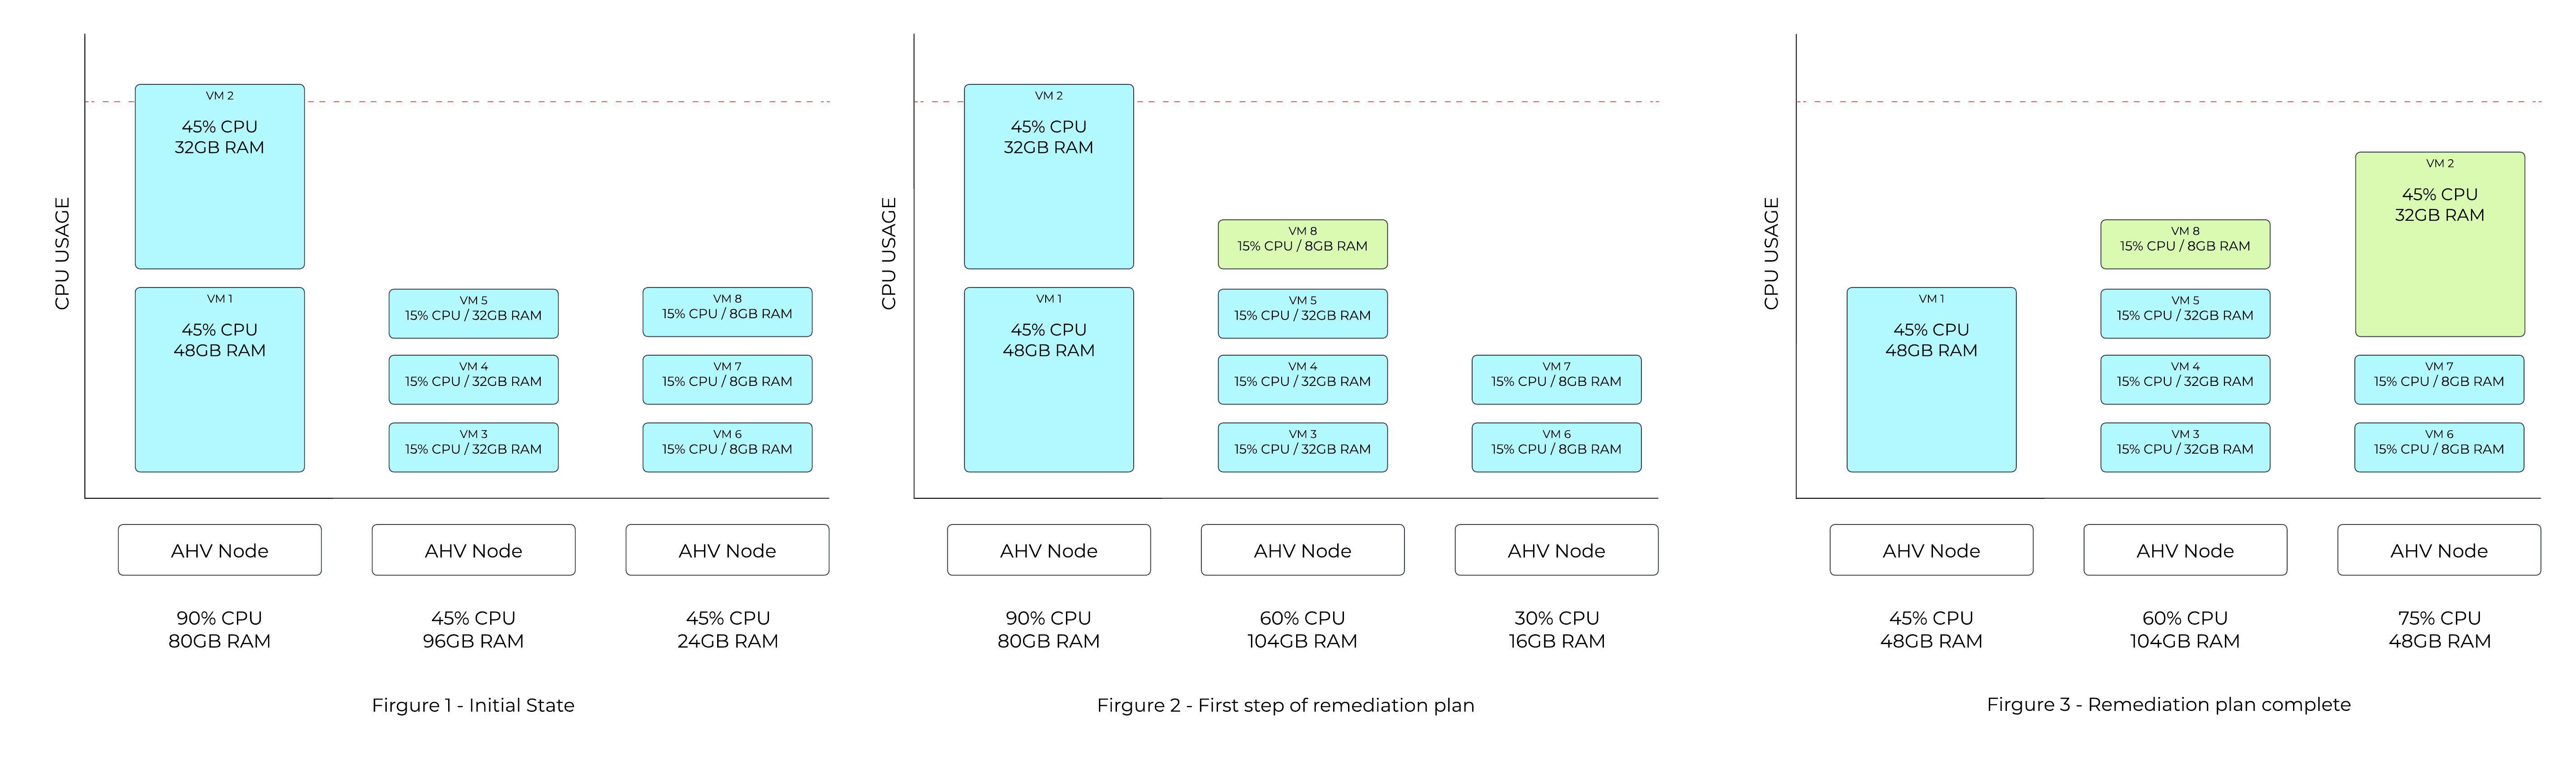 ADS Mitigation Example
ADS plans are usually more complex than this, as multiple dimensions are considered both for hotspot detection and for cost-minimization of the remediation plans.
Networking
AHV leverages Open vSwitch (OVS) for all VM networking. VM networking is configured through Prism / ACLI and each VM nic is connected into a tap interface.
The following figure shows a conceptual diagram of the OVS architecture:
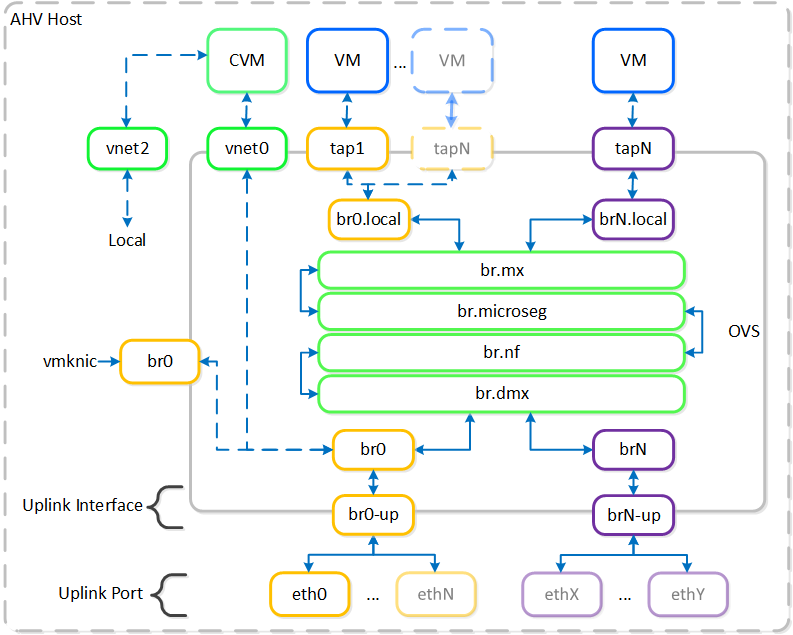 Open vSwitch Network Overview
In the prior image you see a few types of components:
Open vSwitch (OVS)
OVS is an open source software switch implemented in the Linux kernel and designed to work in a multiserver virtualization environment. By default, OVS behaves like a layer-2 learning switch that maintains a MAC address table. The hypervisor host and VMs connect to virtual ports on the switch.
OVS supports many popular switch features, including VLAN tagging, Link Aggregation Control Protocol (LACP), port mirroring, and quality of service (QoS), to name a few. Each AHV server maintains an OVS instance, and all OVS instances combine to form a single logical switch. Constructs called bridges manage the switch instances residing on the AHV hosts.
Bridge
Bridges act as virtual switches to manage network traffic between physical and virtual network interfaces. The default AHV configuration includes an OVS bridge called br0 and a native Linux bridge called virbr0. The virbr0 Linux bridge carries management and storage communication between the CVM and AHV host. All other storage, host, and VM network traffic flows through the br0 OVS bridge. The AHV host, VMs, and physical interfaces use “ports” for connectivity to the bridge.
Port
Ports are logical constructs created in a bridge that represent connectivity to the virtual switch. Nutanix uses several port types, including internal, tap, VXLAN, and bond:
- An internal port—with the same name as the default bridge (br0)—provides access for the AHV host.
- Tap ports act as bridge connections for virtual NICs presented to VMs.
- VXLAN ports are used for the IP address management functionality provided by Acropolis.
- Bonded ports provide NIC teaming for the physical interfaces of the AHV host.
Bond
Bonded ports aggregate the physical interfaces on the AHV host. By default, a bond named br0-up is created in bridge br0. After the node imaging process, all interfaces are placed within a single bond, which is a requirement for the foundation imaging process. Changes to the default bond, br0-up, often rename this to bond0. Nutanix recommends using the name br0-up to quickly identify the interface as the bridge br0 uplink.
OVS bonds allow for several load-balancing modes, including active-backup, balance-slb and balance-tcp. LACP can also be activated for a bond. The “bond_mode” setting is not specified during installation and therefore defaults to active-backup, which is the recommended configuration.
Uplink Load Balancing
Briefly mentioned in the prior section, it is possible to balance traffic across bond uplinks.
The following bond modes are available:
- active-backup
- Default configuration which transmits all traffic over a single active adapter. If the active adapter becomes unavailable, another adapter in the bond will become active. Limits throughput to a single nic’s bandwidth. (Recommended)
- balance-slb
- Balances each VM’s nic across adapters in the bond (e.g. VM A nic 1 - eth0 / nic 2 - eth1). Limits VM per-nic throughput to a single nic’s bandwidth, however a VM with x nics can leverage x * adapter bandwidth (assuming x is the same for the number of VM nics and physical uplink adapters in the bond). NOTE: has caveats for multicast traffic
- balance-tcp / LACP
- Balances each VM nic’s TCP session across adapters in the bond. Limits per-nic throughput to the maximum bond bandwidth (number of physical uplink adapters * speed). Requires link aggregation and used when LACP is required.
You can find additional information on bonds in the AHV networking guide.
VM NIC Types
AHV supports the following VM network interface types:
- Access (default)
- Trunk (4.6 and above)
By default VM nics will be created as Access interfaces (similar to what you’d see with a VM nic on a port group), however it is possible to expose a trunked interface up to the VM’s OS. Trunked NICs send the primary VLAN untagged, and all additional VLANs as tags to the same vNIC on the VM. This is useful to bring multiple networks to a VM without adding vNICs.
A trunked interface can be added with the following command:
vm.nic_create VM_NAME vlan_mode=kTrunked trunked_networks=ALLOWED_VLANS network=NATIVE_VLAN
Example:
vm.nic_create fooVM vlan_mode=kTrunked trunked_networks=10,20,30 network=vlan.10
Service Chaining
AHV Service chaining allows us to intercept all traffic and forward to a packet processor (NFV, appliance, virtual appliance, etc.) functions transparently as part of the network path.
Common uses for service chaining:
- Firewall (e.g. Palo Alto, etc.)
- IDS/IPS/network monitors (e.g. packet capture)
Within service chaining there are two types of way:
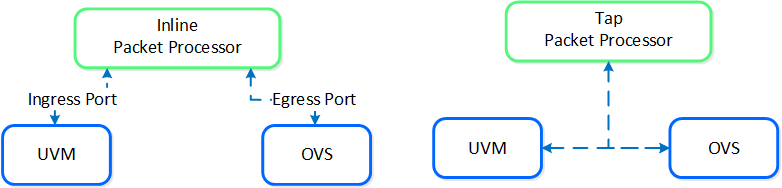 Service chain - Packet Processors
- Inline packet processor
- Intercepts packets inline as they flow through OVS
- Can modify and allow/deny packet
- Common use: firewalls
- Tap packet processor
- Inspects packets as they flow, can only read as it’s a tap into the packet flow
- Common uses: IDS/IPS/network monitor
Any service chaining is done after the Flow - Microsegmentation rules are applied and before the packet leaves the local OVS. This occurs in the network function bridge (br.nf):
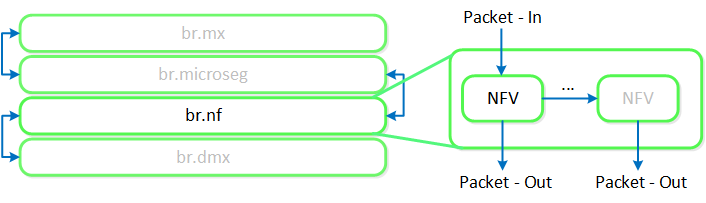 Service Chain - Flow
NOTE: it is possible to string together multiple NFV / packet processors in a single chain. Service chaining is only applicable when Acropolis controls the network stack. Service chaining is not currently supported for network controller-based VLANs or VPCs.
Network Controller
The network controller was released in AOS 6.0 to enable Flow Virtual Networking and VPC overlay subnets. With AOS release 6.7, Nutanix enhanced the network controller, adding support for guest VMs in VLAN-backed subnets. When the network controller is enabled, a new subnet label, VLAN basic is created to describe the existing VLANs managed by the Acropolis leader. Network controller-managed subnets have no label and are simply called VLANs.
Supported Configurations
Core Use Cases:
- AHV networking with additional features in network controller-enabled VLAN subnets
- Flow Virtual Networking VPC overlay subnets
- Microsegmentation for network controller-enabled VLAN-backed subnets
- Microsegmentation within VPC overlay subnets
Management interfaces(s):
- Prism Central (PC)
Supported Environment(s):
- On-Premises:
- AHV
- Nutanix Cloud Clusters (NC2)
- NC2 Azure
Prerequisites for network controller-enabled VLANs:
- Prism Central 2023.3
- AOS 6.7
- AHV 9
- MSP enabled
Upgrades:
- Included in LCM
Note
Pro tip
Deploy Prism Central as extra large for maximum network controller scalability.
Implementation Constructs
The network controller (previously Atlas Network Controller) controls the virtual networking stack used by Flow Virtual Networking VPCs and network controller-enabled VLAN-backed subnets in AHV. The network controller enables configurations at scale and allows for new features such as subnets that exist in multiple Prism Element clusters. This network stack will enable future networking and network security features. With the expanded capabilities, there are a few constructs that are different from what is used in the OVS-based architecture.
The network controller is used to centrally manage and administer VLANs, overlay subnets, IP address pools, and security policies from Prism Central. The network controller runs on Prism Central.
Network Control Plane
The network controller programs the network control plane and determines how packets are processed. This control plane uses Open Virtual Network (https://www.ovn.org/en/architecture/). A new virtual switch named brAtlas is applied to every AHV host.
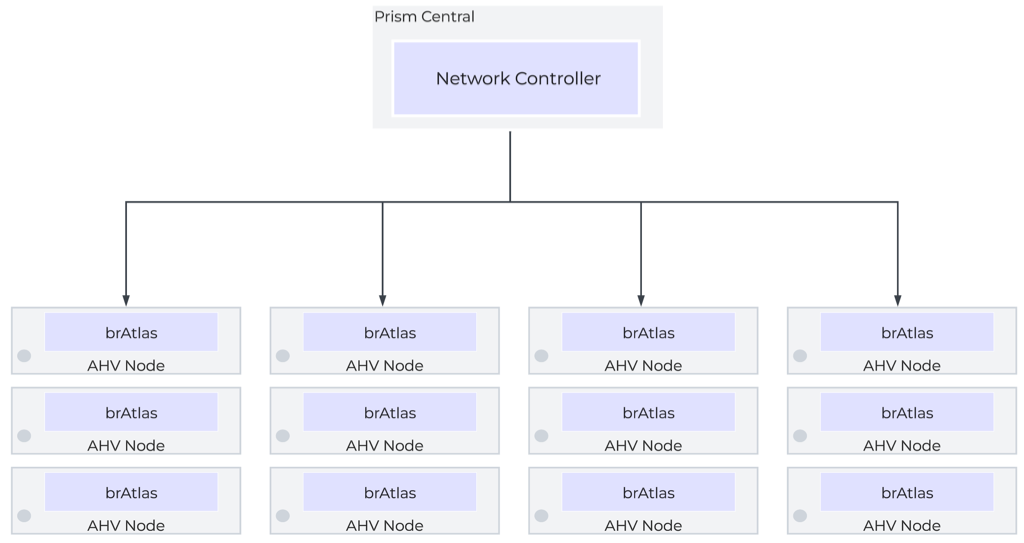 Network Controller Control Plane
Network Bridges
There are 2 bridge types used with the network controller, brAtlas and br0.
brAtlas
The bridge brAtlas is a virtual switch that is applied to every AHV host and managed by the network controller. Guest VMs in VPCs and network controller-backed VLANs connect to brAtlas via a tap interface.
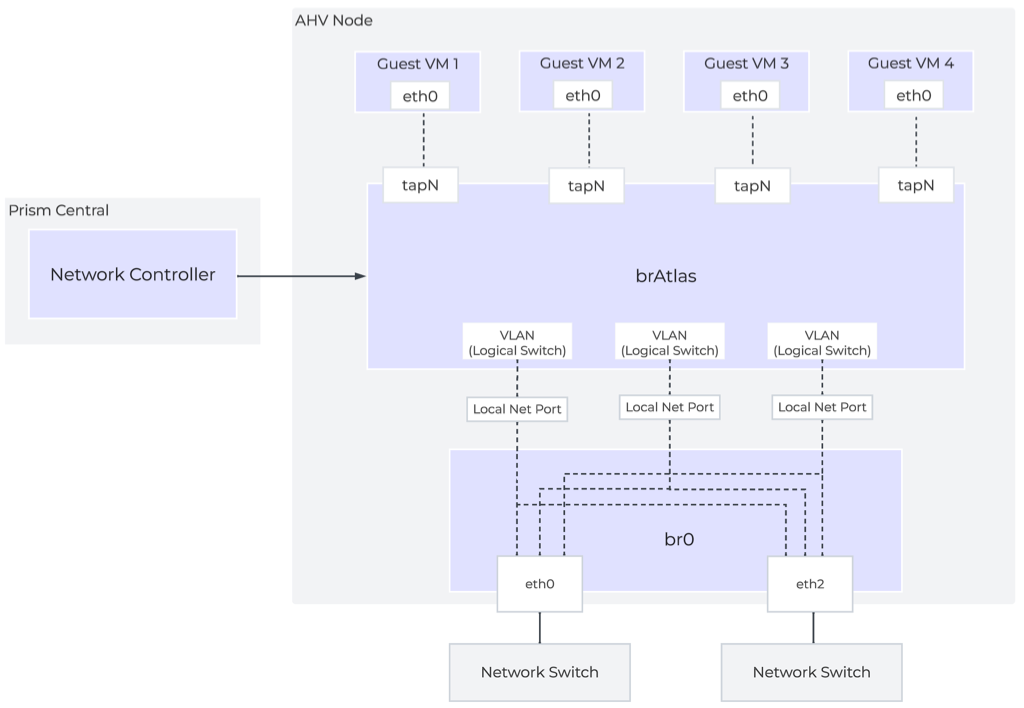 Network Controller Architecture Overview
br0
The bridge br0 is an uplink bridge that functions as a layer 2 switch for brAtlas and connects the physical networks. There can be multiple uplink bridges if required. These additional uplink bridges would follow the same naming construct and be named br0, br1, br2, etc.
VLANs and Logical Switches
For guest VLAN tagging, every VLAN is mapped to a logical switch within brAtlas. Each logical switch will have an associated localnet port connecting to the uplink virtual switch, such as br0. A localnet port is the point of connectivity between logical switches and physical networks.
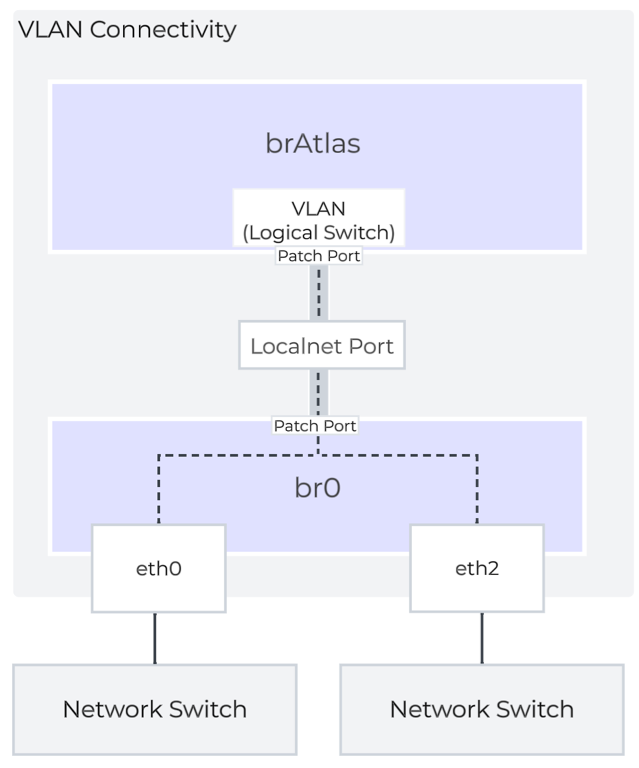
A localnet port is made up of a pair of patch ports between brAtlas and br0. A network controller-enabled VLAN-backed subnet maps to a logical switch in brAtlas.
» Download this section as PDF (opens in a new tab/window)
Storage I/O Path
AHV does not leverage a traditional storage stack like ESXi or Hyper-V. All disk(s) are passed to the VM(s) as raw SCSI block devices. This keeps the I/O path lightweight and optimized.
Note
Note
AOS abstracts kvm, virsh, qemu, libvirt, and iSCSI from the end-user and handles all backend configuration. This allows the user to focus higher up the stack on the VMs via Prism / ACLI. The following is for informational purposes only and it is not recommended to manually mess with virsh, libvirt etc.
Each AHV host runs an iSCSI redirector which regularly checks the health of Stargates throughout the cluster using NOP commands.
In the iscsi_redirector log (located in /var/log/ on the AHV host), you can see each Stargate’s health:
2017-08-18 19:25:21,733 - INFO - Portal 192.168.5.254:3261 is up
...
2017-08-18 19:25:25,735 - INFO - Portal 10.3.140.158:3261 is up
2017-08-18 19:25:26,737 - INFO - Portal 10.3.140.153:3261 is up
NOTE: The local Stargate is shown via its 192.168.5.254 internal address.
In the following you can see the iscsi_redirector is listening on 127.0.0.1:3261:
[root@NTNX-BEAST-1 ~]# netstat -tnlp | egrep tcp.*3261
Proto ... Local Address Foreign Address State PID/Program name
...
tcp ... 127.0.0.1:3261 0.0.0.0:* LISTEN 8044/python
...
QEMU is configured with the iSCSI redirector as the iSCSI target portal. Upon a login request, the redirector will perform an iSCSI login redirect to a healthy Stargate (preferably the local one).
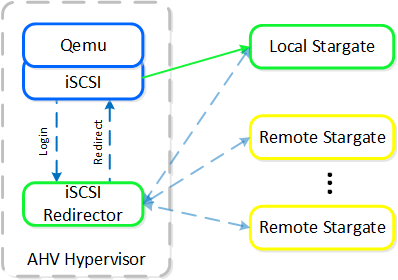 iSCSI Multi-pathing - Normal State
The preferred controller type is virtio-scsi (default for SCSI devices). IDE devices, while possible, are not recommended for most scenarios. In order for virtio to be used with Windows the virtio drivers, Nutanix mobility drivers, or Nutanix guest tools must be installed. Modern Linux distros ship with virtio pre-installed.
In the event where the active Stargate goes down (thus failing to respond to the NOP OUT command), the iSCSI redirector will mark the local Stargate as unhealthy. When QEMU retries the iSCSI login, the redirector will redirect the login to another healthy Stargate.
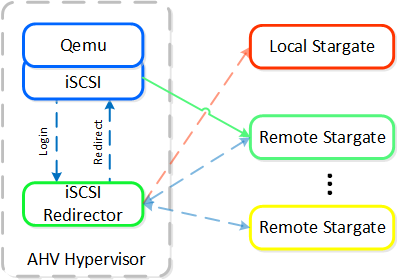 iSCSI Multi-pathing - Local CVM Down
Once the local CVM’s Stargate comes back up (and begins responding to the NOP OUT commands), the remote Stargate will quiesce then kill all connections to remote iSCSI sessions. QEMU will then attempt an iSCSI login again and will be redirected to the local Stargate.
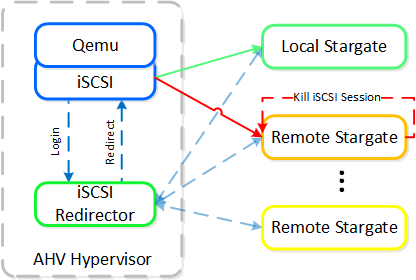 iSCSI Multi-pathing - Local CVM Back Up
Traditional I/O Path
Like every hypervisor and OS there is a mix of user and kernel space components which interact to perform a common activity. Prior to reading the following, it is recommended to read the ‘User vs. Kernel Space’ section to learn more about how each interact with each other.
When a VM performs an I/O it will perform the following (some steps have been excluded for clarity):
- VM’s OS perform SCSI command(s) to virtual device(s)
- Virtio-scsi takes those requests and places them in the guest’s memory
- Requests are handled by the QEMU main loop
- Libiscsi inspects each request and forwards
- Network layer forwards requests to local CVM (or externally if local is unavailable)
- Stargate handles request(s)
The following shows this sample flow:
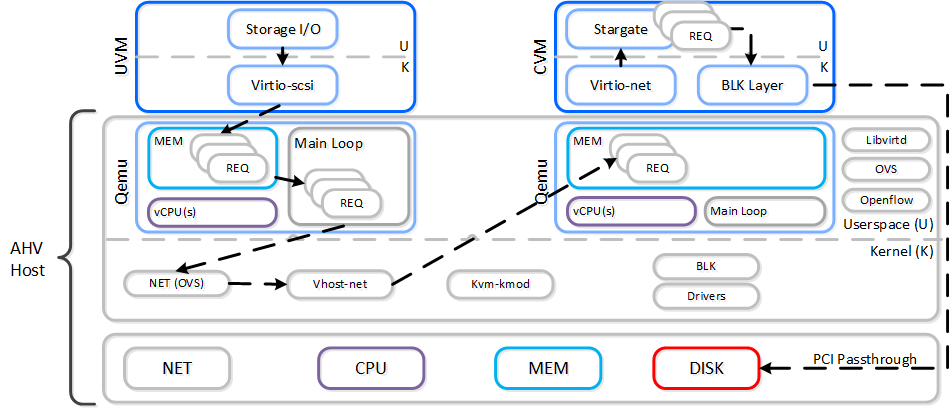 AHV VirtIO Data Path - Classic
Looking at an AHV host, you can see qemu-kvm has established sessions with a healthy Stargate using the local bridge and IPs. For external communication, the external host and Stargate IPs will be used. NOTE: There will be one session per disk device (look at PID 24845)
[root@NTNX-BEAST-1 log]# netstat -np | egrep tcp.*qemu
Proto ... Local Address Foreign Address State PID/Program name
tcp ... 192.168.5.1:50410 192.168.5.254:3261 ESTABLISHED 25293/qemu-kvm
tcp ... 192.168.5.1:50434 192.168.5.254:3261 ESTABLISHED 23198/qemu-kvm
tcp ... 192.168.5.1:50464 192.168.5.254:3261 ESTABLISHED 24845/qemu-kvm
tcp ... 192.168.5.1:50465 192.168.5.254:3261 ESTABLISHED 24845/qemu-kvm
...
Now in this path there are a few inefficiencies as the main loop is single threaded and libiscsi inspects every SCSI command.
Frodo I/O Path (aka AHV Turbo Mode)
As storage technologies continue to evolve and become more efficient, so must we. Given the fact that we fully control AHV and the Nutanix stack this was an area of opportunity.
In short Frodo is a heavily optimized I/O path for AHV that allows for higher throughput, lower latency and less CPU overhead.
Note
Pro tip
Frodo is enabled by default on VMs powered on after AOS 5.5.X.
When a VM performs an I/O it will perform the following (some steps have been excluded for clarity):
- VM’s OS perform SCSI command(s) to virtual device(s)
- Virtio-scsi takes those requests and places them in the guest’s memory
- Requests are handled by Frodo
- Custom libiscsi appends iscsi header and forwards
- Network layer forwards requests to local CVM (or externally if local is unavailable)
- Stargate handles request(s)
The following shows this sample flow:
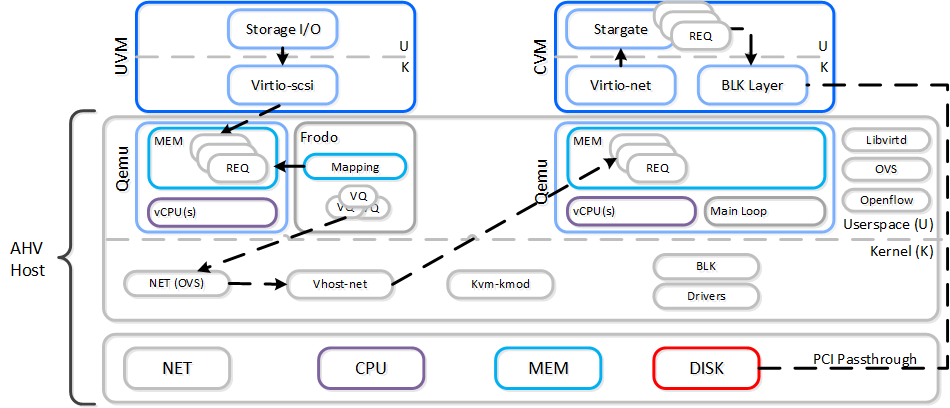 AHV VirtIO Data Path - Frodo
The following path does looks similar to the traditional I/O except for a few key differences:
- Qemu main loop is replaced by Frodo (vhost-user-scsi)
- Frodo exposes multiple virtual queues (VQs) to the guest (one per vCPU)
- Leverages multiple threads for multi-vCPU VMs
- Libiscsi is replaced by our own much more lightweight version
To the guest it will notice that it now has multiple queues for the disk device(s), other than that it’ll just see the performance improvements. In some cases we’ve seen a CPU overhead reduction of 25% to perform the I/O and performance increases of up to 3x compared to Qemu! Comparing to another hypervisor we’ve seen CPU overhead to perform I/Os drop by up to 3x.
Looking at an AHV host, you will see a frodo process for each VM (qemu-kvm process) running:
[root@drt-itppc03-1 ~]# ps aux | egrep frodo
... /usr/libexec/qemu-kvm ... -chardev socket,id=frodo0,fd=3 \
 -device vhost-user-scsi-pci,chardev=frodo0,num_queues=16...

... /usr/libexec/frodo ... 127.0.0.1:3261 -t iqn.2010-06.com.nutanix:vmdisk...
...
Note
Pro tip
To take advantage of Frodo's multiple threads / connections, you must have >= 2 vCPU for a VM when it is powered on.
It can be characterized by the following:
-
1 vCPU UVM:
- 1 Frodo thread / session per disk device
- >= 2 vCPU UVM:
- 2 Frodo threads / sessions per disk device
In the following, you can see Frodo has established sessions with a healthy Stargate using the local bridge and IPs. For external communication, the external host and Stargate IPs will be used.
[root@NTNX-BEAST-1 log]# netstat -np | egrep tcp.*frodo
Proto ... Local Address Foreign Address State PID/Program name
tcp ... 192.168.5.1:39568 192.168.5.254:3261 ESTABLISHED 42957/frodo
tcp ... 192.168.5.1:39538 192.168.5.254:3261 ESTABLISHED 42957/frodo
tcp ... 192.168.5.1:39580 192.168.5.254:3261 ESTABLISHED 42957/frodo
tcp ... 192.168.5.1:39592 192.168.5.254:3261 ESTABLISHED 42957/frodo
...
IP Address Management
The Acropolis IP address management (IPAM) solution provides the ability to establish a DHCP scope and assign addresses to VMs. This leverages VXLAN and OpenFlow rules to intercept the DHCP request and respond with a DHCP response.
Here we show an example DHCP request using the Nutanix IPAM solution where the Acropolis Leader is running locally:
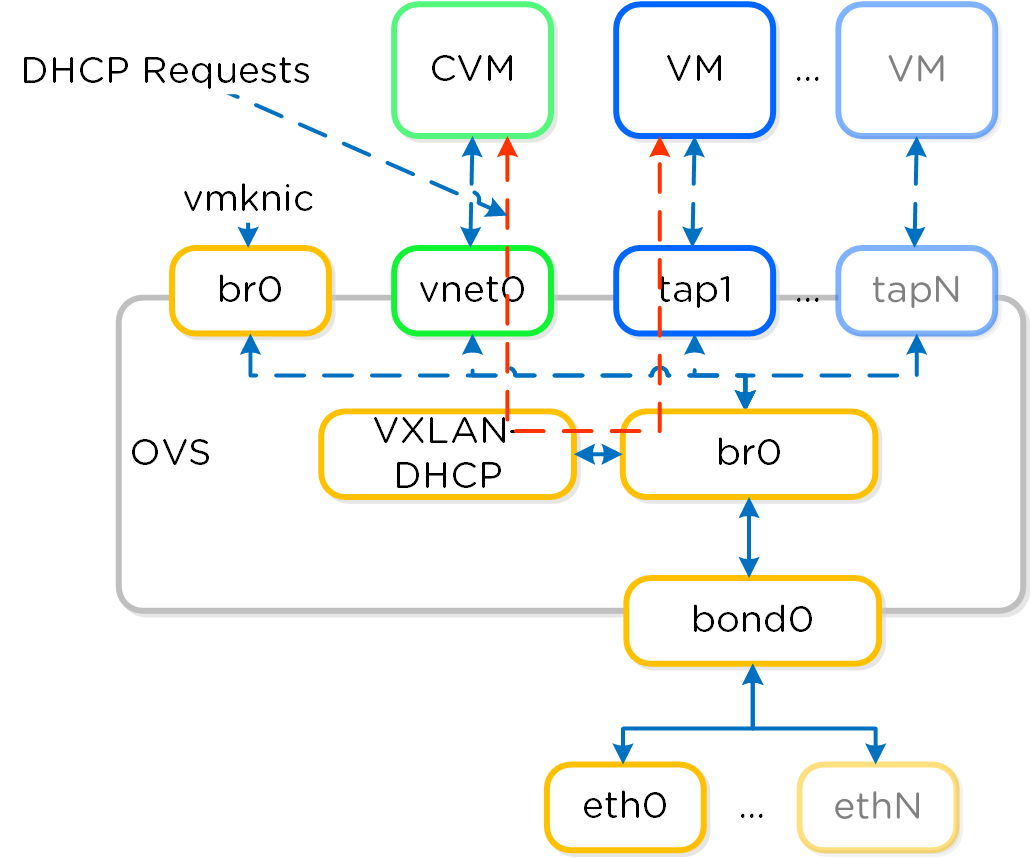 IPAM - Local Acropolis Leader
If the Acropolis Leader is running remotely, the same VXLAN tunnel will be leveraged to handle the request over the network.
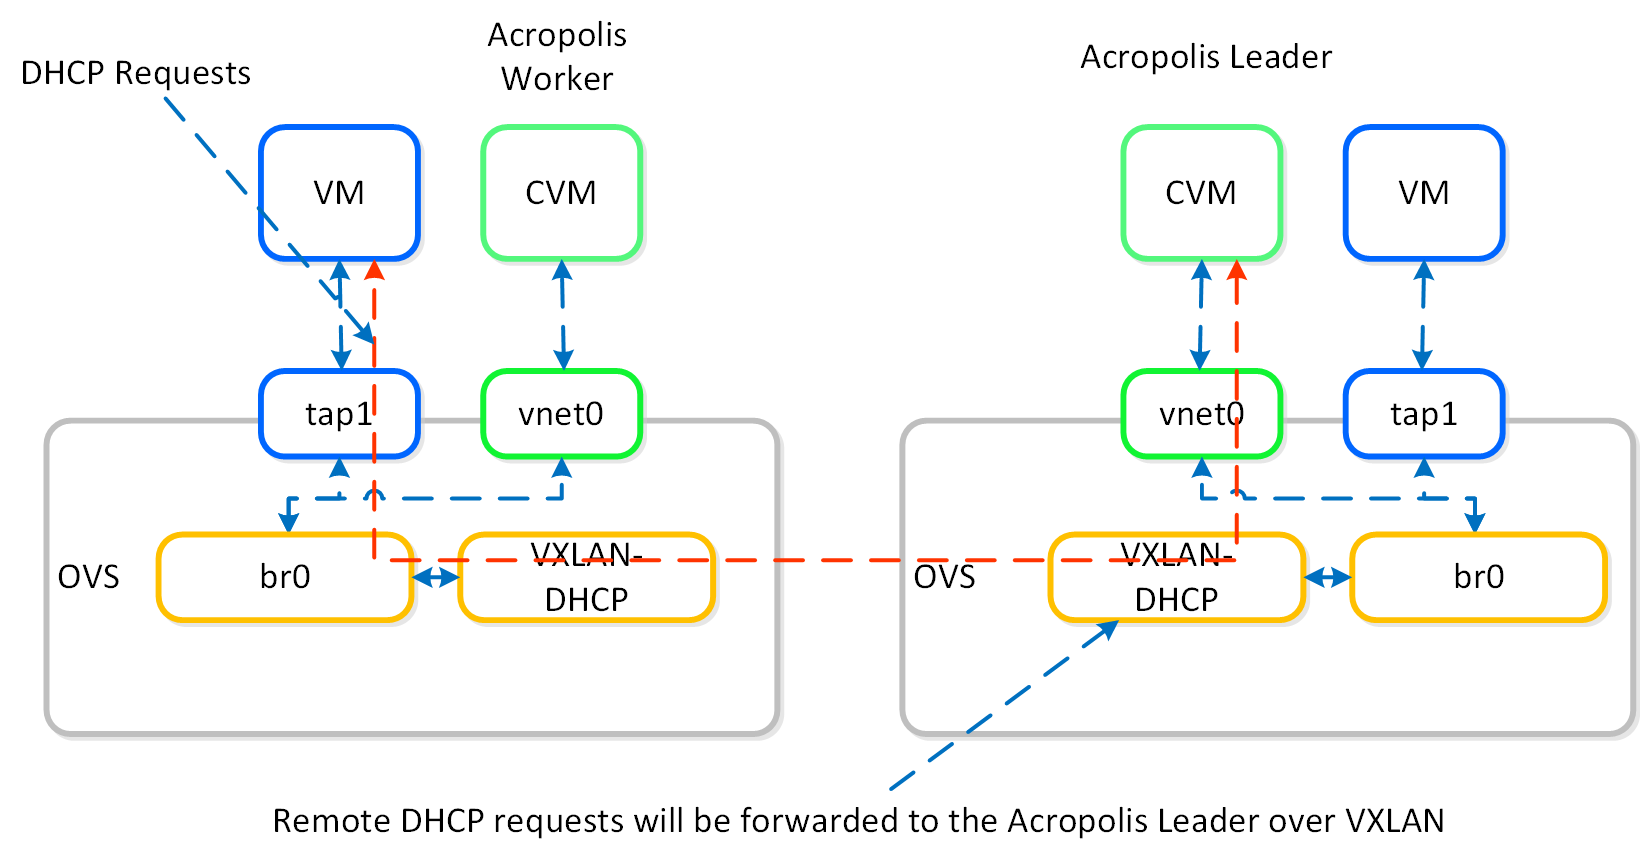 IPAM - Remote Acropolis Leader
Traditional DHCP / IPAM solutions can also be leveraged in an ‘unmanaged’ network scenario.
VM High Availability (HA)
AHV VM HA is a feature built to ensure VM availability in the event of a host or block outage. In the event of a host failure the VMs previously running on that host will be restarted on other healthy nodes throughout the cluster. The Acropolis Leader is responsible for restarting the VM(s) on the healthy host(s).
The Acropolis Leader tracks host health by monitoring its connections to the libvirt on all cluster hosts:
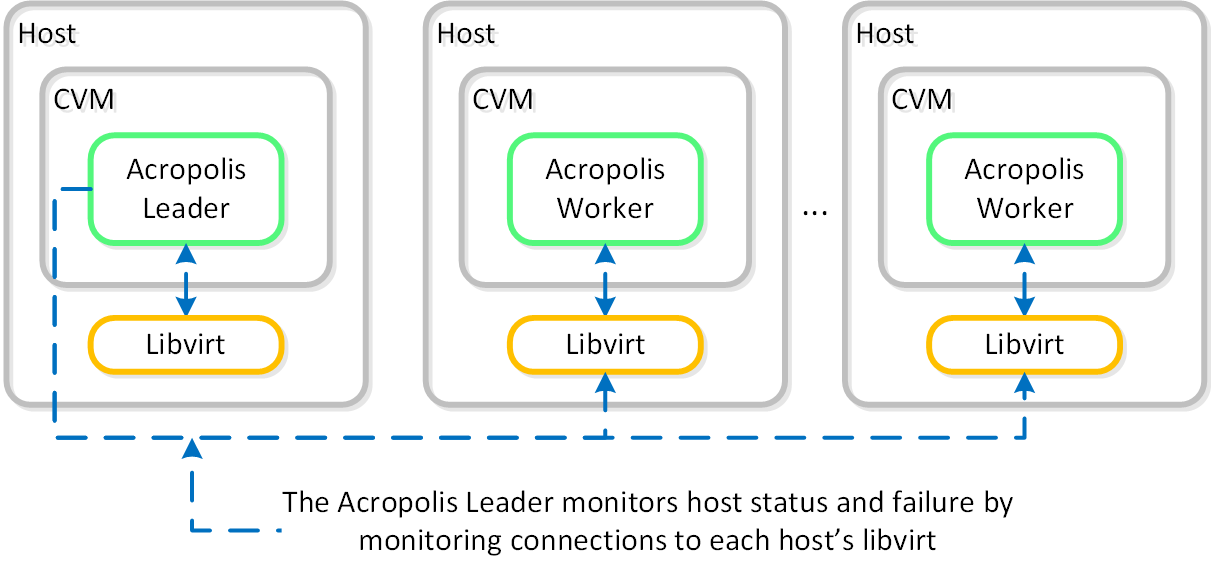 HA - Host Monitoring
Once the libvirt connection goes down, the countdown to the HA restart is initiated. Should libvirt connection fail to be re-established within the timeout, Acropolis will restart VMs that were running on the disconnected host. When this occurs, VMs should be restarted within 120 seconds.
In the event the Acropolis Leader becomes partitioned, isolated or fails a new Acropolis Leader will be elected on the healthy portion of the cluster. If a cluster becomes partitioned (e.g X nodes can’t talk to the other Y nodes) the side with quorum will remain up and VM(s) will be restarted on those hosts.
There are two main modes for VM HA:
- Default
- This mode requires no configuration and is included by default when installing an AHV-based Nutanix cluster. When an AHV host becomes unavailable, the VMs that were running on the failed AHV host restart on the remaining hosts, depending on the available resources. Not all of the failed VMs restart if the remaining hosts do not have sufficient resources.
- Guarantee
- This non-default configuration reserves space throughout the AHV hosts in the cluster to guarantee that all failed VMs can restart on other hosts in the AHV cluster during a host failure. To enable Guarantee mode, select the Enable HA check box, as shown in the figure below. A message then appears displaying the amount of memory reserved and how many AHV host failures can be tolerated.
Resource Reservations
When using the Guarantee mode for VM HA, the system will reserve host resources for VMs. The amount of resources which are reserved is summarized by the following:
- If all containers are RF2 (FT1)
- One “host” worth of resources
- If any containers are RF3 (FT2)
- Two “hosts” worth of resources
When hosts have uneven memory capacities the system will use the largest host’s memory capacity when determining how much to reserve per host.
Note
Post 5.0 Resource Reservations
Prior to 5.0, we supported both host and segment based reservations. With 5.0 and later we now only support a segment based reservation which is automatically implemented when the Guarantee HA mode is selected.
Reserve segments distributes the resource reservation across all hosts in a cluster. In this scenario, each host will share a portion of the reservation for HA. This ensures the overall cluster has enough failover capacity to restart VM(s) in the event of a host failure.
The figure shows an example scenario with reserved segments:
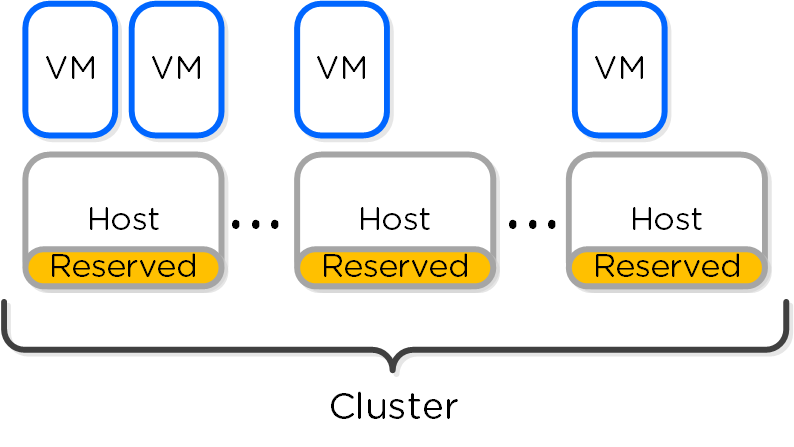 HA - Reserved Segment
In the event of a host failure VM(s) will be restarted throughout the cluster on the remaining healthy hosts:
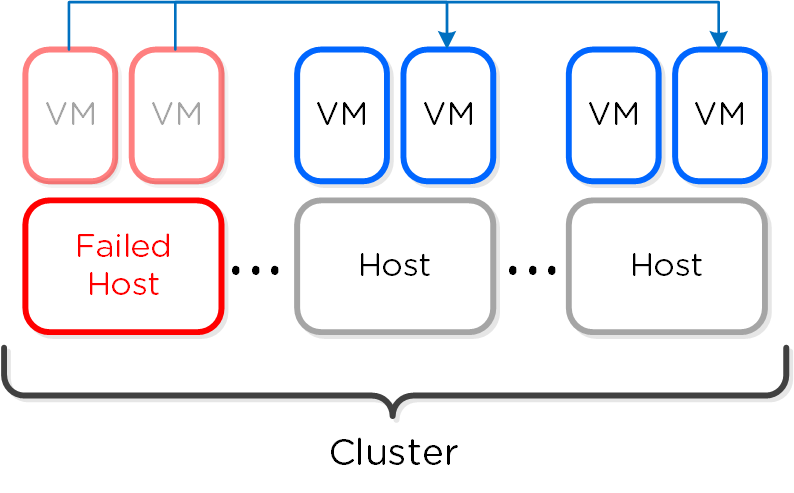 HA - Reserved Segment - Fail Over
Virtual Machine High Availability Calculation
The VM high availability Guarantee configuration ensures that every VM in a cluster can restart if an AHV host becomes unavailable. To make this capability possible, VM high availability performs complex calculations every time a VM goes through a start cycle in the cluster. VM high availability Guarantee mode uses segments (setting: kAcropolisHAReserveSegments) when performing these failover calculations. Before it starts a VM, the cluster must ensure the following:
- The VM can run on the target AHV host.
- The VM can run on at least one other AHV host in the cluster, taking into account special requirements such as VM-host affinity rules and GPUs that can prevent a VM from running on specific hosts.
- All VMs currently running on the AHV host can run on any other AHV hosts in the cluster, taking into account special requirements such as VM-host affinity rules and GPUs that can prevent a VM from running on specific hosts.
- All VMs currently running in the cluster can run on another AHV host in the cluster if any AHV hosts become unavailable, taking into account special requirements such as VM-host affinity rules and GPUs that can prevent a VM from running on specific hosts.
- The VM starts immediately after resource calculation. The cluster can’t start any other VMs during this time, and it can’t allow live migrations until the VM starts successfully.
The cluster assigns a VM a parcel, which is a logical unit defining the resources the VM requires to run. A VM parcel takes resources on the AHV host where it’s running and reserves a segment on another AHV host in the cluster for failover purposes. AHV resources that are not used by VM parcels are available for running additional VMs or for failover capacity.
Note
Note
A parcel takes resources away from the AHV host where it runs, but you can map multiple parcels to the same AHV host failover segment if the parcels belong to VMs running on different AHV hosts.
The figures in this section use the following color coding:
- A gray box represents the total AHV capacity to run VMs.
- A blue box represents a running VM.
- A teal box represents VM failover requirements defined by a segment.
- A red box represents a VM failure to start.
These examples assume a three-node cluster where each AHV host has the same amount of memory and can provide the same quantity of resources to run VMs.
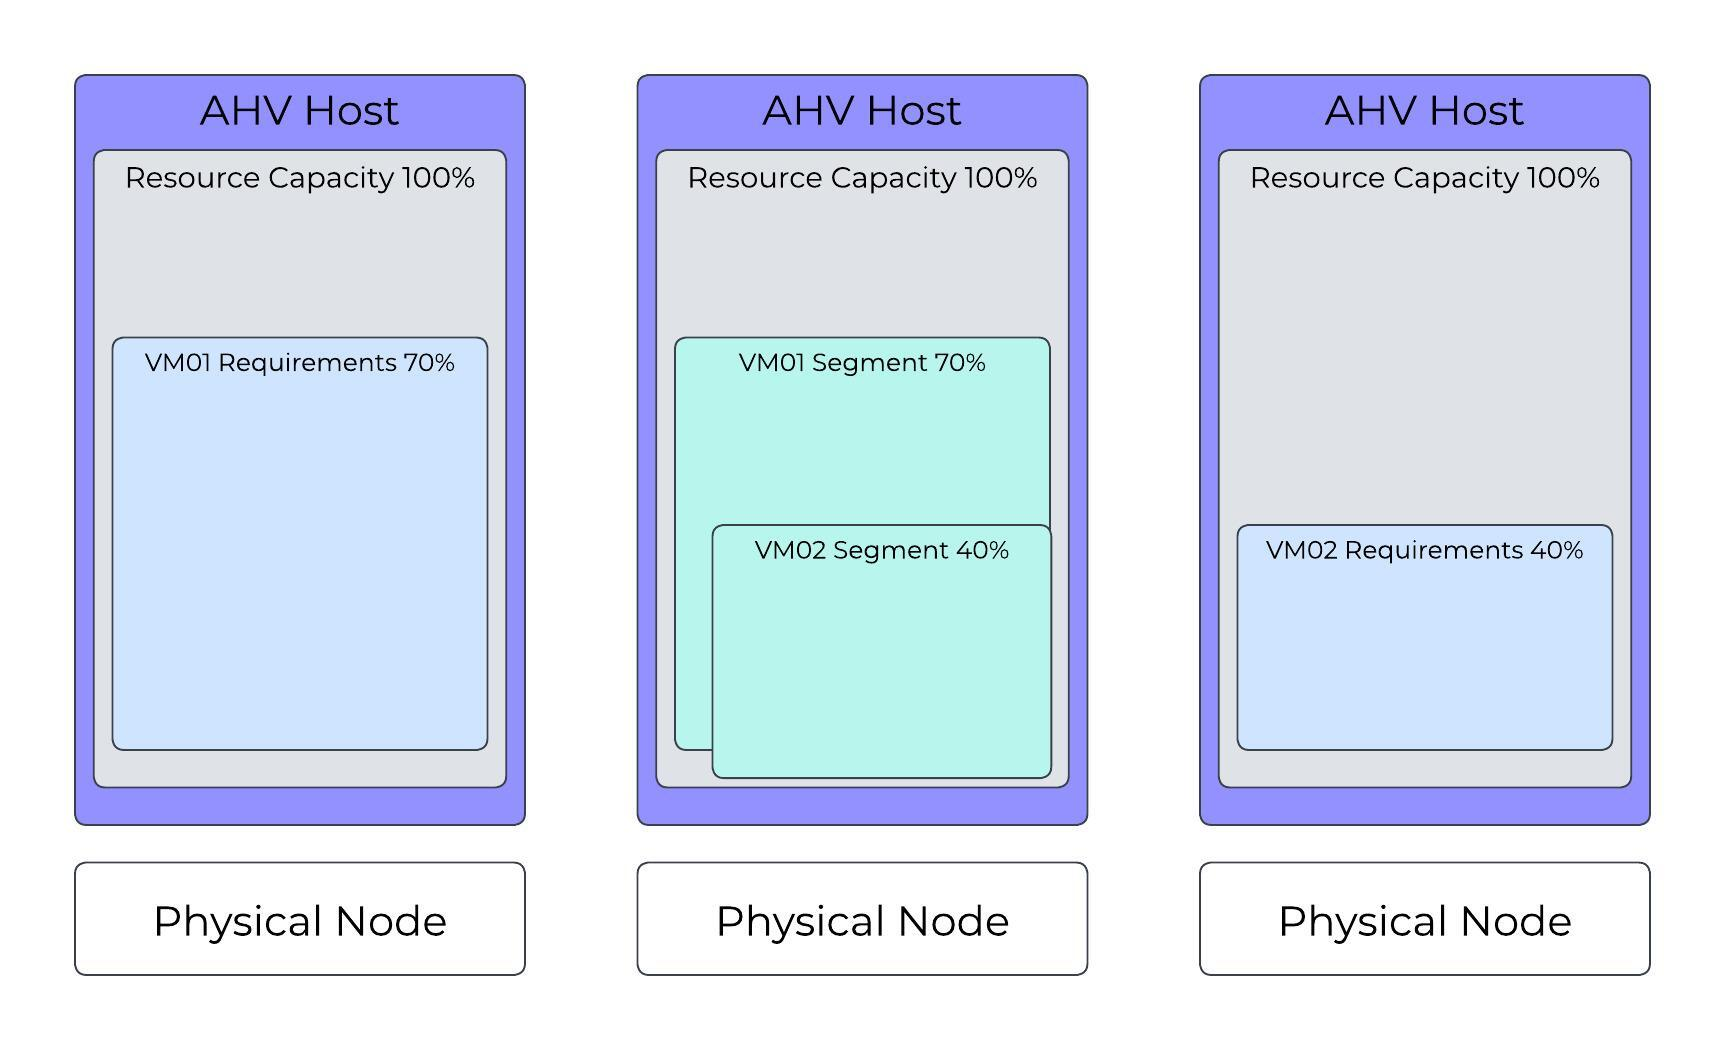
AHV Cluster with One VM Running
Starting a VM (VM01) that uses 70 percent of an AHV host’s resources first takes resources from the AHV host where it’s started (AHV Host 1), then takes a segment of resources from any other AHV host in the cluster to ensure coverage in a failover scenario. In this configuration, VM01 can start when AHV Host 1 is unavailable.
 AHV Cluster: Valid Configuration with One VM Running
AHV Cluster with Two VMs Running
Building on the first scenario, the system requests a start operation for VM02, which uses 40 percent of an AHV host’s resources. In this configuration, AHV Host 3 can run the VM, and AHV Host 2 can provide a segment (failover capacity) for the VM. Remember that you can map multiple segments to the same AHV resources if the segments belong to VMs running on different AHV hosts.
 AHV Cluster: Valid Configuration with Two VMs Running
Note
Note
AHV resources not used by running VMs are available for running additional VMs or for failover capacity. AHV Host 2 has 30 percent of its resources available to run VMs because it must account for the largest segment or group of segments from the same remote AHV host. The cluster can't use AHV resources assigned for failover capacity to run VMs.
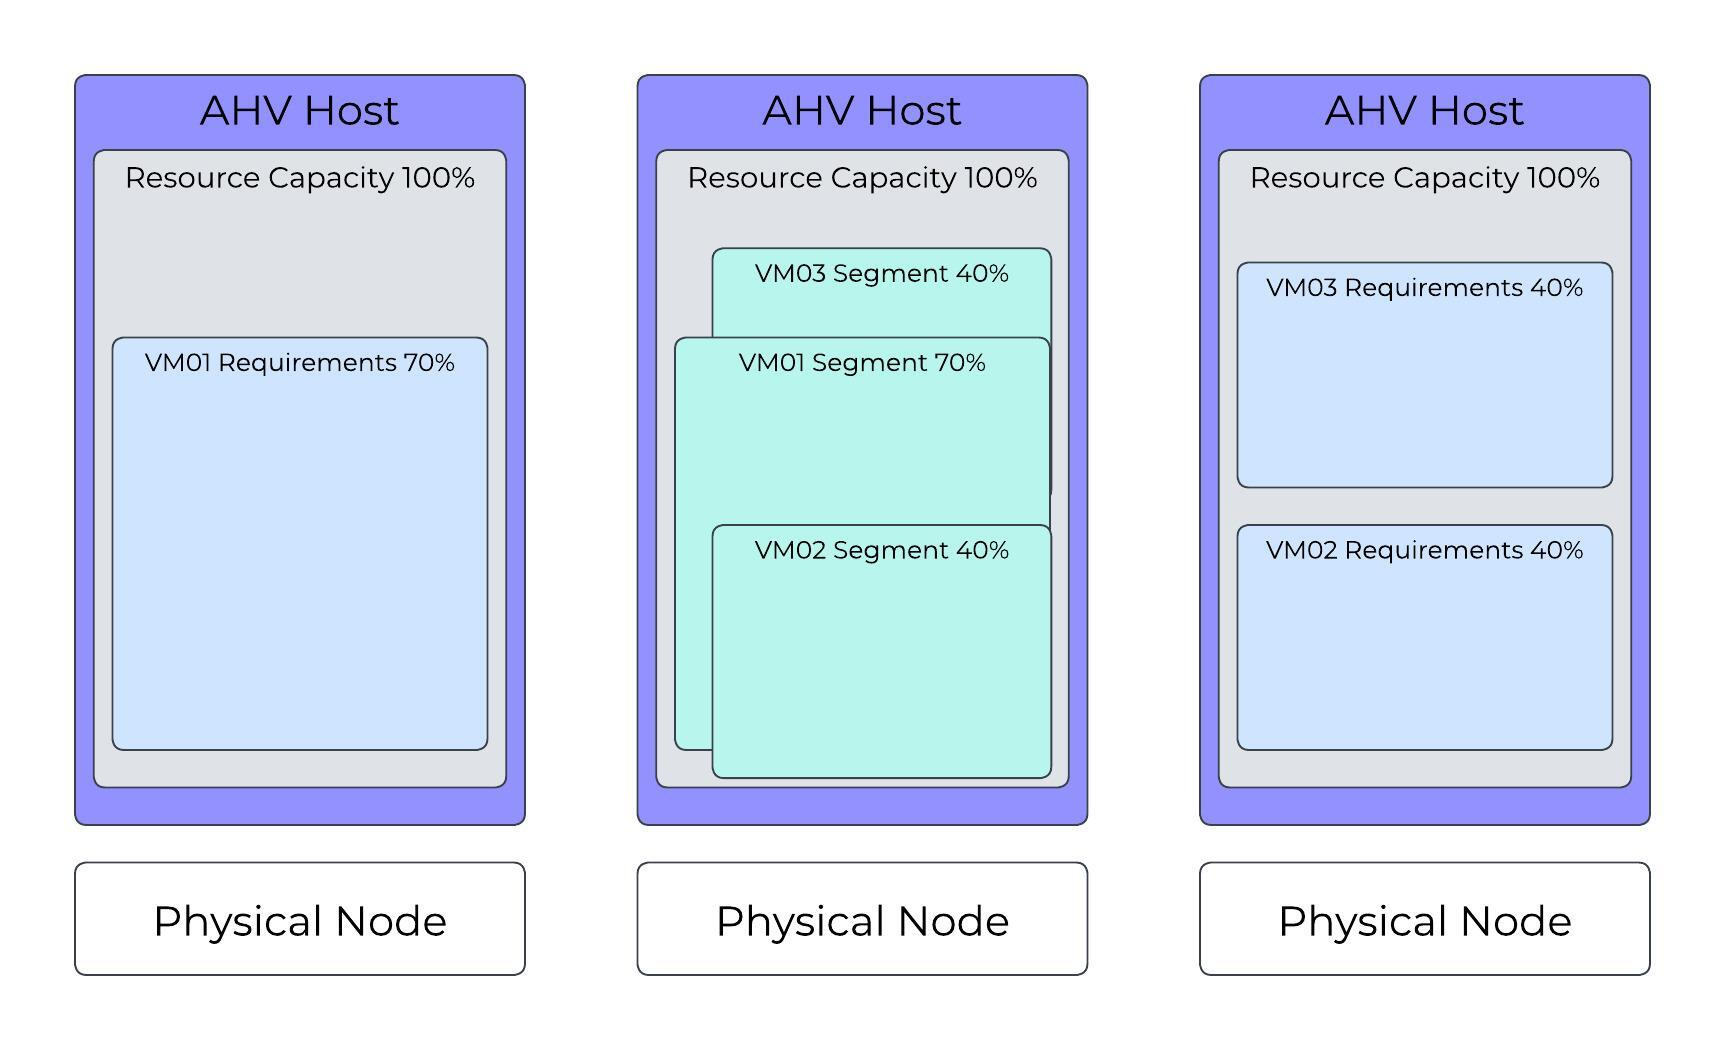
AHV Cluster with Three VMs Running
Building on the previous two scenarios, the system requests a start operation for VM03, which, like VM02, uses 40 percent of an AHV host’s resources. In this configuration, AHV Host 3 can run the new VM, and AHV Host 2 can provide a segment (failover capacity) for it.
 AHV Cluster: Valid Configuration with Three VMs Running
In this scenario, AHV Host 2 now has 20 percent or 30 percent of its resources available for additional failover segments, or only 20 percent for running VMs.
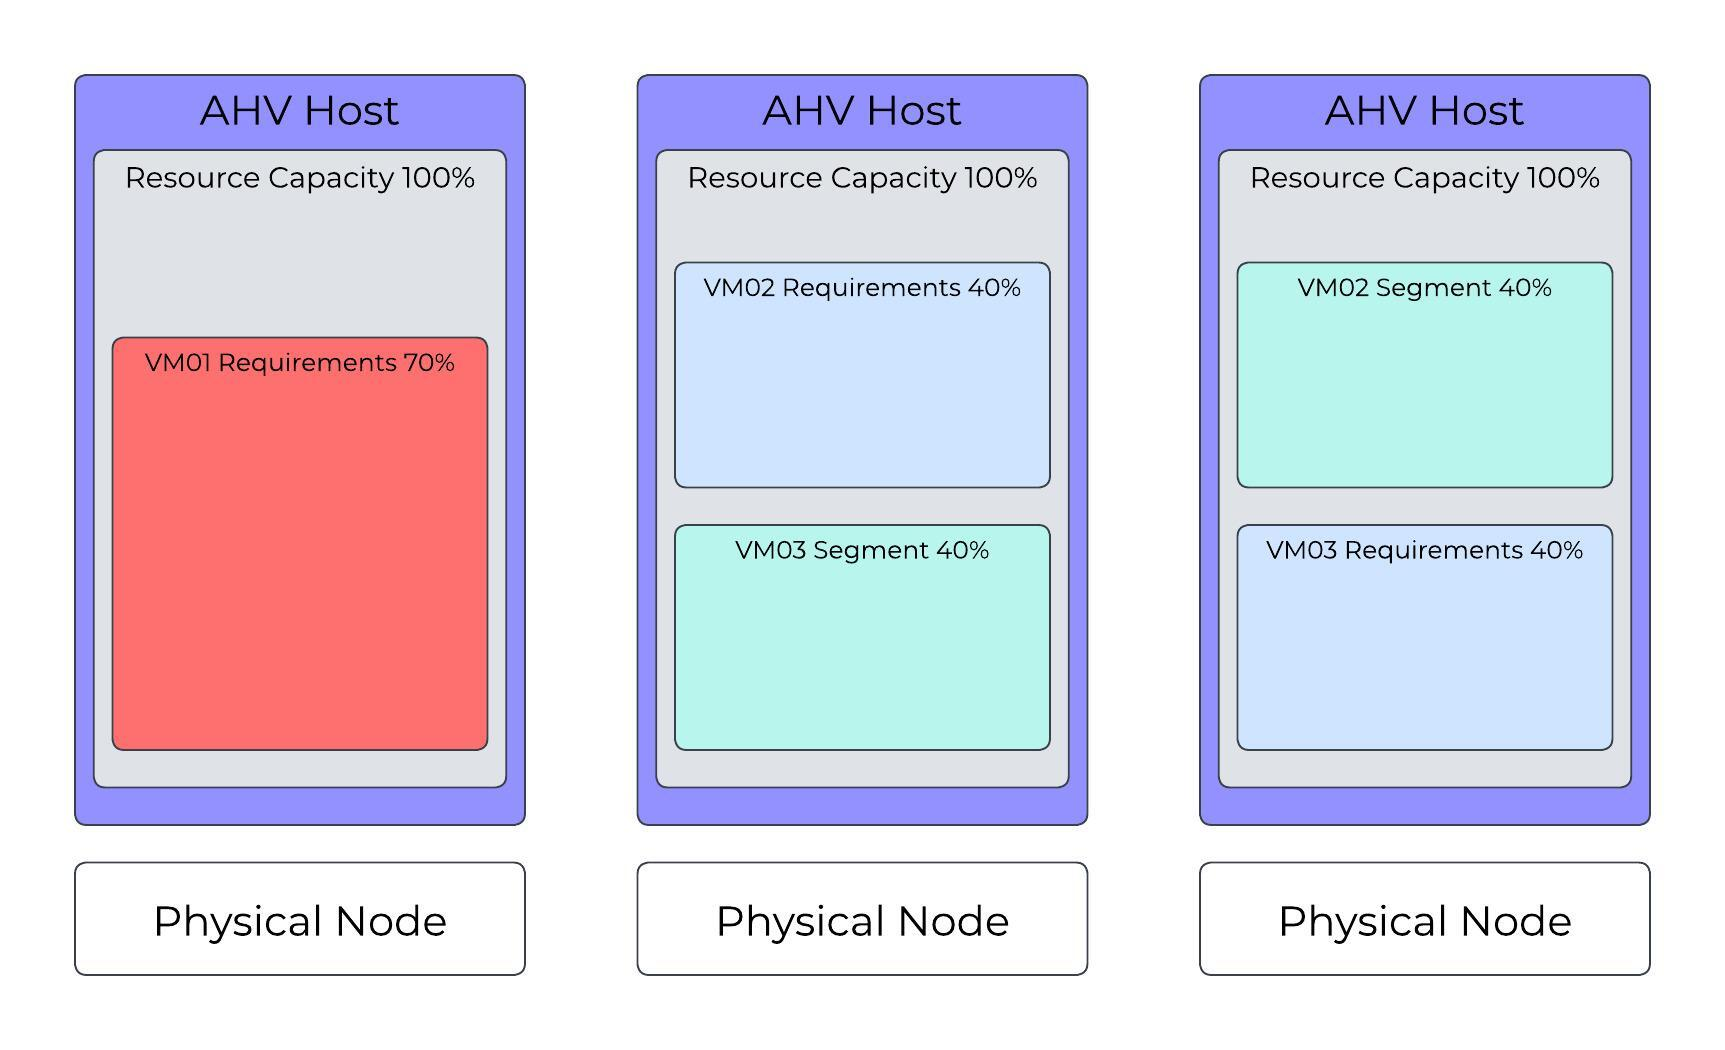
AHV Cluster with Invalid State
In this scenario, VM02 and VM03, which each use 40 percent of an AHV host’s resources, run on different AHV hosts. The system requests a start operation for VM01, which uses 70 percent of an AHV host’s resources. Although AHV Host 1 can run VM01, the cluster in this configuration doesn’t have enough segments available to provide failover capacity for all VMs if an AHV host becomes unavailable.
 AHV Cluster: Invalid State, Can’t Run VM01
Note
Reserved segment(s) calculation
The system will automatically calculate the total number of reserved segments and per host reservation.
Finding reservations reduces to a well known set of problems called Knapsack. The optimal solution is NP-hard (exponential), but heuristic solutions can come close to optimal for the common case. We implement one such algorithm called MTHM. Nutanix will continue improving its placement algorithms.
Virtual Machine High Availability Failure Scenarios
The VM high availability failure detection mechanism monitors cluster state and triggers actions in the AHV cluster when an AHV host fails. Every CVM runs an Acropolis service. One CVM in the cluster hosts the Acropolis leader, which monitors failures, and the rest of the CVMs host an Acropolis worker. The Acropolis leader issues one communication per second between itself and each AHV host’s libvirtd process. If this communication fails and isn’t reestablished within X seconds, VM high availability initiates a failure process. The number of seconds depends on the failure scenario.
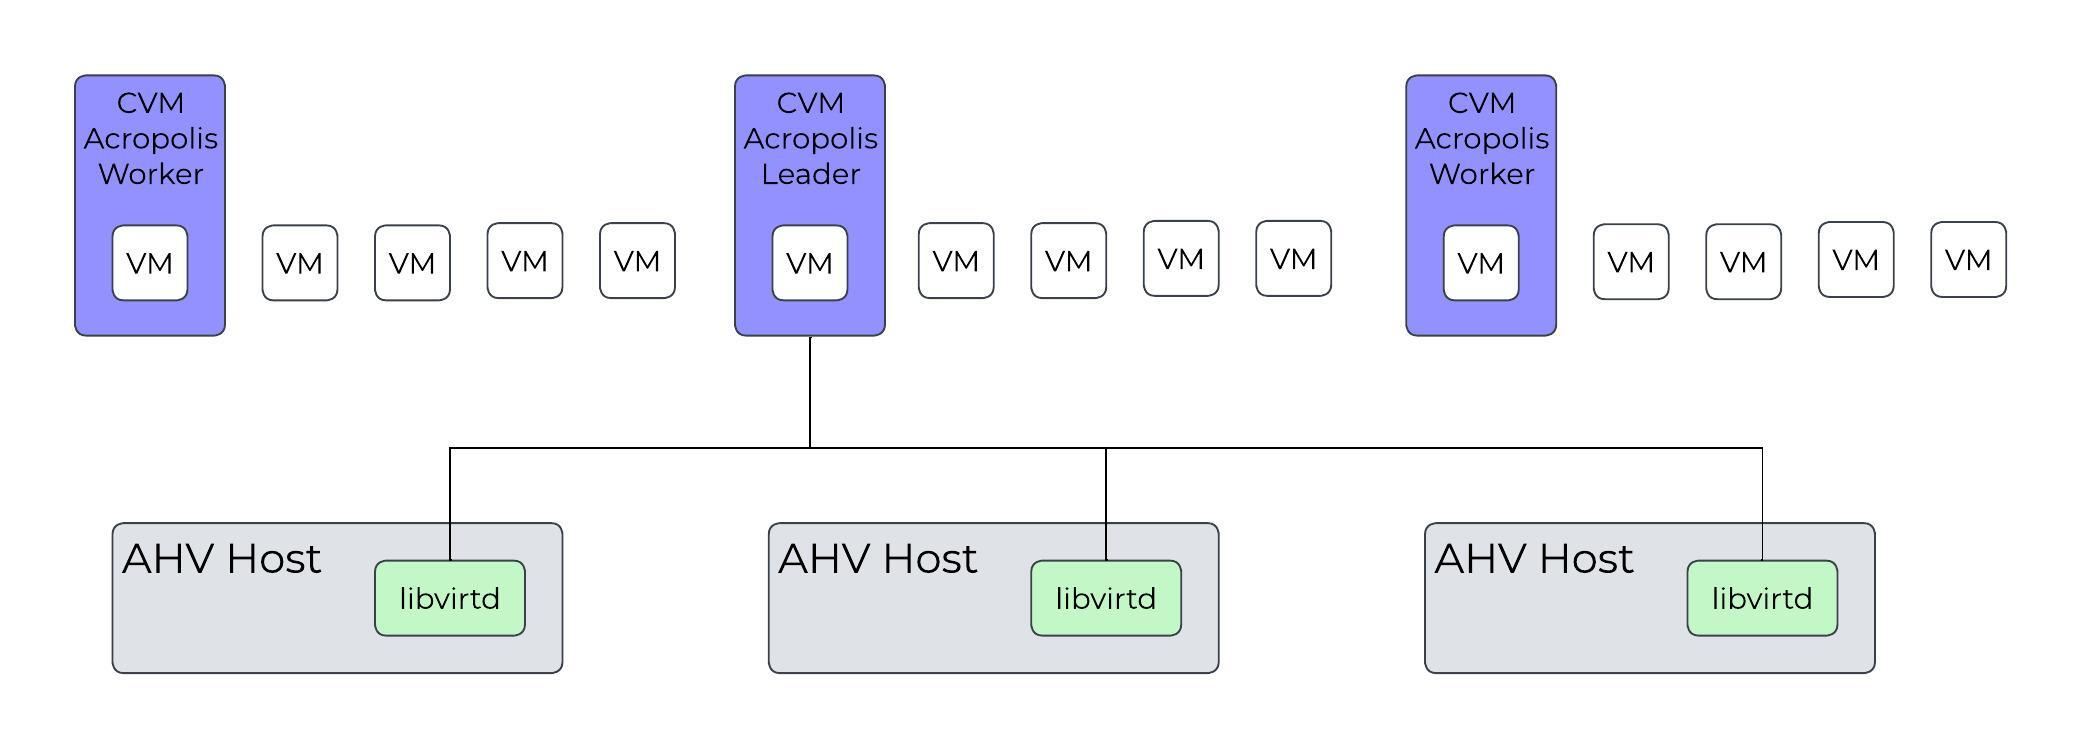 VM High Availability CVM to AHV Host Communication
Nutanix AHV’s failure process provides automatic protection against phantom VMs, so a cluster never has more than one copy of a VM running at any time.
Acropolis Leader Online and a Remote AHV Host is Unavailable
This failure scenario applies when an AHV host or AHV host management process fails.
Table: Remote AHV Host is Unavailable
| Time in Seconds | Description |
|---|---|
| T- | Normal operation: Acropolis leader can complete health checks against all remote AHV hosts’ libvirtd processes successfully. |
| T0 | Acropolis leader loses network connectivity to a remote AHV host’s libvirtd process. |
| T20 | Acropolis leader starts a 40-second timeout. |
| T60 | Acropolis leader instructs all CVM Stargate processes to block I/O from the AHV host that lost connectivity. Acropolis leader waits for all remote CVM Stargate processes to acknowledge the I/O block. |
| T120 | All VMs restart. Acropolis leader distributes the VM start requests to the available AHV hosts. |
Acropolis Leader Is Online and a Remote AHV Host Is Network Partitioned
The major difference between the previous failure scenario and this scenario is that the network-partitioned AHV host can run VMs. However, because the network-partitioned AHV host can’t access the VMs’ virtual disks, the VMs in the network-partitioned AHV host fail 45 seconds after the first I/O failure. This design ensures that starting the same VMs on other AHV hosts doesn’t lead to multiple copies of the same VM.
Table: Network Partition
| Time in Seconds | Description |
|---|---|
| T- | Normal operation: Acropolis leader can complete health checks against all remote AHV hosts’ libvirtd processes successfully. |
| T0 | Acropolis leader loses network connectivity to a remote AHV host’s libvirtd process. |
| T20 | Acropolis leader starts a 40-second timeout. |
| T60 | Acropolis leader instructs all CVM Stargate processes to block I/O from the AHV host that lost connectivity. Acropolis leader waits for all remote CVM Stargate processes to acknowledge the I/O block. Because all I/O is blocked, the VMs can’t make any progress on T120 the network-partitioned AHV host, so you can continue. The VMs on the network-partitioned AHV host terminate 45 seconds after the first failed I/O request. |
| T120 | All VMs restart. Acropolis leader distributes the VM start requests to the available AHV hosts |
Acropolis Leader Fails
The Acropolis leader can fail in the following situations:
- The management process on the AHV host running the Acropolis leader fails.
- The AHV host running the CVM with the Acropolis leader fails.
- The AHV host running the CVM with the Acropolis leader becomes network partitioned.
Table: Acropolis Leader Failure
| Time in Seconds | Description |
|---|---|
| T- | Normal operation: Acropolis leader can complete health checks against all remote AHV hosts’ libvirtd processes successfully. |
| T0 | The AHV host running Acropolis leader becomes unavailable. |
| T20 | The remaining available AHV hosts elect a new Acropolis leader. |
| T60 | The new Acropolis leader instructs all CVM Stargate processes to block I/O from the AHV host where the original Acropolis leader ran. Acropolis leader waits for all remote CVM T120 Stargate processes to acknowledge the I/O block. |
| T120 | All VMs restart. Acropolis leader distributes the VM start requests to the available AHV hosts. |
» Download this section as PDF (opens in a new tab/window)
Command Reference
Show OVS uplinks
Description: Show ovs uplinks for local host
manage_ovs show_uplinks
Description: Show ovs uplinks for full cluster
allssh "manage_ovs show_uplinks"
Show OVS interfaces
Description: Show ovs interfaces for local host
manage_ovs show_interfaces
Show interfaces for full cluster
allssh "manage_ovs show_interfaces"
Show OVS switch information
Description: Show switch information
ovs-vsctl show
List OVS bridges
Description: List bridges
ovs-vsctl list br
Show OVS bridge information
Description: Show OVS port information
ovs-vsctl list port br0
ovs-vsctl list port bond
Show OVS interface information
Description: Show interface information
ovs-vsctl list interface br0
Show ports / interfaces on bridge
Description: Show ports on a bridge
ovs-vsctl list-ports br0
Description: Show ifaces on a bridge
ovs-vsctl list-ifaces br0
Add ports to bridge
Description: Add port to bridge
ovs-vsctl add-port bridge port
Description: Add bond port to bridge
ovs-vsctl add-bond bridge port iface
Show OVS bond details
Description: Show bond details
ovs-appctl bond/show bond
Example:
ovs-appctl bond/show bond0
Set bond mode and configure LACP on bond
Description: Enable LACP on ports
ovs-vsctl set port bond lacp=active/passive
Description: Enable on all hosts for bond0
for i in `hostips`;do echo $i; ssh $i source /etc/profile > /dev/null 2>&1; ovs-vsctl set port bond0 lacp=active;done
Show LACP details on bond
Description: Show LACP details
ovs-appctl lacp/show bond
Set bond mode
Description: Set bond mode on ports
ovs-vsctl set port bond bond_mode=active-backup, balance-slb, balance-tcp
Show OpenFlow information
Description: Show OVS openflow details
ovs-ofctl show br0
Description: Show OpenFlow rules
ovs-ofctl dump-flows br0
Get QEMU PIDs and top information
Description: Get QEMU PIDs
ps aux | grep qemu | awk '{print $2}'
Description: Get top metrics for specific PID
top -p PID
Get active Stargate for QEMU processes
Description: Get active Stargates for storage I/O for each QEMU processes
netstat –np | egrep tcp.*qemu
Metrics and Thresholds
More coming soon!
Troubleshooting & Advanced Administration
Check iSCSI Redirector Logs
Description: Check iSCSI Redirector Logs for all hosts
for i in `hostips`; do echo $i; ssh root@$i cat /var/log/iscsi_redirector;done
Example for single host
Ssh root@HOSTIP
Cat /var/log/iscsi_redirector
Monitor CPU steal (stolen CPU)
Description: Monitor CPU steal time (stolen CPU)
Launch top and look for %st (bold below)
Cpu(s): 0.0%us, 0.0%sy, 0.0%ni, 96.4%id, 0.0%wa, 0.0%hi, 0.1%si, **0.0%st**
Monitor VM network resource stats
Description: Monitor VM resource stats
Launch virt-top
Virt-top
vSphereLearn how VMware ESXi works on Nutanix.
» Download this section as PDF (opens in a new tab/window)
Node Architecture
In ESXi deployments, the Controller VM (CVM) runs as a VM and disks are presented using VMDirectPath I/O. This allows the full PCI controller (and attached devices) to be passed through directly to the CVM and bypass the hypervisor.
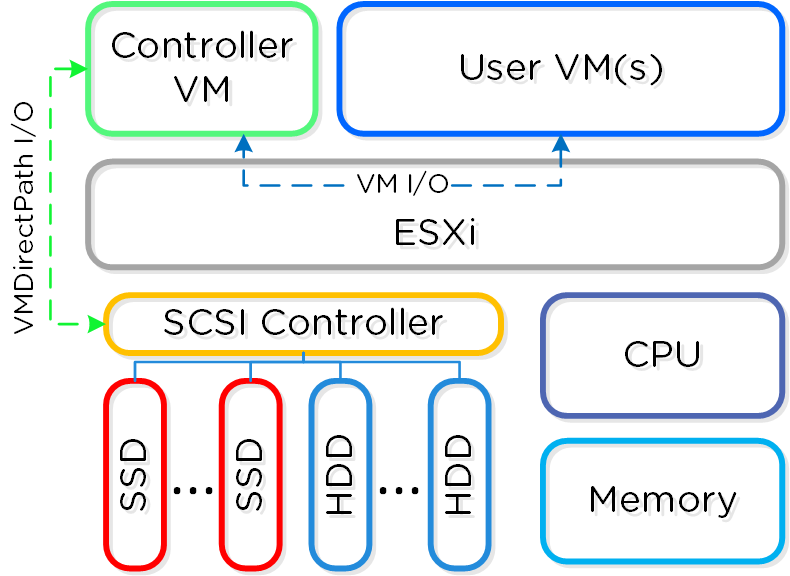 ESXi Node Architecture
Configuration Maximums and Scalability
The following configuration maximums and scalability limits are applicable:
- Maximum cluster size: 48
- Maximum vCPUs per VM: 256
- Maximum memory per VM: 6TB
- Maximum virtual disk size: 62TB
- Maximum VMs per host: 1,024
- Maximum VMs per cluster: 8,000 (2,048 per datastore if HA is enabled)
NOTE: As of vSphere 7.0 and AOS 6.8. Refer to AOS Configuration Maximums and ESX Configuration Maximums for other versions.
Note
Pro tip
When doing benchmarking on ESXi hosts, always test with the ESXi host power policy set to 'High performance'. This will disable and P- and C- states and will make sure the test results aren't artificially limited.
Networking
Each ESXi host has a local vSwitch which is used for intra-host communication between the Nutanix CVM and host. For external communication and VMs a standard vSwitch (default) or dvSwitch is leveraged.
The local vSwitch (vSwitchNutanix) is for local communication between the Nutanix CVM and ESXi host. The host has a vmkernel interface on this vSwitch (vmk1 - 192.168.5.1) and the CVM has an interface bound to a port group on this internal switch (svm-iscsi-pg - 192.168.5.2). This is the primary storage communication path.
The external vSwitch can be a standard vSwitch or a dvSwitch. This will host the external interfaces for the ESXi host and CVM as well as the port groups leveraged by VMs on the host. The external vmkernel interface is leveraged for host management, vMotion, etc. The external CVM interface is used for communication to other Nutanix CVMs. As many port groups can be created as required assuming the VLANs are enabled on the trunk.
The following figure shows a conceptual diagram of the vSwitch architecture:
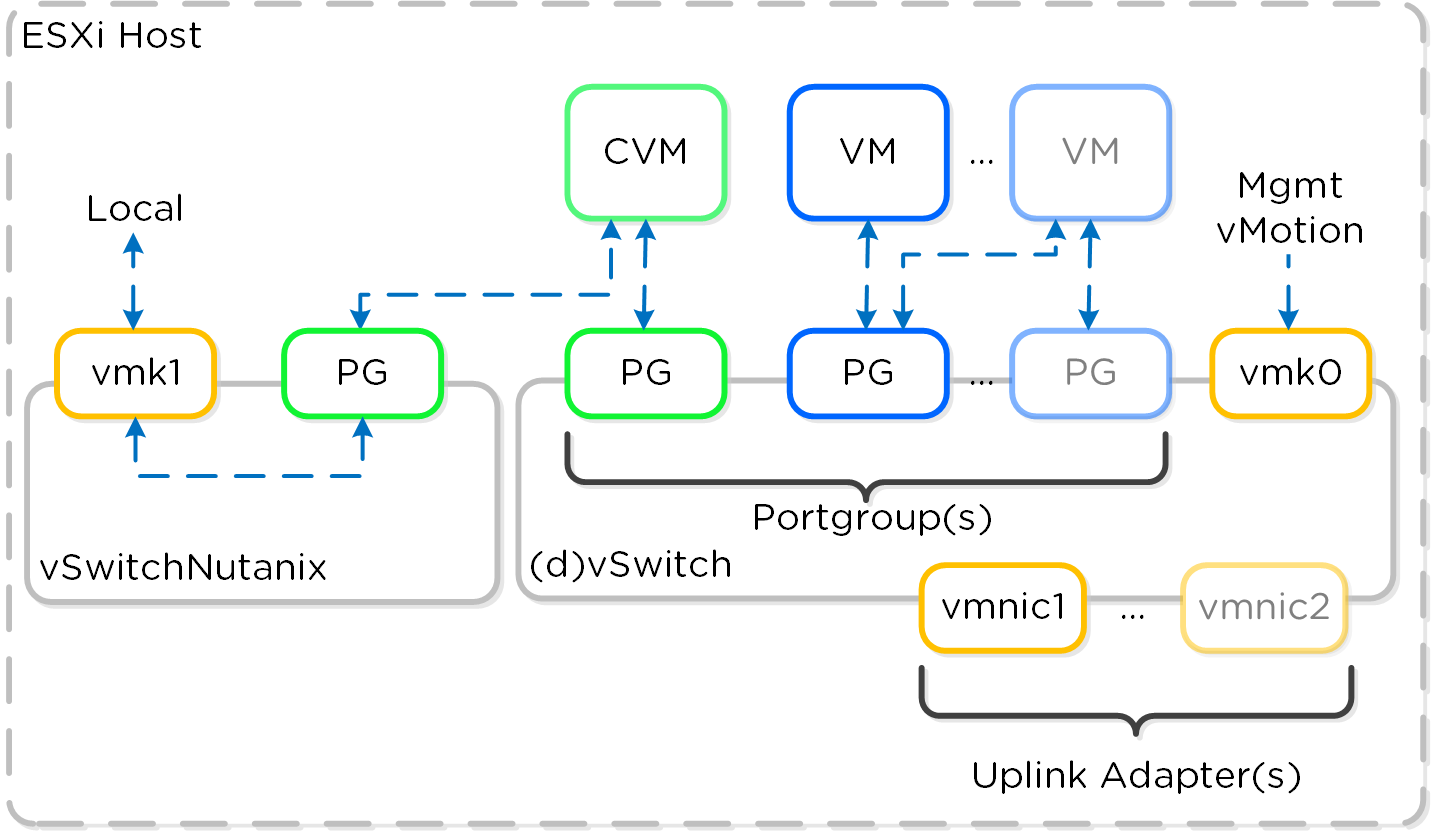 ESXi vSwitch Network Overview
Note
Uplink and Teaming policy
It is recommended to have dual ToR switches and uplinks across both switches for switch HA. By default the system will have uplink interfaces in active/passive mode. For upstream switch architectures that are capable of having active/active uplink interfaces (e.g. vPC, MLAG, etc.) that can be leveraged for additional network throughput.
» Download this section as PDF (opens in a new tab/window)
Array Offloads – VAAI
The Nutanix platform supports the VMware APIs for Array Integration (VAAI), which allows the hypervisor to offload certain tasks to the array. This is much more efficient as the hypervisor doesn’t need to be the ‘man in the middle’. Nutanix currently supports the VAAI primitives for NAS, including the ‘full file clone’, ‘fast file clone’, and ‘reserve space’ primitives. Here’s a good article explaining the various primitives: http://cormachogan.com/2012/11/08/vaai-comparison-block-versus-nas/.
For both the full and fast file clones, a DSF ‘fast clone’ is done, meaning a writable snapshot (using re-direct on write) for each clone that is created. Each of these clones has its own block map, meaning that chain depth isn’t anything to worry about. The following will determine whether or not VAAI will be used for specific scenarios:
- Clone VM with Snapshot –> VAAI will NOT be used
- Clone VM without Snapshot which is Powered Off –> VAAI WILL be used
- Clone VM to a different Datastore/Container –> VAAI will NOT be used
- Clone VM which is Powered On –> VAAI will NOT be used
These scenarios apply to VMware View:
- View Full Clone (Template with Snapshot) –> VAAI will NOT be used
- View Full Clone (Template w/o Snapshot) –> VAAI WILL be used
- View Linked Clone (VCAI) –> VAAI WILL be used
You can validate VAAI operations are taking place by using the ‘NFS Adapter’ Activity Traces page.
CVM Autopathing aka Ha.py
In this section, I’ll cover how CVM ‘failures’ are handled (I’ll cover how we handle component failures in future update). A CVM ‘failure’ could include a user powering down the CVM, a CVM rolling upgrade, or any event which might bring down the CVM. DSF has a feature called autopathing where when a local CVM becomes unavailable, the I/Os are then transparently handled by other CVMs in the cluster. The hypervisor and CVM communicate using a private 192.168.5.0 network on a dedicated vSwitch (more on this above). This means that for all storage I/Os, these are happening to the internal IP addresses on the CVM (192.168.5.2). The external IP address of the CVM is used for remote replication and for CVM communication.
The following figure shows an example of what this looks like:
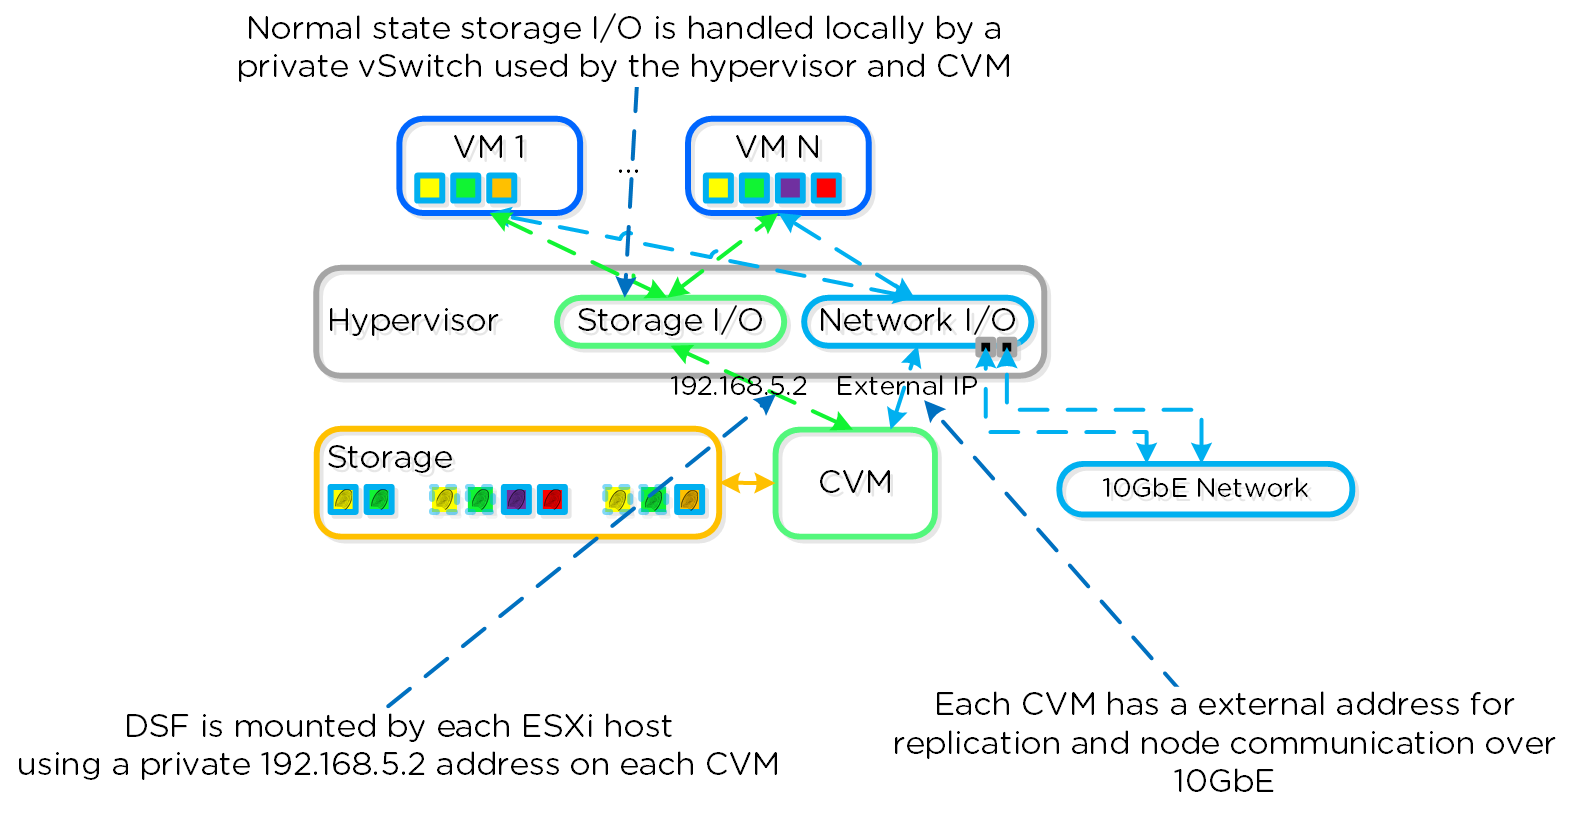 ESXi Host Networking
In the event of a local CVM failure, the local 192.168.5.2 addresses previously hosted by the local CVM are unavailable. DSF will automatically detect this outage and will redirect these I/Os to another CVM in the cluster over 10GbE. The re-routing is done transparently to the hypervisor and VMs running on the host. This means that even if a CVM is powered down, the VMs will still continue to be able to perform I/Os to DSF. Once the local CVM is back up and available, traffic will then seamlessly be transferred back and served by the local CVM.
The following figure shows a graphical representation of how this looks for a failed CVM:
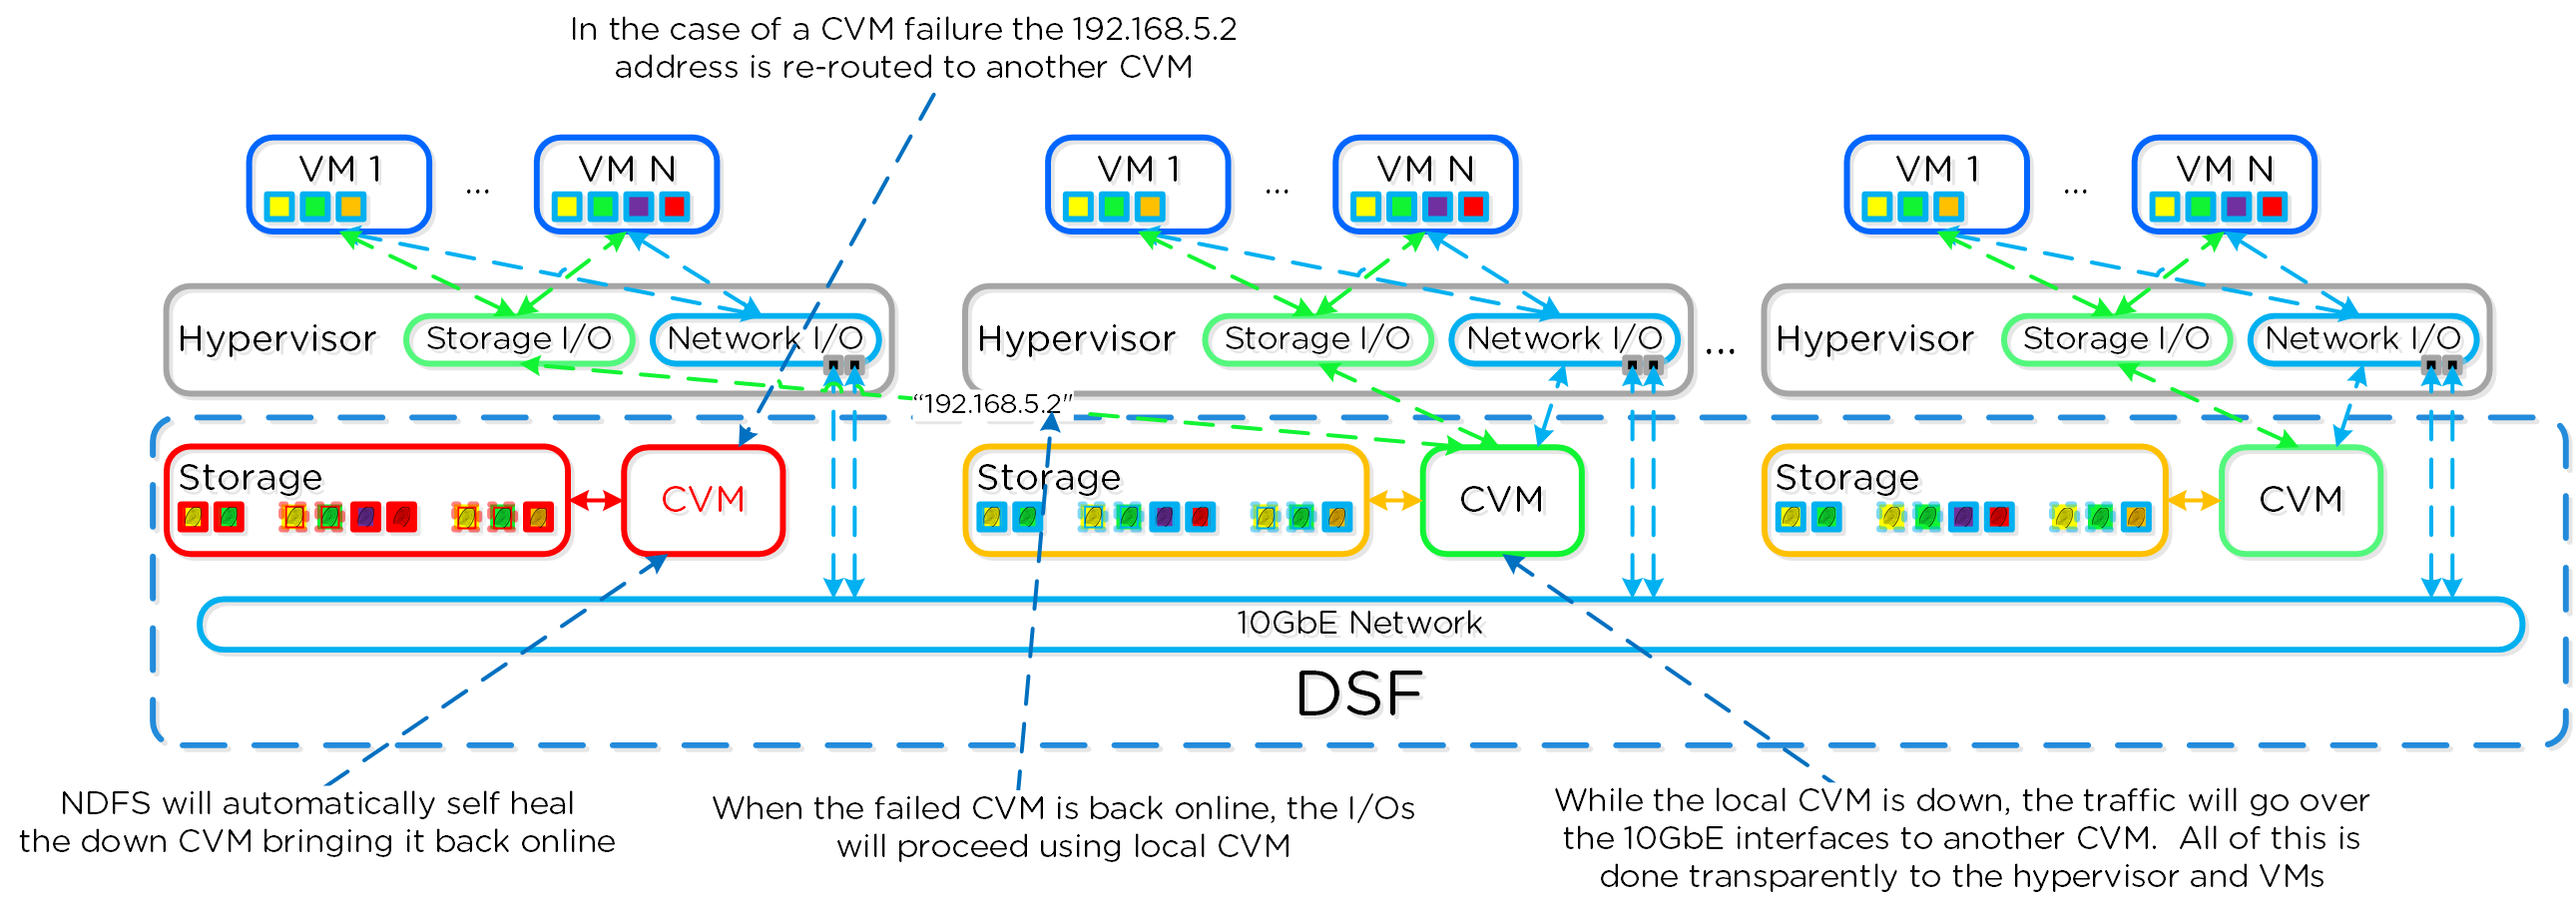 ESXi Host Networking - Local CVM Down
» Download this section as PDF (opens in a new tab/window)
VM Management
Core VM management operations can be done directly from Prism without using any hypervisor management interface. Once your Nutanix nodes are added to your vCenter instance and your vCenter Server is registered with your Nutanix cluster (Settings > vCenter Registration), you can perform the following operations directly through Prism:
- Creating, cloning, updating, and deleting VMs
- Creating and deleting NICs
- Attaching and deleting disks
- VM Power operations (on/off, reset, suspend, resume, guest shutdown, guest restart)
- Launch VM console
- Manage VM guest tools (VMware or Nutanix Guest Tools)
Command Reference
ESXi cluster upgrade
Description: Perform an automated upgrade of ESXi hosts using the CLI and custom offline bundle
- Upload upgrade offline bundle to a Nutanix CVM
- Log in to Nutanix CVM
- Perform upgrade
cluster --md5sum=bundle_checksum --bundle=/path/to/offline_bundle host_upgrade
Example
cluster --md5sum=bff0b5558ad226ad395f6a4dc2b28597 --bundle=/tmp/VMware-ESXi-5.5.0-1331820-depot.zip host_upgrade
Restart ESXi host services
Description: Restart each ESXi hosts services in a incremental manner
for i in `hostips`;do ssh root@$i "services.sh restart";done
Display ESXi host nics in ‘Up’ state
Description: Display the ESXi host’s nics which are in a ‘Up’ state
for i in `hostips`;do echo $i && ssh root@$i esxcfg-nics -l | grep Up;done
Display ESXi host 10GbE nics and status
Description: Display the ESXi host’s 10GbE nics and status
for i in `hostips`;do echo $i && ssh root@$i esxcfg-nics -l | grep ixgbe;done
Display ESXi host active adapters
Description: Display the ESXi host’s active, standby and unused adapters
for i in `hostips`;do echo $i && ssh root@$i "esxcli network vswitch standard policy failover get --vswitch-name vSwitch0";done
Display ESXi host routing tables
Description: Display the ESXi host’s routing tables
for i in `hostips`;do ssh root@$i 'esxcfg-route -l';done
Check if VAAI is enabled on datastore
Description: Check whether or not VAAI is enabled/supported for a datastore
vmkfstools -Ph /vmfs/volumes/Datastore Name
Set VIB acceptance level to community supported
Description: Set the vib acceptance level to CommunitySupported allowing for 3rd party vibs to be installed
esxcli software acceptance set --level CommunitySupported
Install VIB
Description: Install a vib without checking the signature
esxcli software vib install --viburl=/VIB directory/VIB name --no-sig-check
OR
esxcli software vib install --depoturl=/VIB directory/VIB name --no-sig-check
Check ESXi ramdisk space
Description: Check free space of ESXi ramdisk
for i in `hostips`;do echo $i; ssh root@$i 'vdf -h';done
Clear pynfs logs
Description: Clears the pynfs logs on each ESXi host
for i in `hostips`;do echo $i; ssh root@$i '> /pynfs/pynfs.log';done
Hyper-VLearn how Microsoft Hyper-V works on Nutanix.
» Download this section as PDF (opens in a new tab/window)
When a Nutanix Hyper-V cluster is created we automatically join the Hyper-V hosts to the specified Windows Active Directory domain. These hosts are then put into a failover cluster for VM HA. When this is complete there will be AD objects for each individual Hyper-V host and the failover cluster.
Node Architecture
In Hyper-V deployments, the Controller VM (CVM) runs as a VM and disks are presented using disk passthrough.
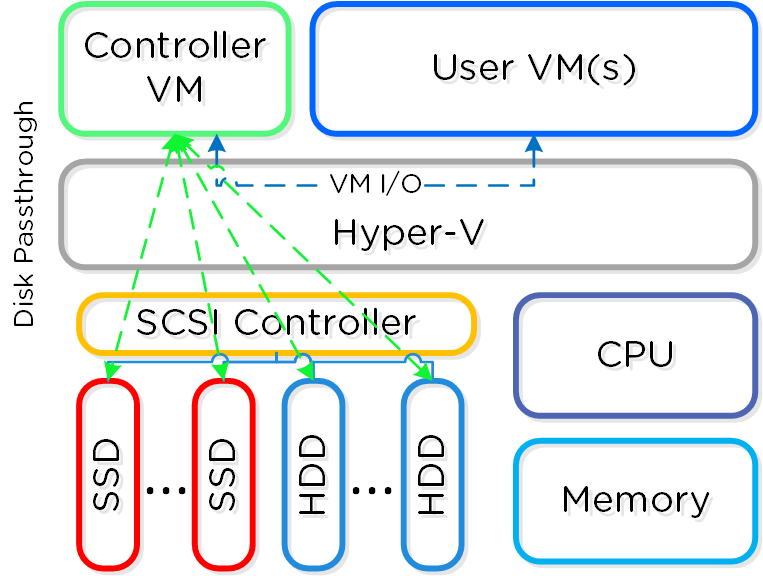 Hyper-V Node Architecture
Configuration Maximums and Scalability
The following configuration maximums and scalability limits are applicable:
- Maximum cluster size: 16
- Maximum vCPUs per VM: 64
- Maximum memory per VM: 1TB
- Maximum virtual disk size: 64TB
- Maximum VMs per host: 1,024
- Maximum VMs per cluster: 8,000
NOTE: As of Hyper-V 2012 R2 and AOS 6.6. Refer to Configuration Maximums for other versions.
Networking
Each Hyper-V host has a internal only virtual switch which is used for intra-host communication between the Nutanix CVM and host. For external communication and VMs a external virtual switch (default) or logical switch is leveraged.
The internal switch (InternalSwitch) is for local communication between the Nutanix CVM and Hyper-V host. The host has a virtual ethernet interface (vEth) on this internal switch (192.168.5.1) and the CVM has a vEth on this internal switch (192.168.5.2). This is the primary storage communication path.
The external vSwitch can be a standard virtual switch or a logical switch. This will host the external interfaces for the Hyper-V host and CVM as well as the logical and VM networks leveraged by VMs on the host. The external vEth interface is leveraged for host management, live migration, etc. The external CVM interface is used for communication to other Nutanix CVMs. As many logical and VM networks can be created as required assuming the VLANs are enabled on the trunk.
The following figure shows a conceptual diagram of the virtual switch architecture:
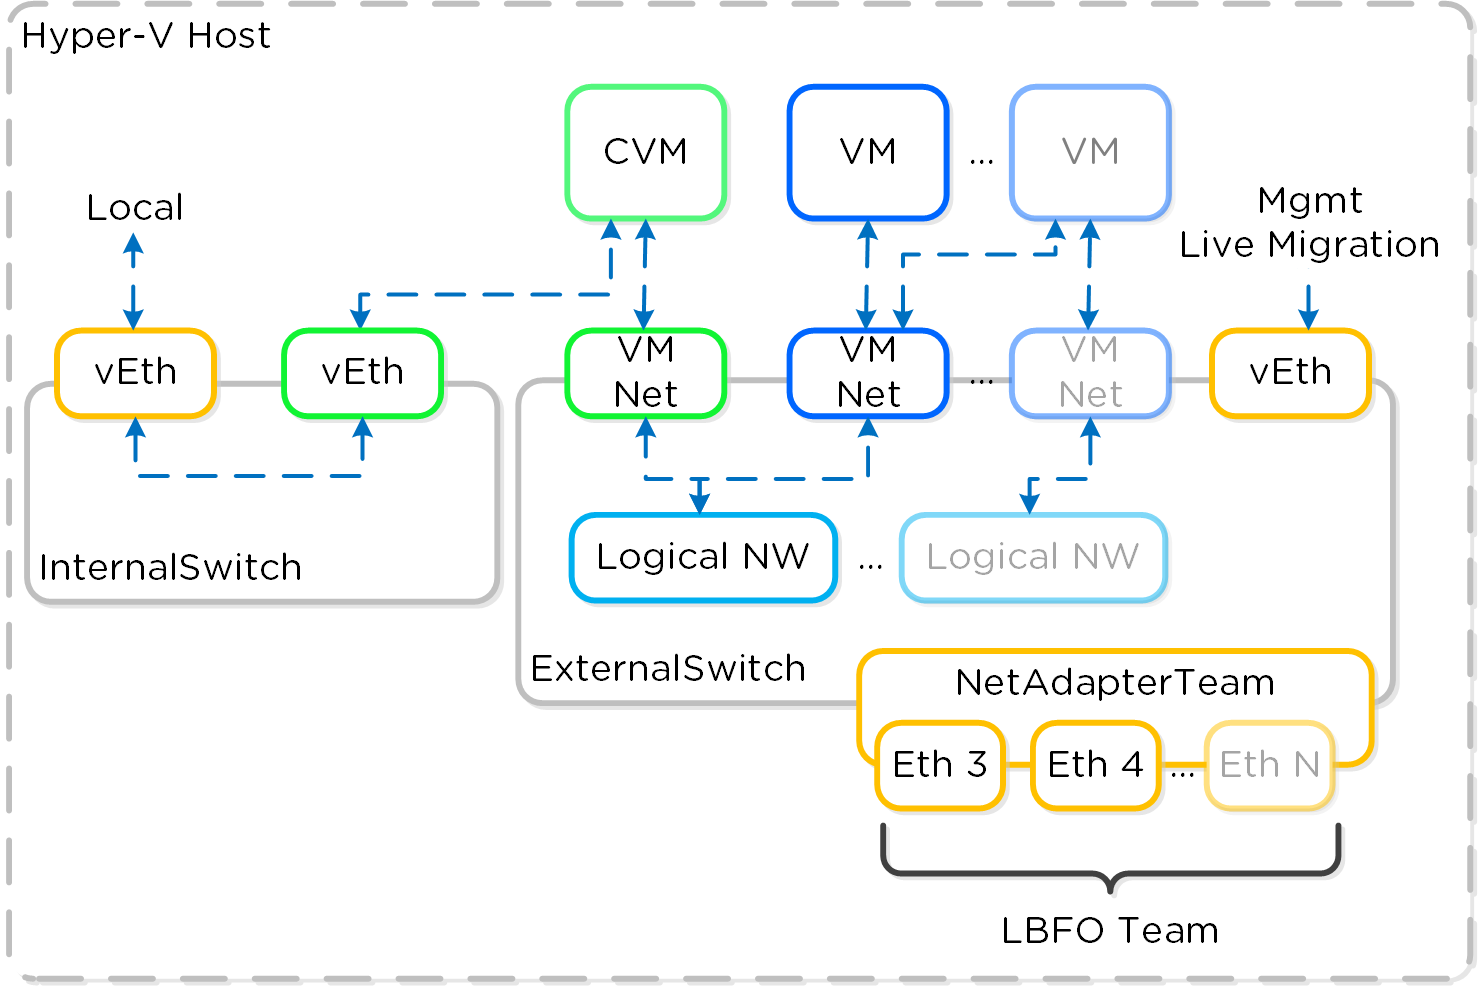 Hyper-V Virtual Switch Network Overview
Note
Uplink and Teaming policy
It is recommended to have dual ToR switches and uplinks across both switches for switch HA. By default the system will have the LBFO team in switch independent mode which doesn't require any special configuration.
» Download this section as PDF (opens in a new tab/window)
Array Offloads – ODX
The Nutanix platform supports the Microsoft Offloaded Data Transfers (ODX), which allow the hypervisor to offload certain tasks to the array. This is much more efficient as the hypervisor doesn’t need to be the ‘man in the middle’. Nutanix currently supports the ODX primitives for SMB, which include full copy and zeroing operations. However, contrary to VAAI which has a ‘fast file’ clone operation (using writable snapshots), the ODX primitives do not have an equivalent and perform a full copy. Given this, it is more efficient to rely on the native DSF clones which can currently be invoked via nCLI, REST, or PowerShell CMDlets. Currently ODX IS invoked for the following operations:
- In VM or VM to VM file copy on DSF SMB share
- SMB share file copy
Deploy the template from the SCVMM Library (DSF SMB share) – NOTE: Shares must be added to the SCVMM cluster using short names (e.g., not FQDN). An easy way to force this is to add an entry into the hosts file for the cluster (e.g. 10.10.10.10 nutanix-130).
ODX is NOT invoked for the following operations:
- Clone VM through SCVMM
- Deploy template from SCVMM Library (non-DSF SMB Share)
- XenDesktop Clone Deployment
You can validate ODX operations are taking place by using the “NFS Adapter” Activity Traces page (even though this is being performed via SMB). The operations activity show will be “NfsWorkerVaaiCopyDataOp” when copying a vDisk and “NfsWorkerVaaiWriteZerosOp” when zeroing out a disk.
» Download this section as PDF (opens in a new tab/window)
Important Pages
More coming soon!
Command Reference
Execute command on multiple remote hosts
Description: Execute a PowerShell on one or many remote hosts
$targetServers = "Host1","Host2","Etc"
Invoke-Command -ComputerName $targetServers {
Check available VMQ Offloads
Description: Display the available number of VMQ offloads for a particular host
gwmi –Namespace "root\virtualization\v2" –Class Msvm_VirtualEthernetSwitch | select elementname, MaxVMQOffloads
Disable VMQ for VMs matching a specific prefix
Description: Disable VMQ for specific VMs
$vmPrefix = "myVMs"
Get-VM | Where {$_.Name -match $vmPrefix} | Get-VMNetworkAdapter | Set-VMNetworkAdapter -VmqWeight 0
Enable VMQ for VMs matching a certain prefix
Description: Enable VMQ for specific VMs
$vmPrefix = "myVMs"
Get-VM | Where {$_.Name -match $vmPrefix} | Get-VMNetworkAdapter | Set-VMNetworkAdapter -VmqWeight 1
Power-On VMs matching a certain prefix
Description: Power-On VMs matching a certain prefix
$vmPrefix = "myVMs"
Get-VM | Where {$_.Name -match $vmPrefix -and $_.StatusString -eq "Stopped"} | Start-VM
Shutdown VMs matching a certain prefix
Description: Shutdown VMs matching a certain prefix
$vmPrefix = "myVMs"
Get-VM | Where {$_.Name -match $vmPrefix -and $_.StatusString -eq "Running"}} | Shutdown-VM -RunAsynchronously
Stop VMs matching a certain prefix
Description: Stop VMs matching a certain prefix
$vmPrefix = "myVMs"
Get-VM | Where {$_.Name -match $vmPrefix} | Stop-VM
Get Hyper-V host RSS settings
Description: Get Hyper-V host RSS (recieve side scaling) settings
Get-NetAdapterRss
Check Winsh and WinRM connectivity
Description: Check Winsh and WinRM connectivity / status by performing a sample query which should return the computer system object not an error
allssh "winsh "get-wmiobject win32_computersystem"
Metrics and Thresholds
More coming soon!
Troubleshooting & Advanced Administration
More coming soon!
Backup/DR ServicesLearn how Nutanix Disaster Recovery offers business continuity and backup.
» Download this section as PDF (opens in a new tab/window)
Note
For those who are interested in getting hands on, take it for a spin with Nutanix Test Drive!
https://www.nutanix.com/test-drive-disaster-recoveryThe Nutanix Disaster Recovery feature set provides policy driven backup, DR and run book automation services configured via Prism Central (PC). This capability builds upon and extends the native DR and replications features that have been available in AOS and configured in PE for years. For more information on the actual back-end mechanism being leveraged for replication, etc. refer to the ‘Backup and Disaster Recovery (DR)’ section in the ‘AOS’ section.
Supported Configurations
The solution is applicable to the configurations below (list may be incomplete, refer to documentation for a fully supported list):
Core Use Case(s):
- Policy based backups and replication
- DR run book automation
- DRaaS (Managed Service Providers)
Management interfaces(s):
- Prism Central (PC)
Supported Environment(s):
- On-Prem:
- AHV
- ESXi
- Cloud:
- NC2 (AWS & Azure)
- MST (Pilot Light or Zero Compute)
Upgrades:
- Part of AOS
Compatible Features:
- AOS BC/DR features
Key terms
The following key terms are used throughout this section and defined in the following:
- Recovery Point Objective (RPO)
- Refers to the acceptable data loss in the event of a failure. For example, if you want an RPO of 1 hour, you’d take a snapshot every 1 hour. In the event of a restore, you’d be restoring data as of up to 1 hour ago. For synchronous replication typically an RPO of 0 is achieved.
- Recovery Time Objective (RTO)
- Recovery time objective. Refers to the period of time from failure event to restored service. For example, if a failure occurs and you need things to be back up and running in 30 minutes, you’d have an RTO of 30 minutes.
- Recovery Point
- A restoration point aka snapshot.
Implementation Constructs
Within Nutanix Disaster Recovery, there are a few key constructs:
Protection Policy
- Key Role: Backup/Replication policy for assigned categories
- Description: A protection policy defines the RPO (snapshot frequency), recovery location (remote cluster), snapshot retention (local vs. remote cluster), and associated categories. With Protection Policies everything is applied at the category level (with a default that can apply to any/all). This is different from Protection Domains where you have to select VM(s).
The following image shows the structure of the Protection Policy:
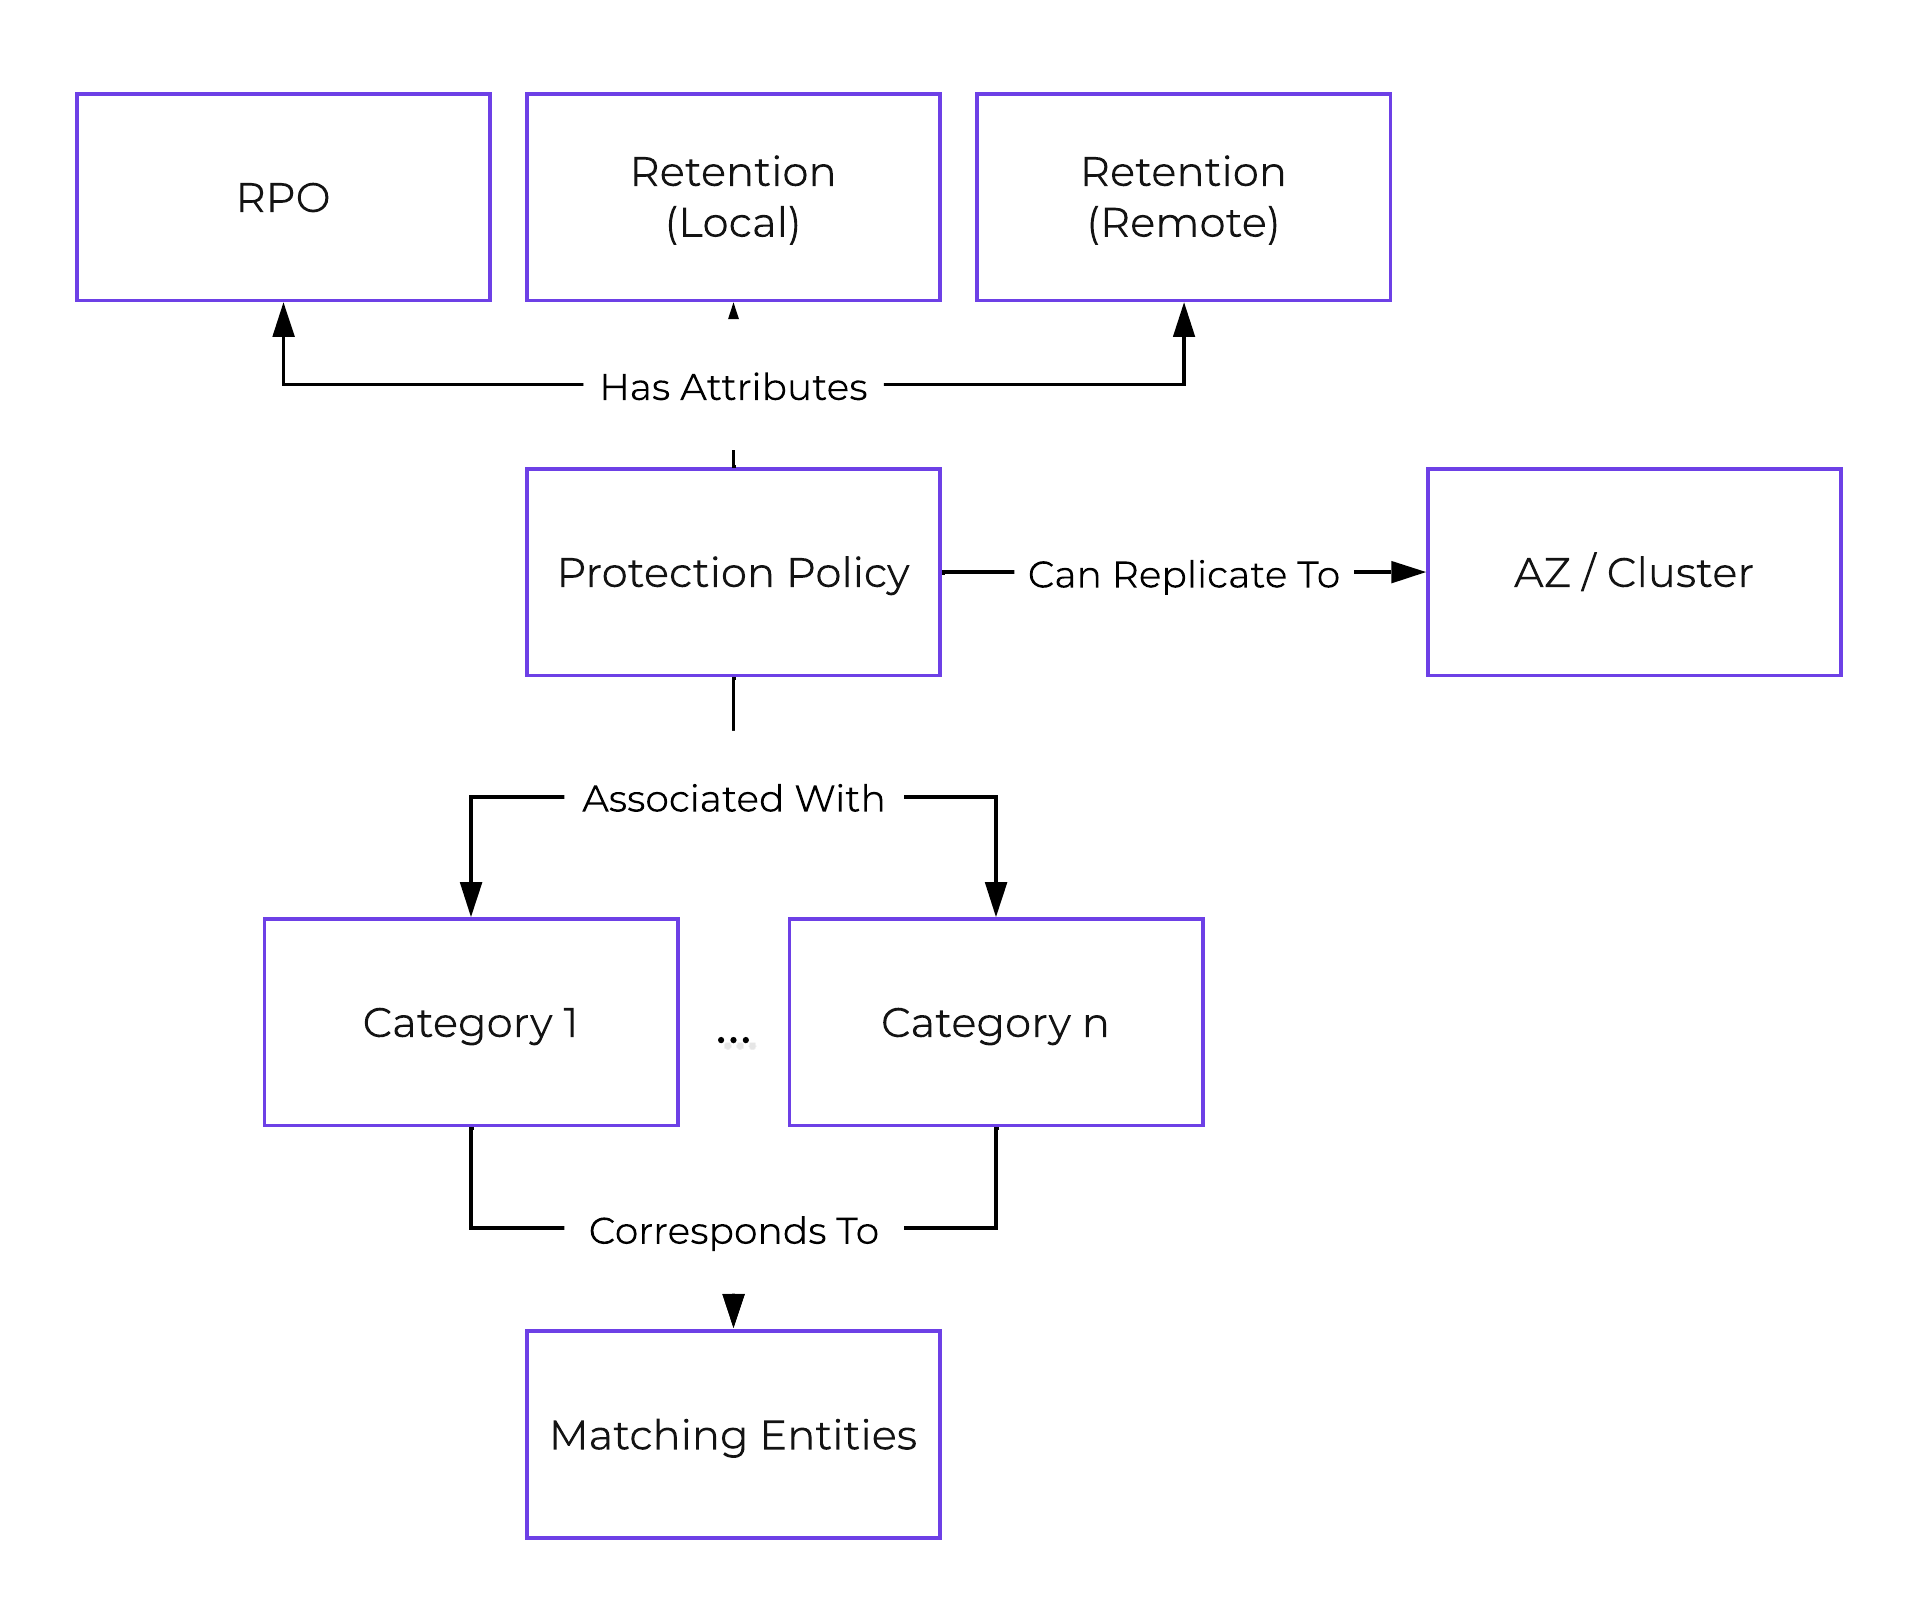 DR - Protection Policy
Recovery Plan
- Key Role: DR run book
- Description: A Recovery Plan is a run book that defines the power on sequencing (can specify categories or VMs/VGs) and network mapping (primary vs. recovery and test failover / failback). This is most synonymous with what people would leverage SRM for. NOTE: a Protection Policy must be configured before a Recovery Plan can be configured. This is necessary as the data must exist at the recovery site in order for it to be recovered.
The following image shows the structure of the Recovery Plan:
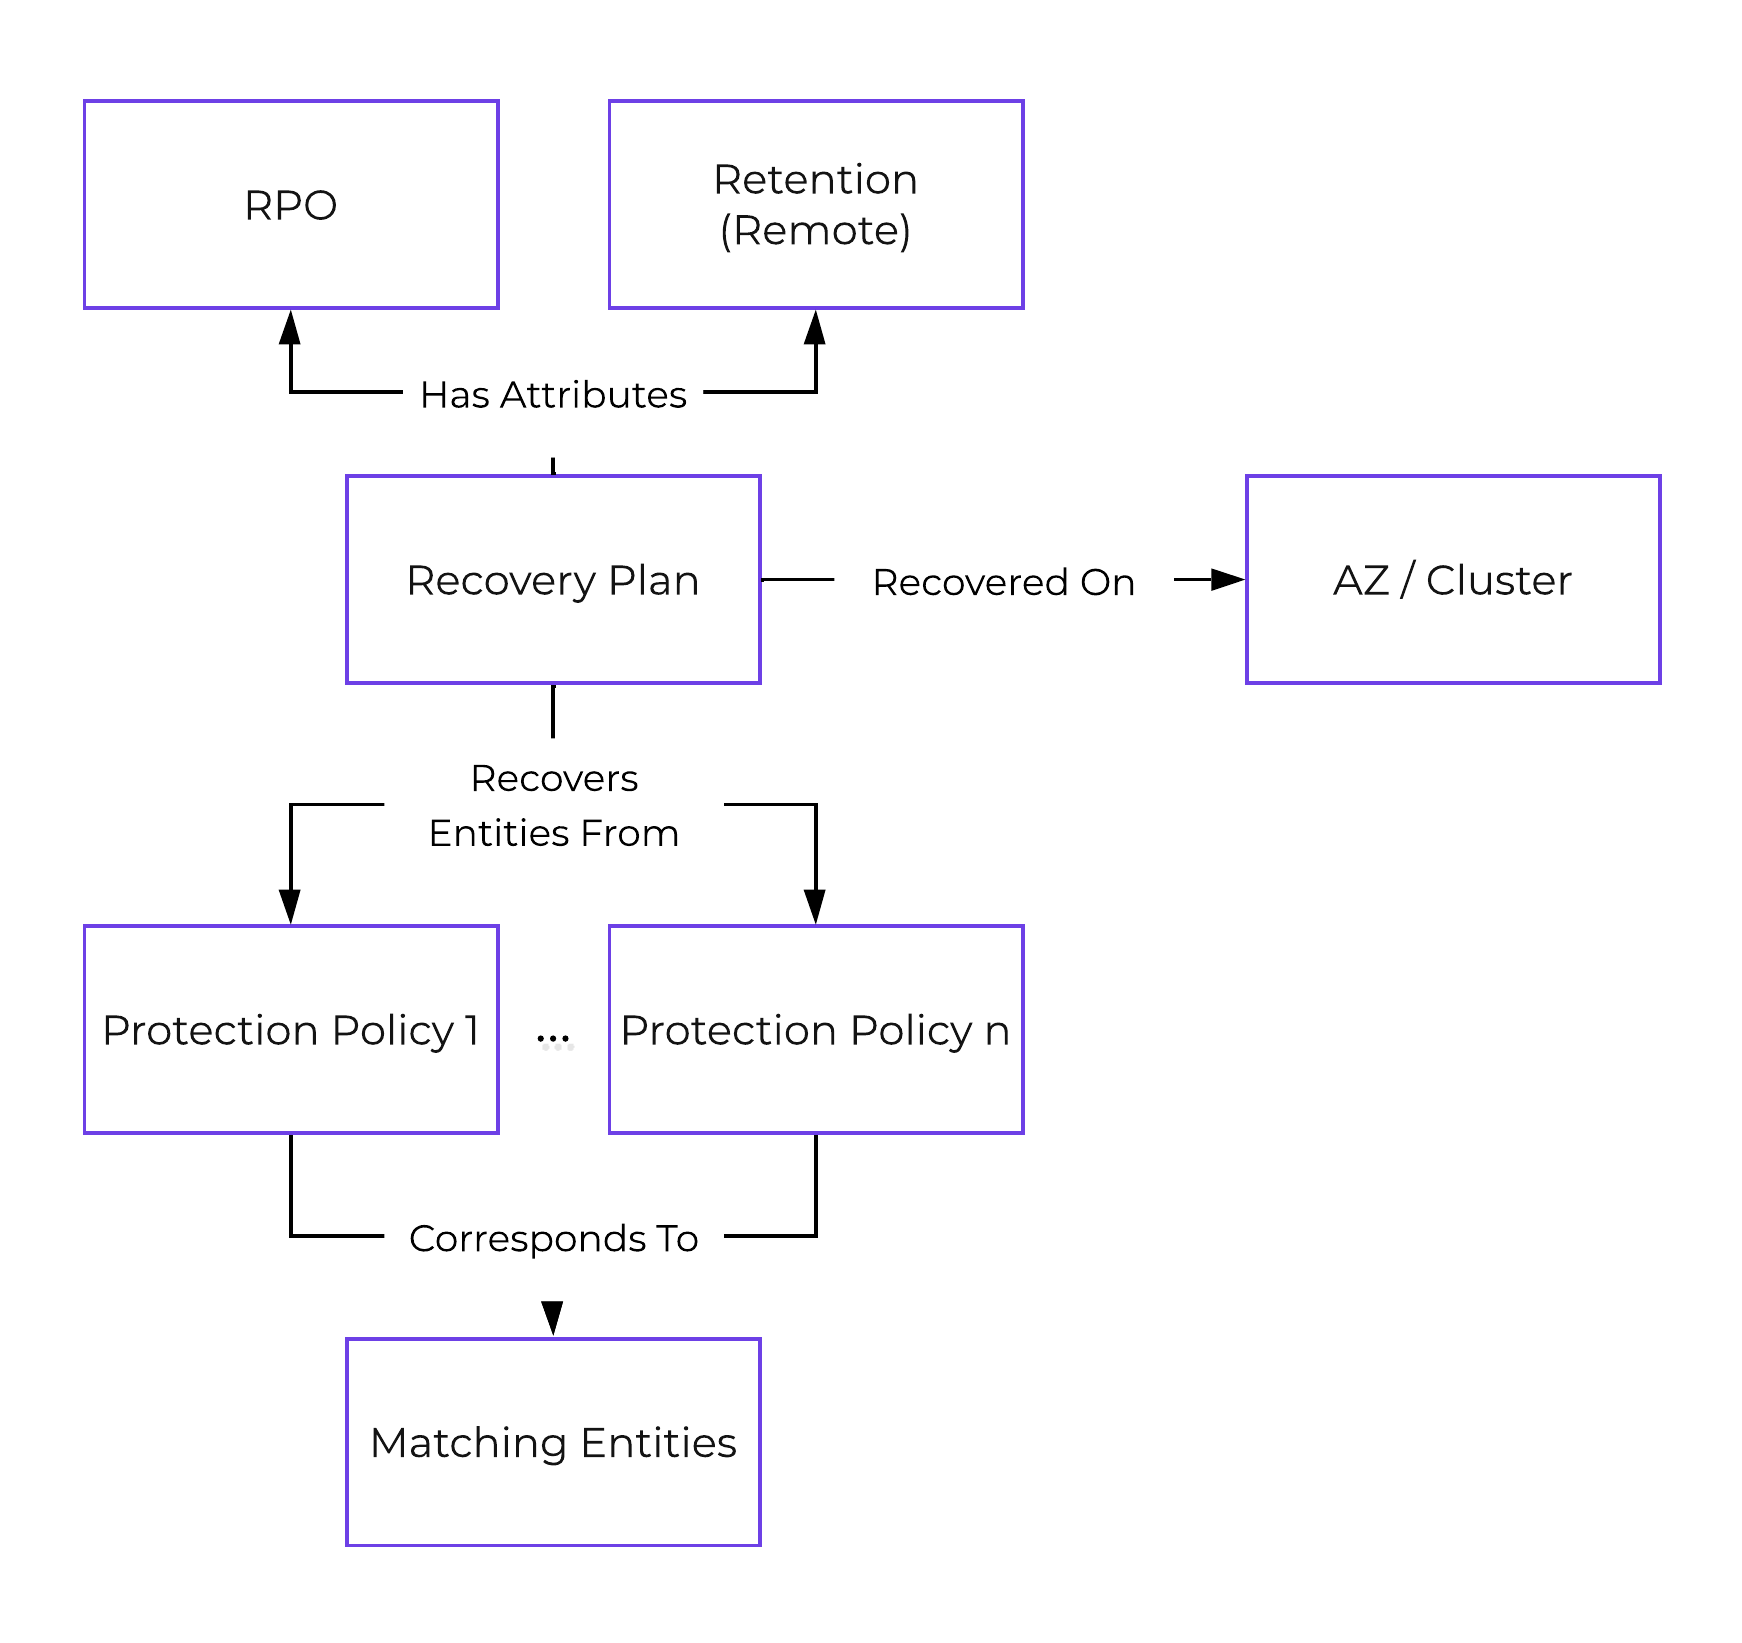 DR - Recovery Plan
Linear Retention Policy
- Key Role: Recovery Point retention policy
- Description: A linear retention policy specifies the number of recovery points to retain. For example, if the RPO is 1 hour and your retention is set to 10, you’d keep 10 hours (10 x 1 hour) of recovery points (snapshots).
Roll-up Retention Policy
- Key Role: Recovery Point retention policy
- Description: A roll-up retention policy will “roll-up” snaps dependent on the RPO and retention duration. For example, if the RPO is 1 hour and your retention is set to 5 days it’ll keep 1 day of hourly and 5 days of the latest daily recovery points. The logic can be characterized as follows: If retention is n days, keep 1 day of RPO and n days of latest daily recovery points. If retention is n weeks, keep 1 day of RPO and 1 week of daily and n latest weekly recovery points. If retention is n months, keep 1 day of RPO and 1 week of daily and 1 month of weekly and n months of monthly recovery points. If retention is n years, keep 1 day of RPO, 1 week of daily, 1 month of weekly, 1 year of monthly recovery points and n latest yearly recovery points.
Note
Linear vs. roll-up retention
Use linear policies for small RPO windows with shorter retention periods or in cases where you always need to be able to recover to a specific RPO window.
Use roll-up policies for anything with a longer retention period. They're more flexible and automatically handle snapshot aging / pruning while still providing granular RPOs for the first day.
The following shows a high-level overview of the Nutanix Disaster Recovery constructs:
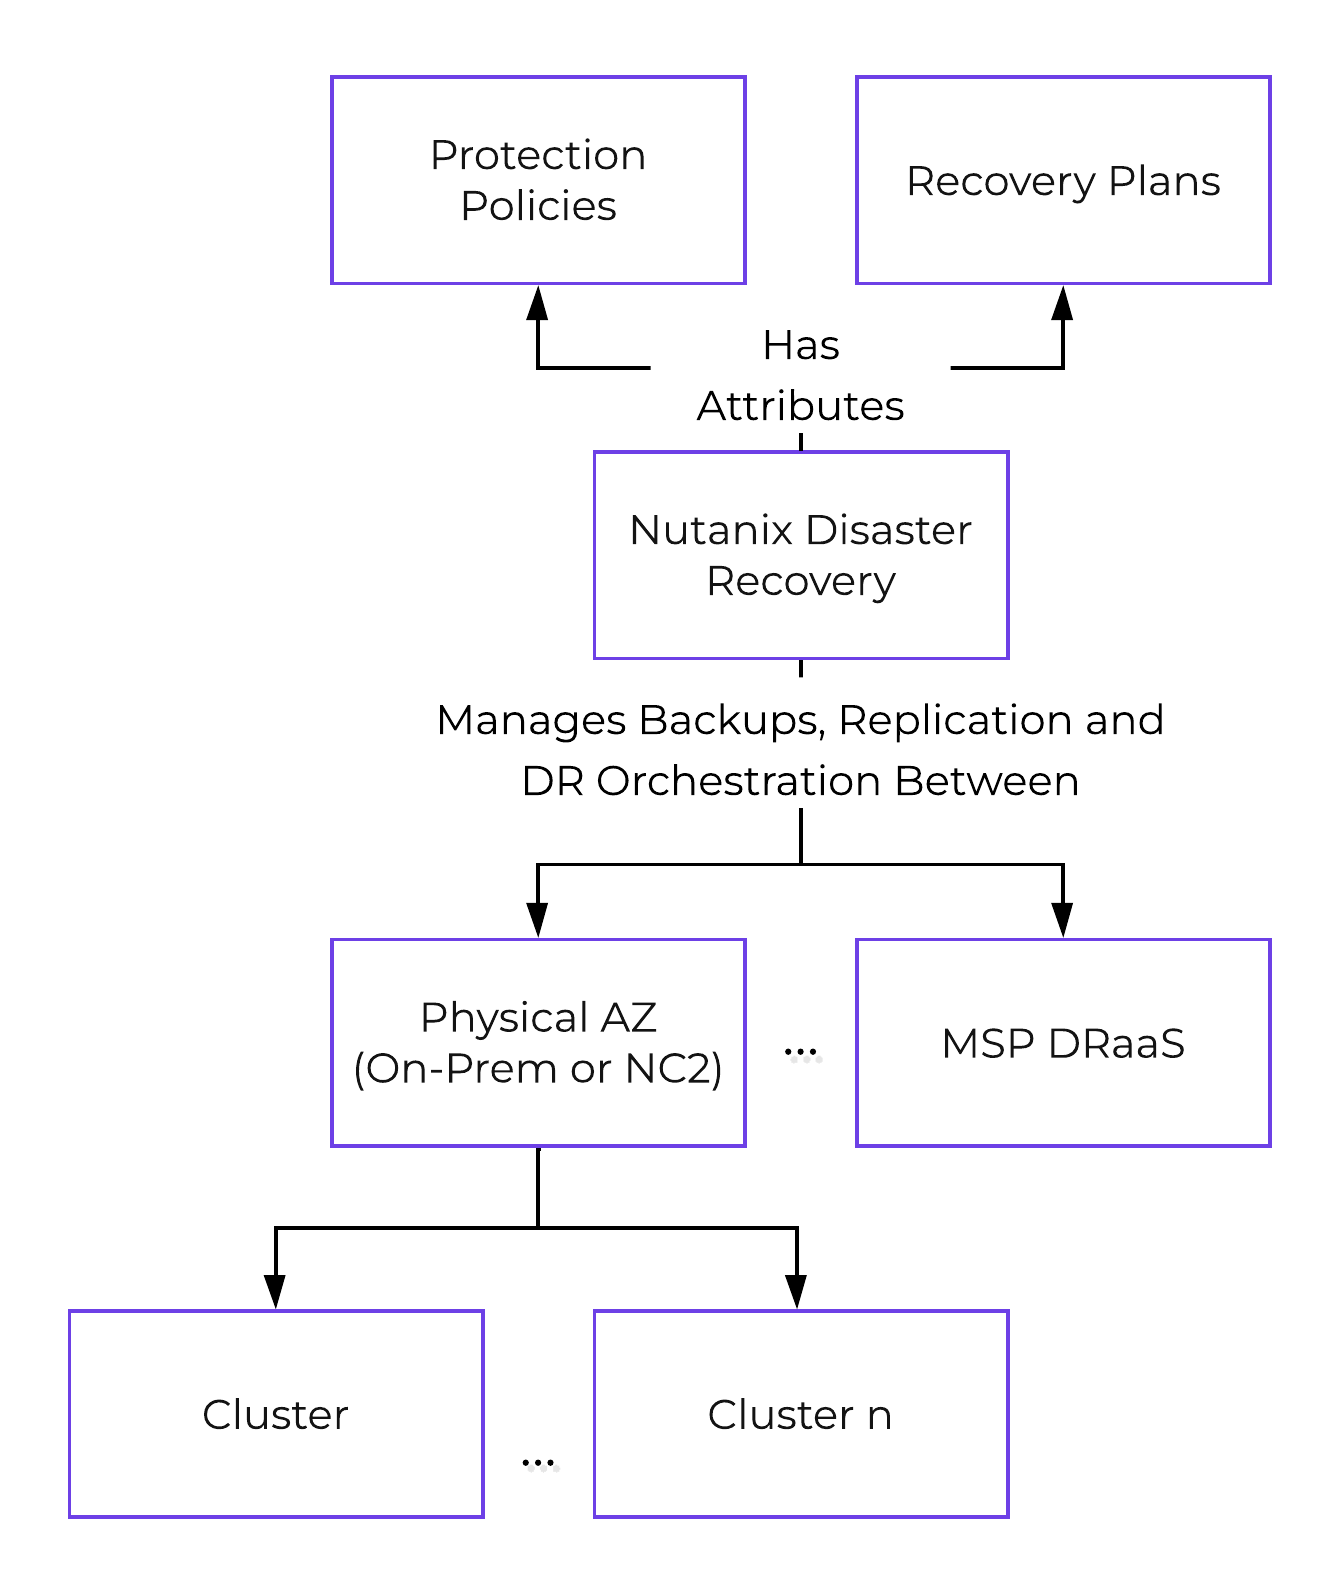 DR - Overview
Usage and Configuration
The following sections cover how to configure and leverage Nutanix Disaster Recovery.
The high-level process can be characterized into the following high-level steps:
- Connect to Availability Zones (AZs)
- Configure Protection Policies
- Configure Recovery Plan(s)
- Perform/Test Failover & Failback
Connect Availability Zone(s)
The first step is connecting to an AZ which can be a another on-premises AZ or in the cloud on NC2.
In PC, search for ‘Availability Zones’ or navigate to ‘Administration’ -> ‘Availability Zones’:
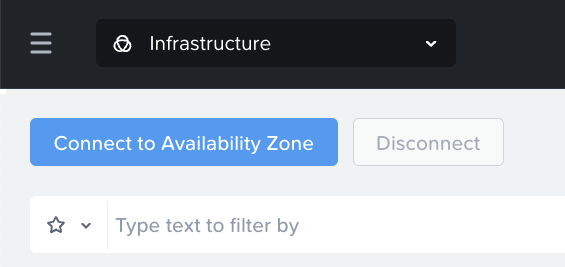 DR - Connect to Availability Zone
Click on ‘Connect to Availability Zone’ and select the AZ Type (‘Xi’ or ‘Physical Location’ aka PC instance):
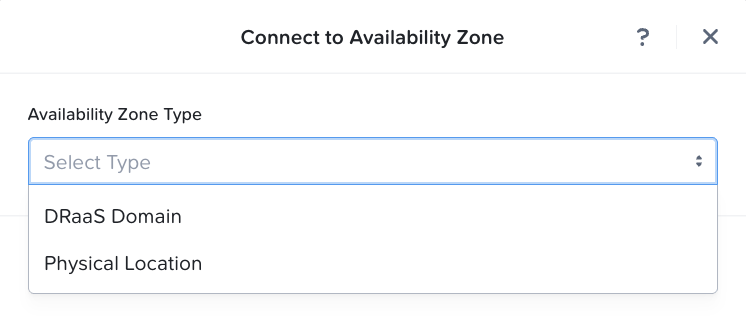 DR - Connect to Availability Zone
Input credentials for PC or Xi and click ‘Connect’:
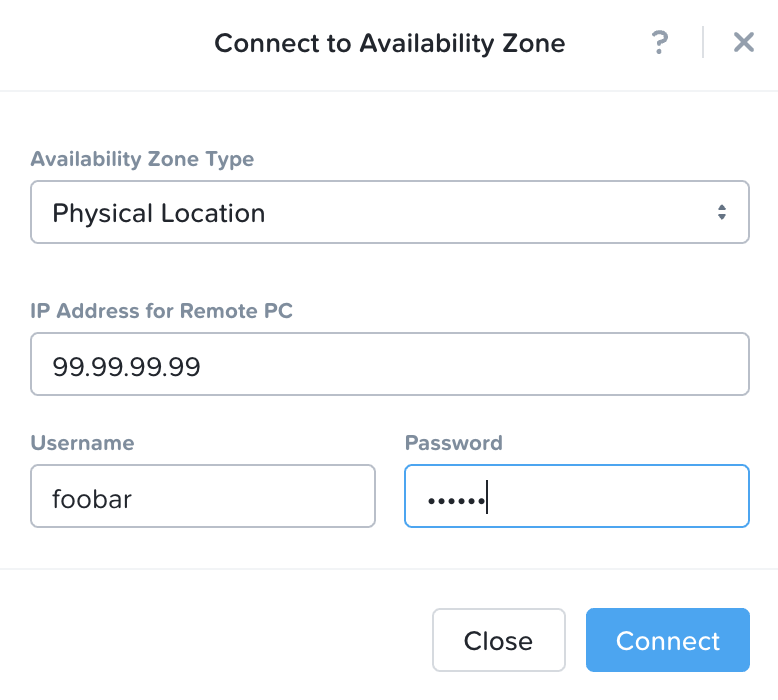 DR - Connect to Availability Zone
The connected AZ will now be displayed and be available.
Configure Protection Policies
In PC, search for ‘Protection Policies’ or navigate to ‘Policies’ -> ‘Protection Policies’:
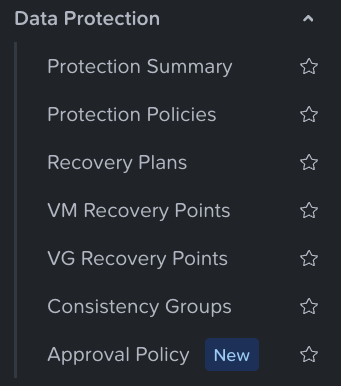 DR - Protection Policies
Click on ‘Create Protection Policy’:
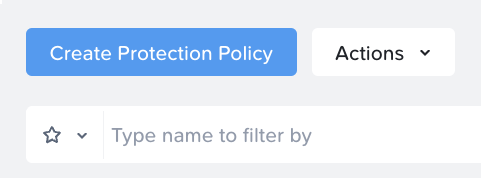 DR - Create Protection Policy
Input the desired name, and select source AZ and cluster then click save. Select recovery location AZ and cluster, then click save:
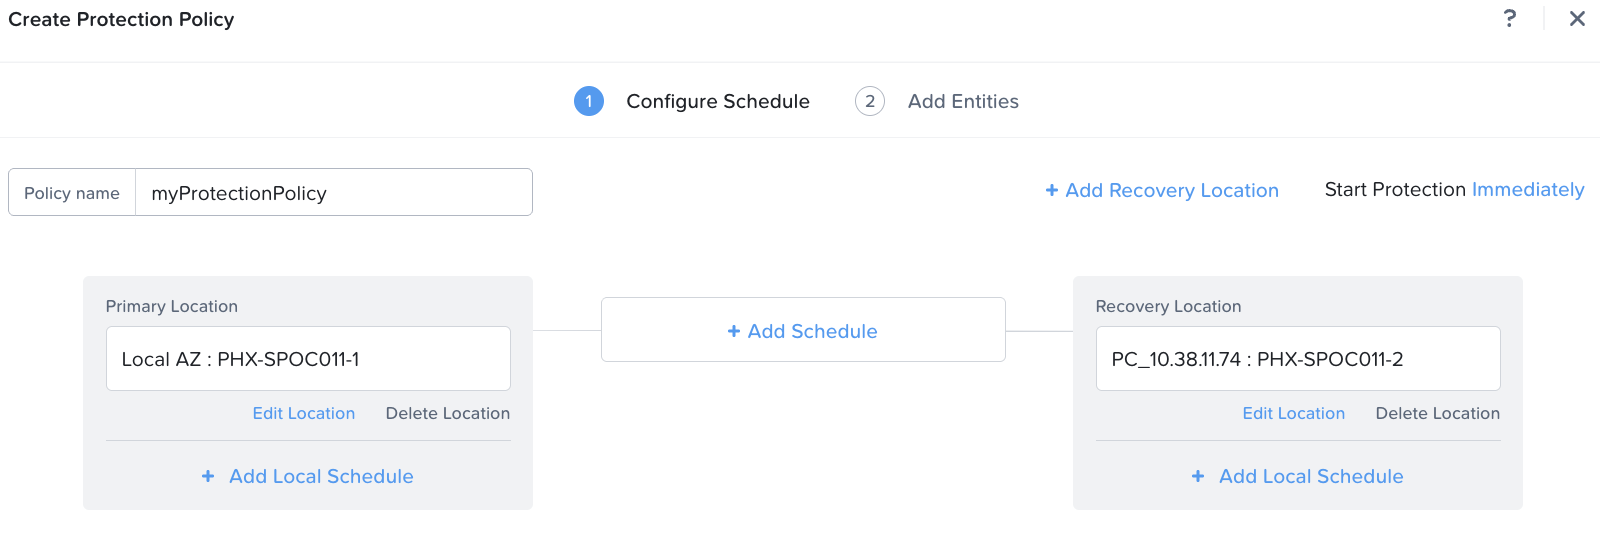 DR - Protection Policy Inputs
Click Add Schedule between the Primary and Recovery locations to add frequency of snapshots and replication, retention and other details.
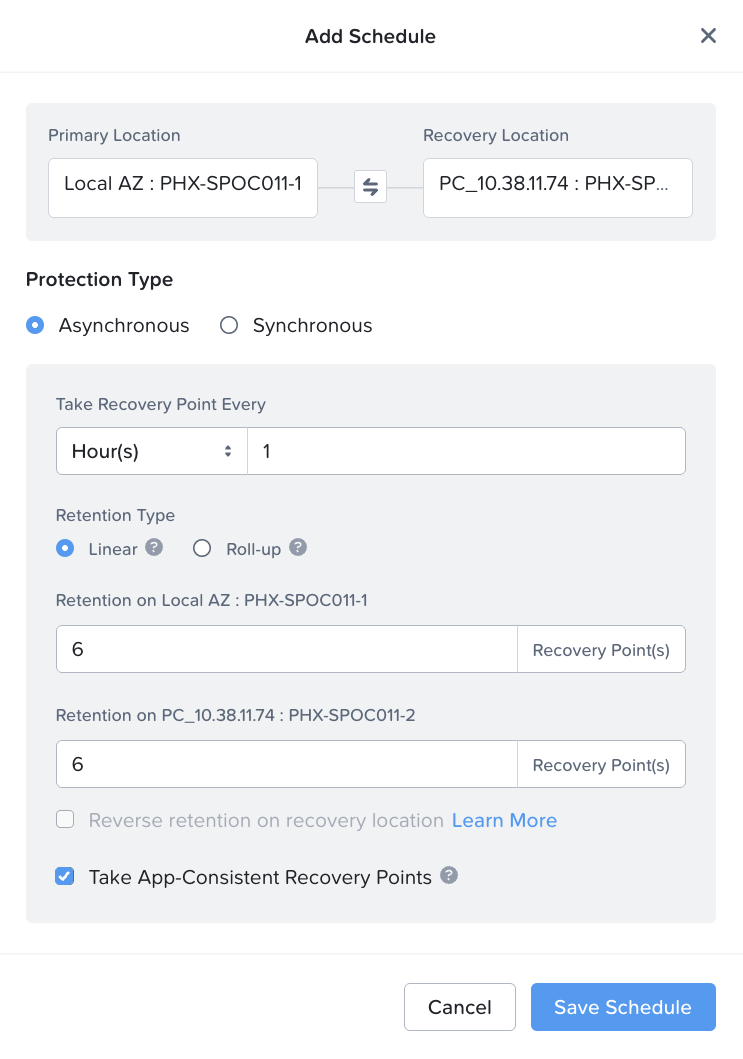 DR - Protection Policy Inputs
NOTE: for DRaaS you don’t need select a ‘Target Cluster’:
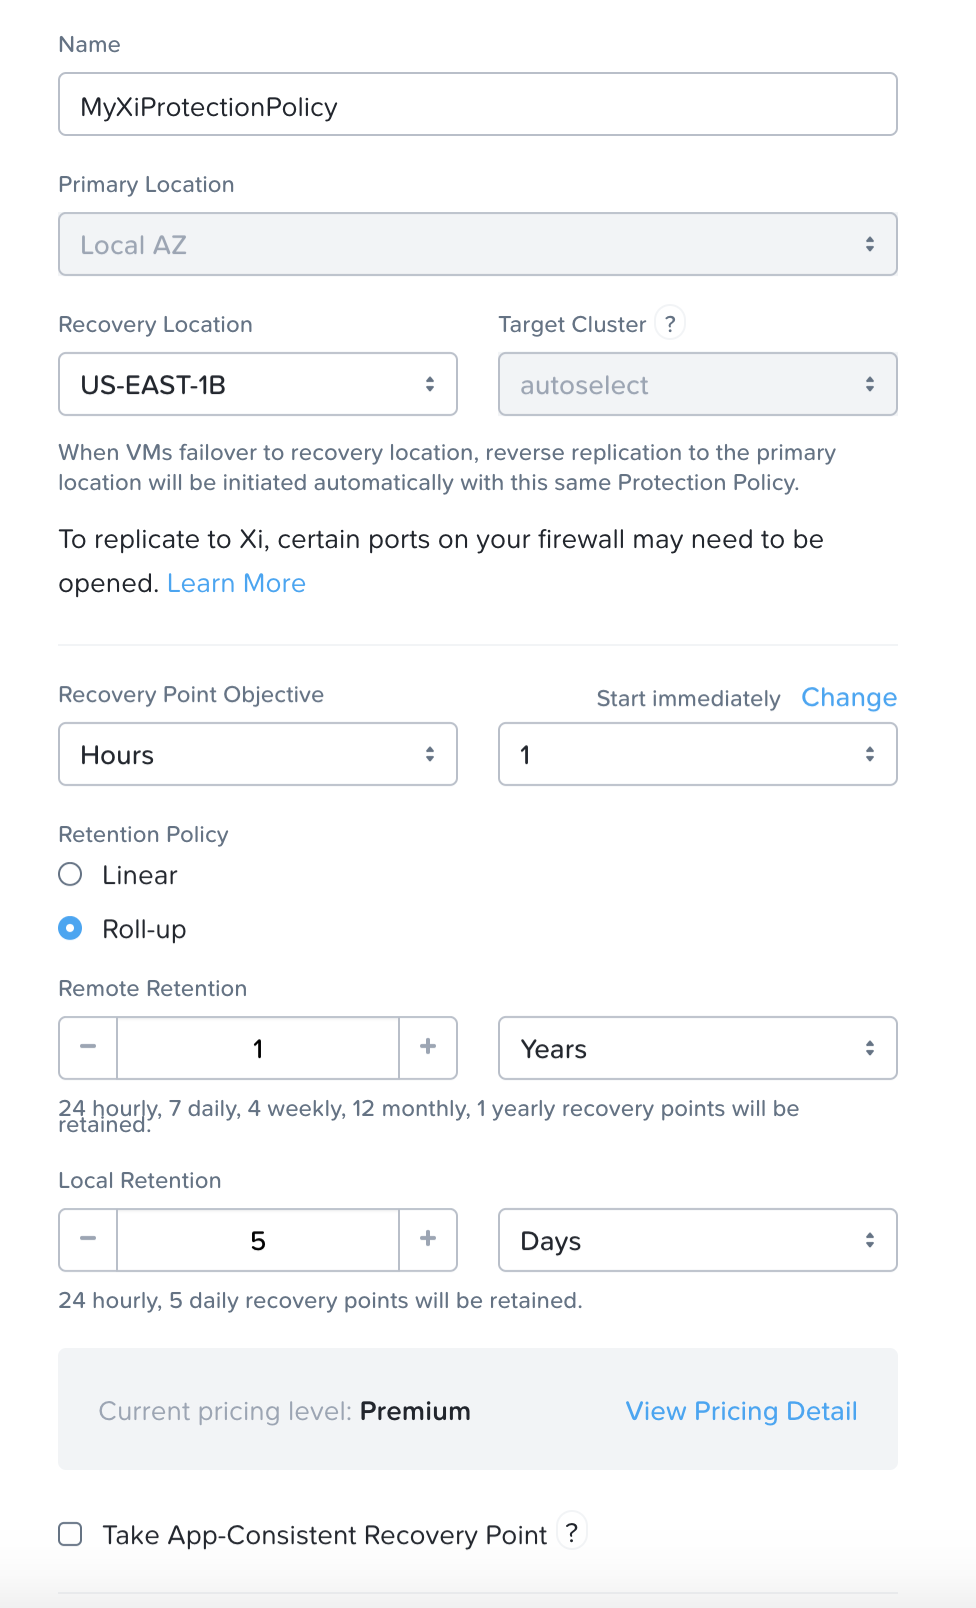 DR - Protection Policy Inputs - DRaaS
Next we’ll select the categories for the policy to apply to:
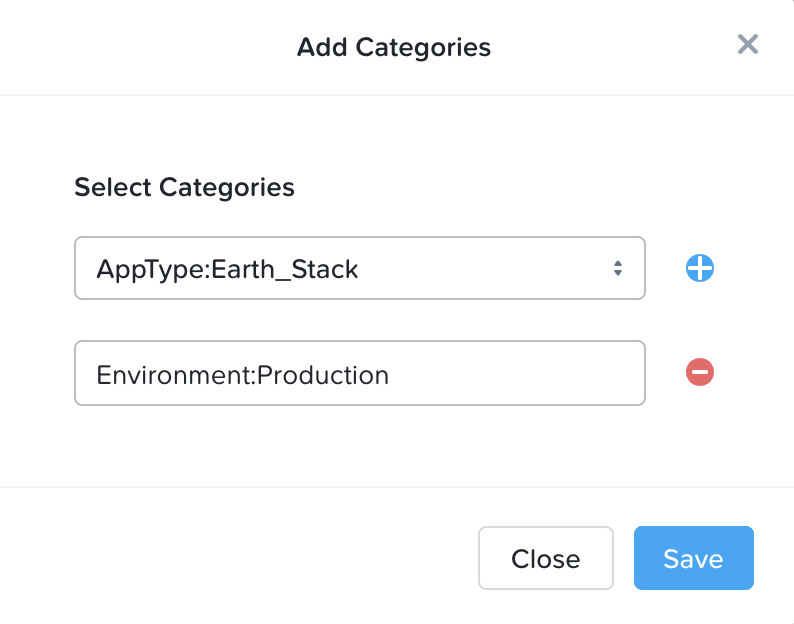 DR - Protection Policy Categories
Click ‘Save’ and you will now see the newly created Protection Policy:
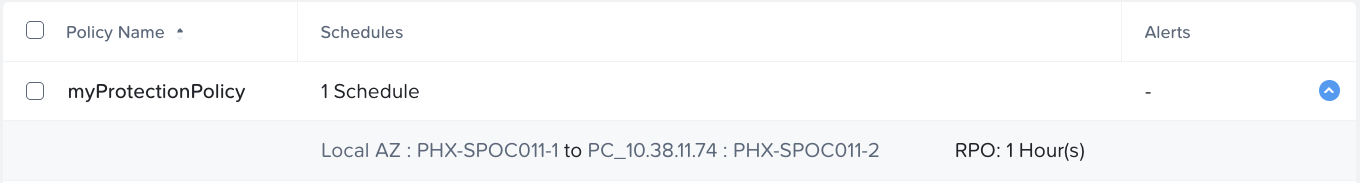 DR - Protection Policies
Configure Recovery Plans
In PC, search for ‘Recovery Plans’ or navigate to ‘Policies’ -> ‘Recovery Plans’:
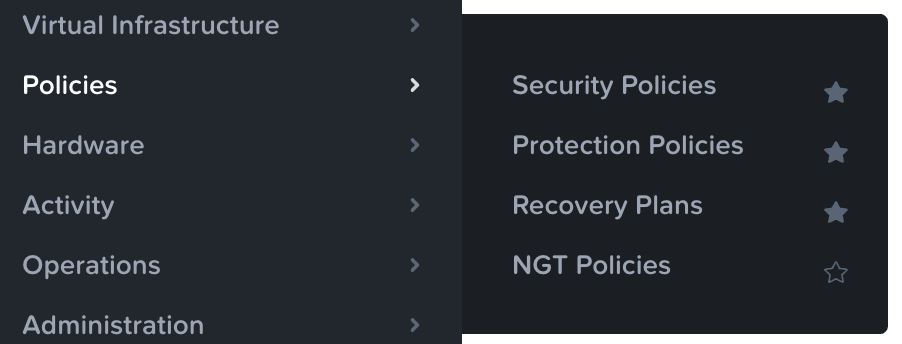 DR - Recovery Plans
On the first launch you will be greeted with a screen to create the first Recovery Plan:
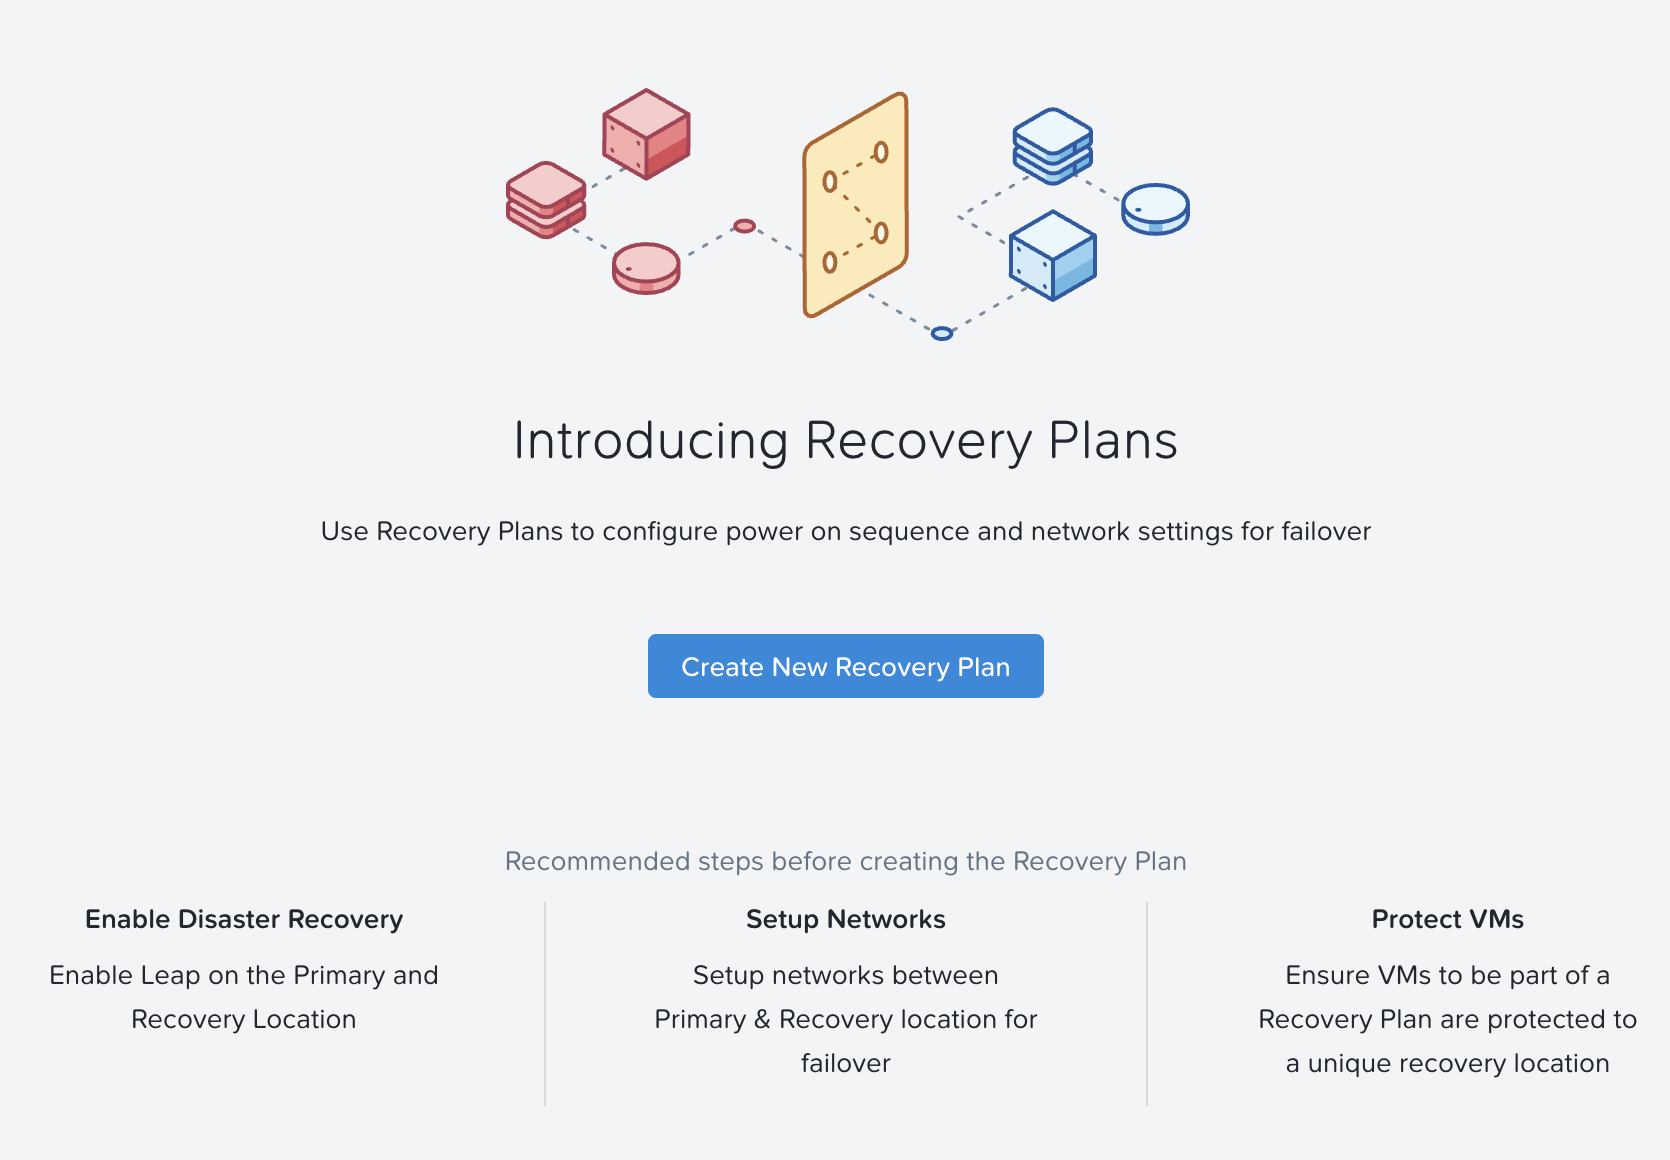 DR - Create Recovery Plan
Select the ‘Recovery Location’ using the drop down:
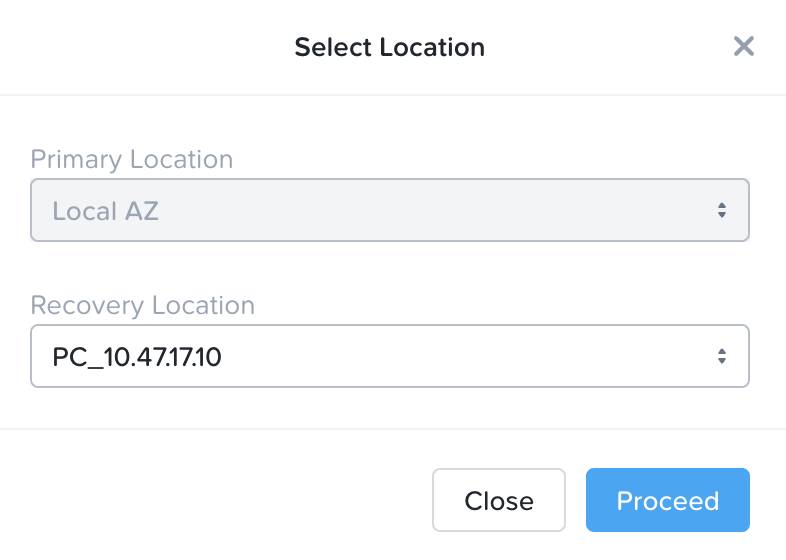 DR - Select Recovery Location
NOTE: This can be either a Xi AZ or Physical AZ (PC with corresponding managed clusters).
Input the Recovery Plan name and description and click ‘Next’:
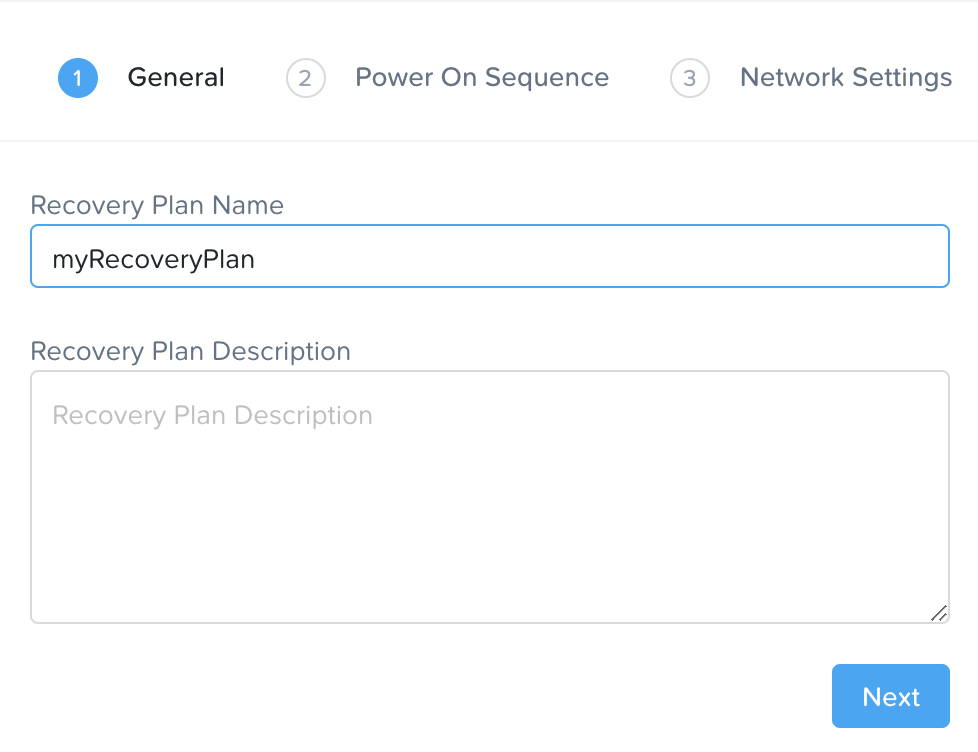 DR - Recovery Plan - Naming
Next click on ‘Add Entities’ and specify the power on sequence:
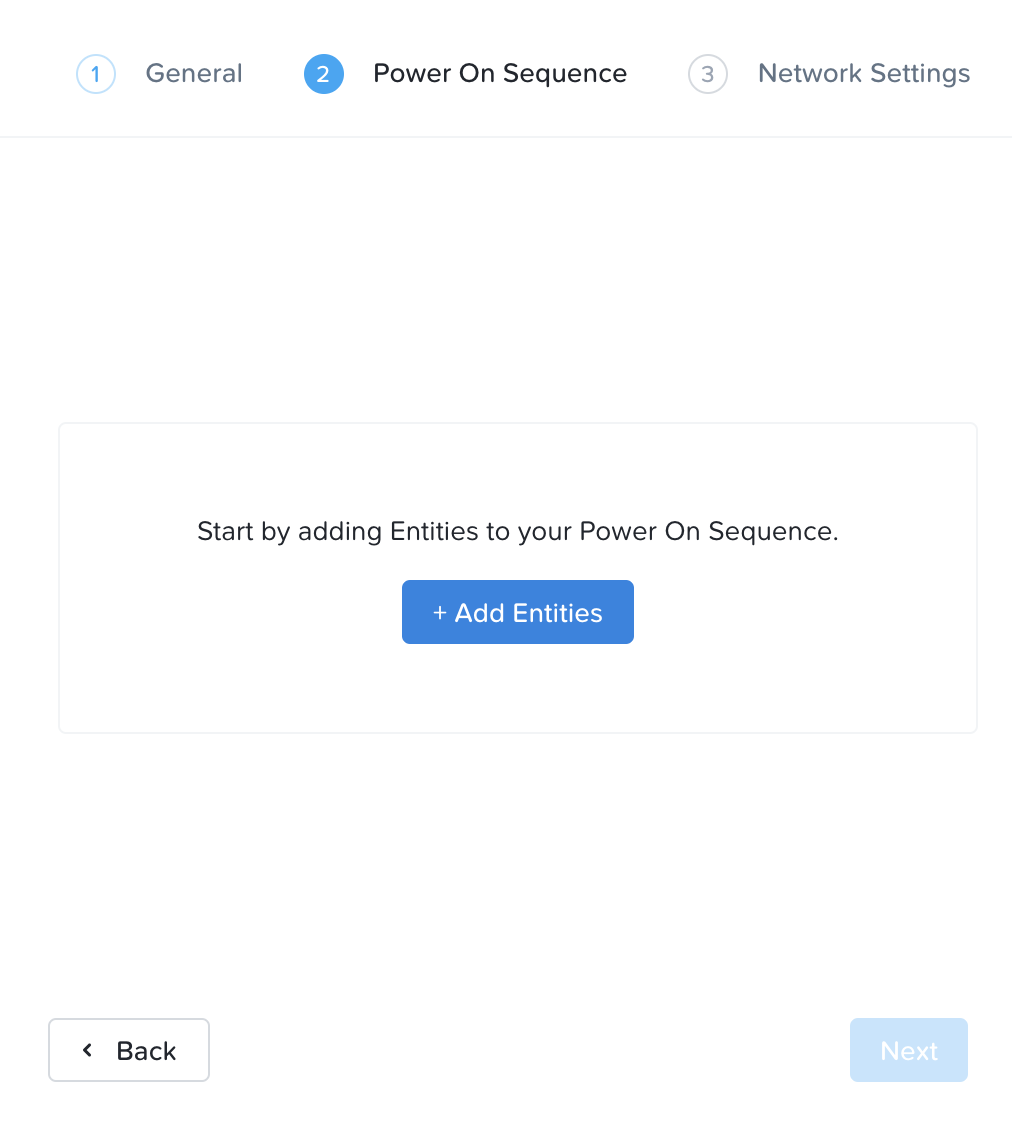 DR - Recovery Plan - Power On Sequence
Search for VMs or Categories to add to each stage:
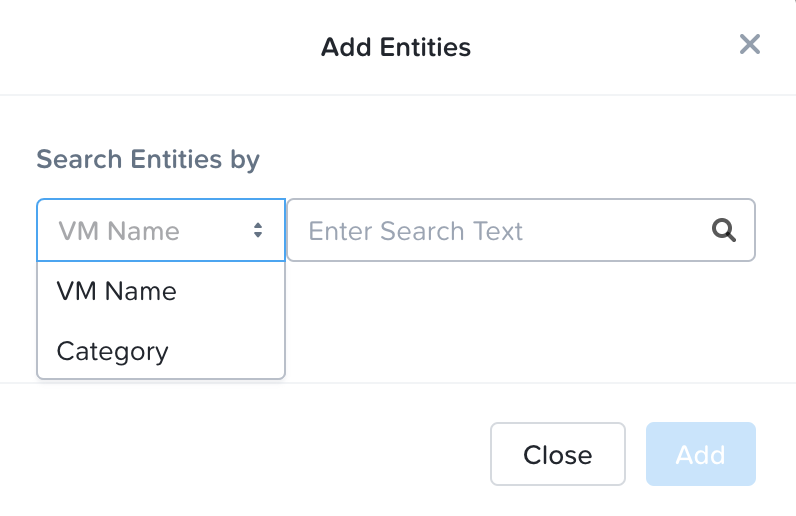 DR - Recovery Plan - Power On Sequence
Once the power on sequence looks good with the stages, click ‘Next’:
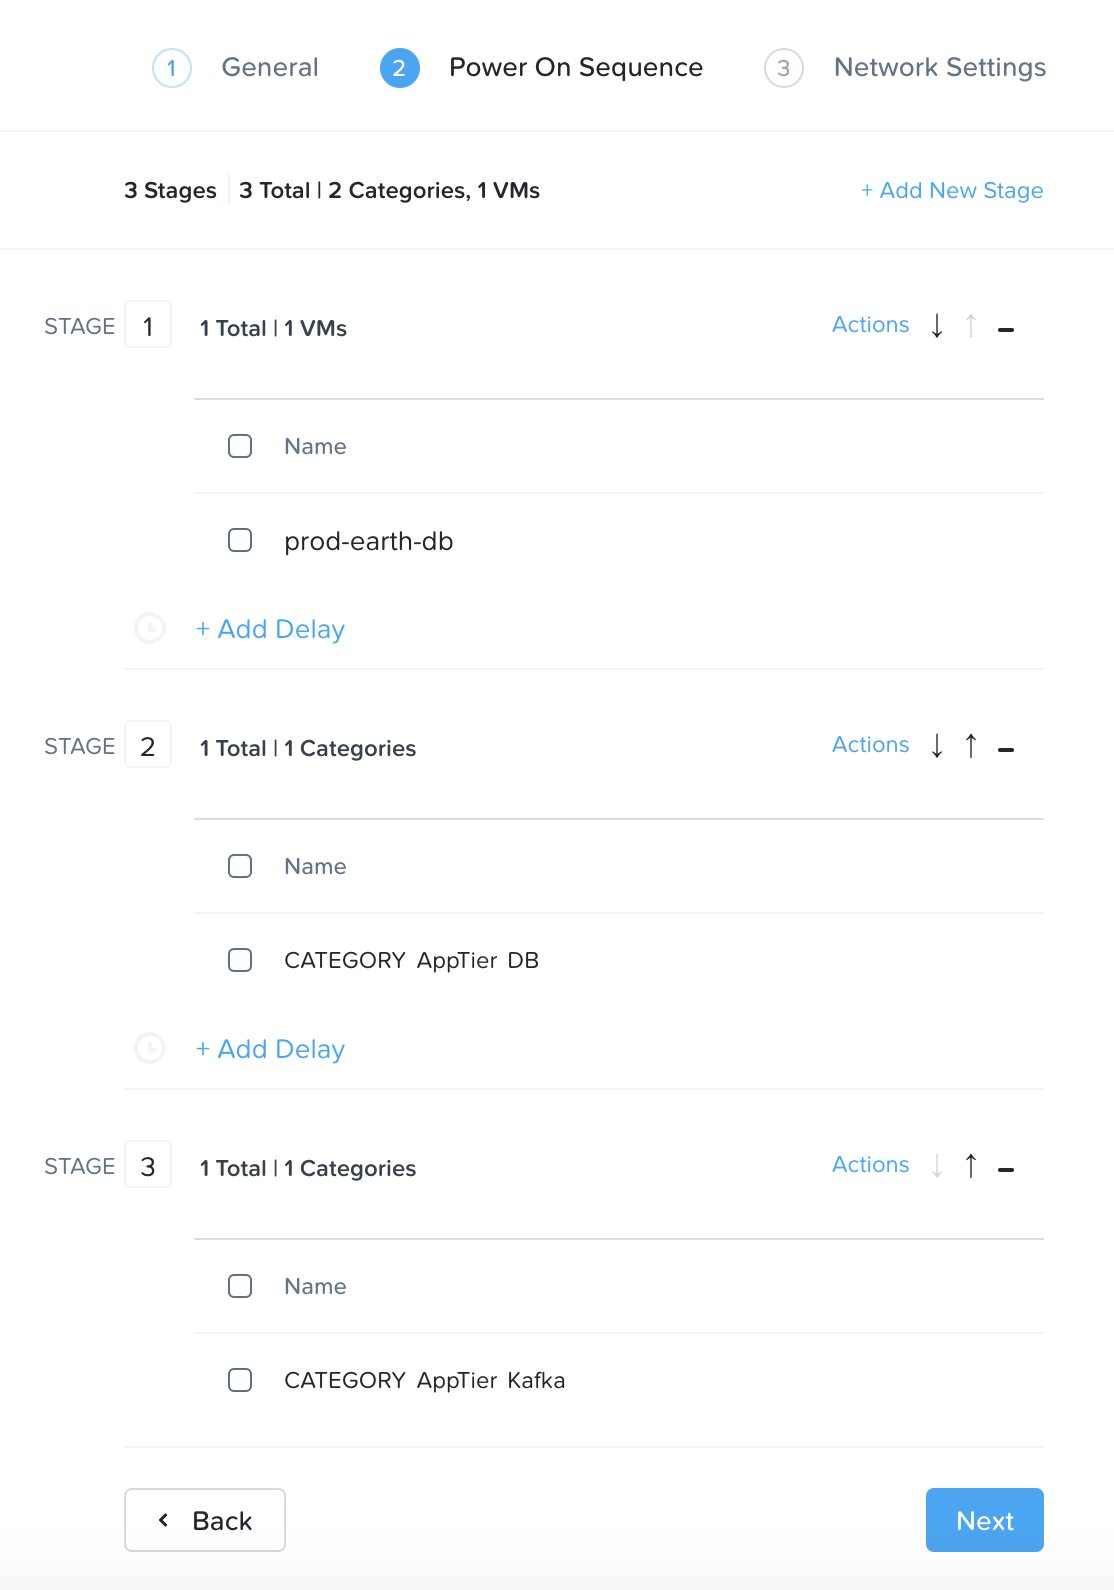 DR - Recovery Plan - Power On Sequence
Note
Power On Sequencing
When determining the power on sequence you will want to stage things as follows:
- Stage 0: Core services (AD, DNS, etc.)
- Stage 1: Services dependent on Stage 0 services, and required for Stage 2 services (e.g. DB Tier)
- Stage 2: Services dependent on Stage 1 services, and required for Stage 3 services (e.g. App Tier)
- Stage 3: Services dependent on Stage 2 services, and required for Stage 4 services (e.g. Web Tier)
- Stage 4-N: Repeat based upon dependencies
We will now map the network between our source and target environments:
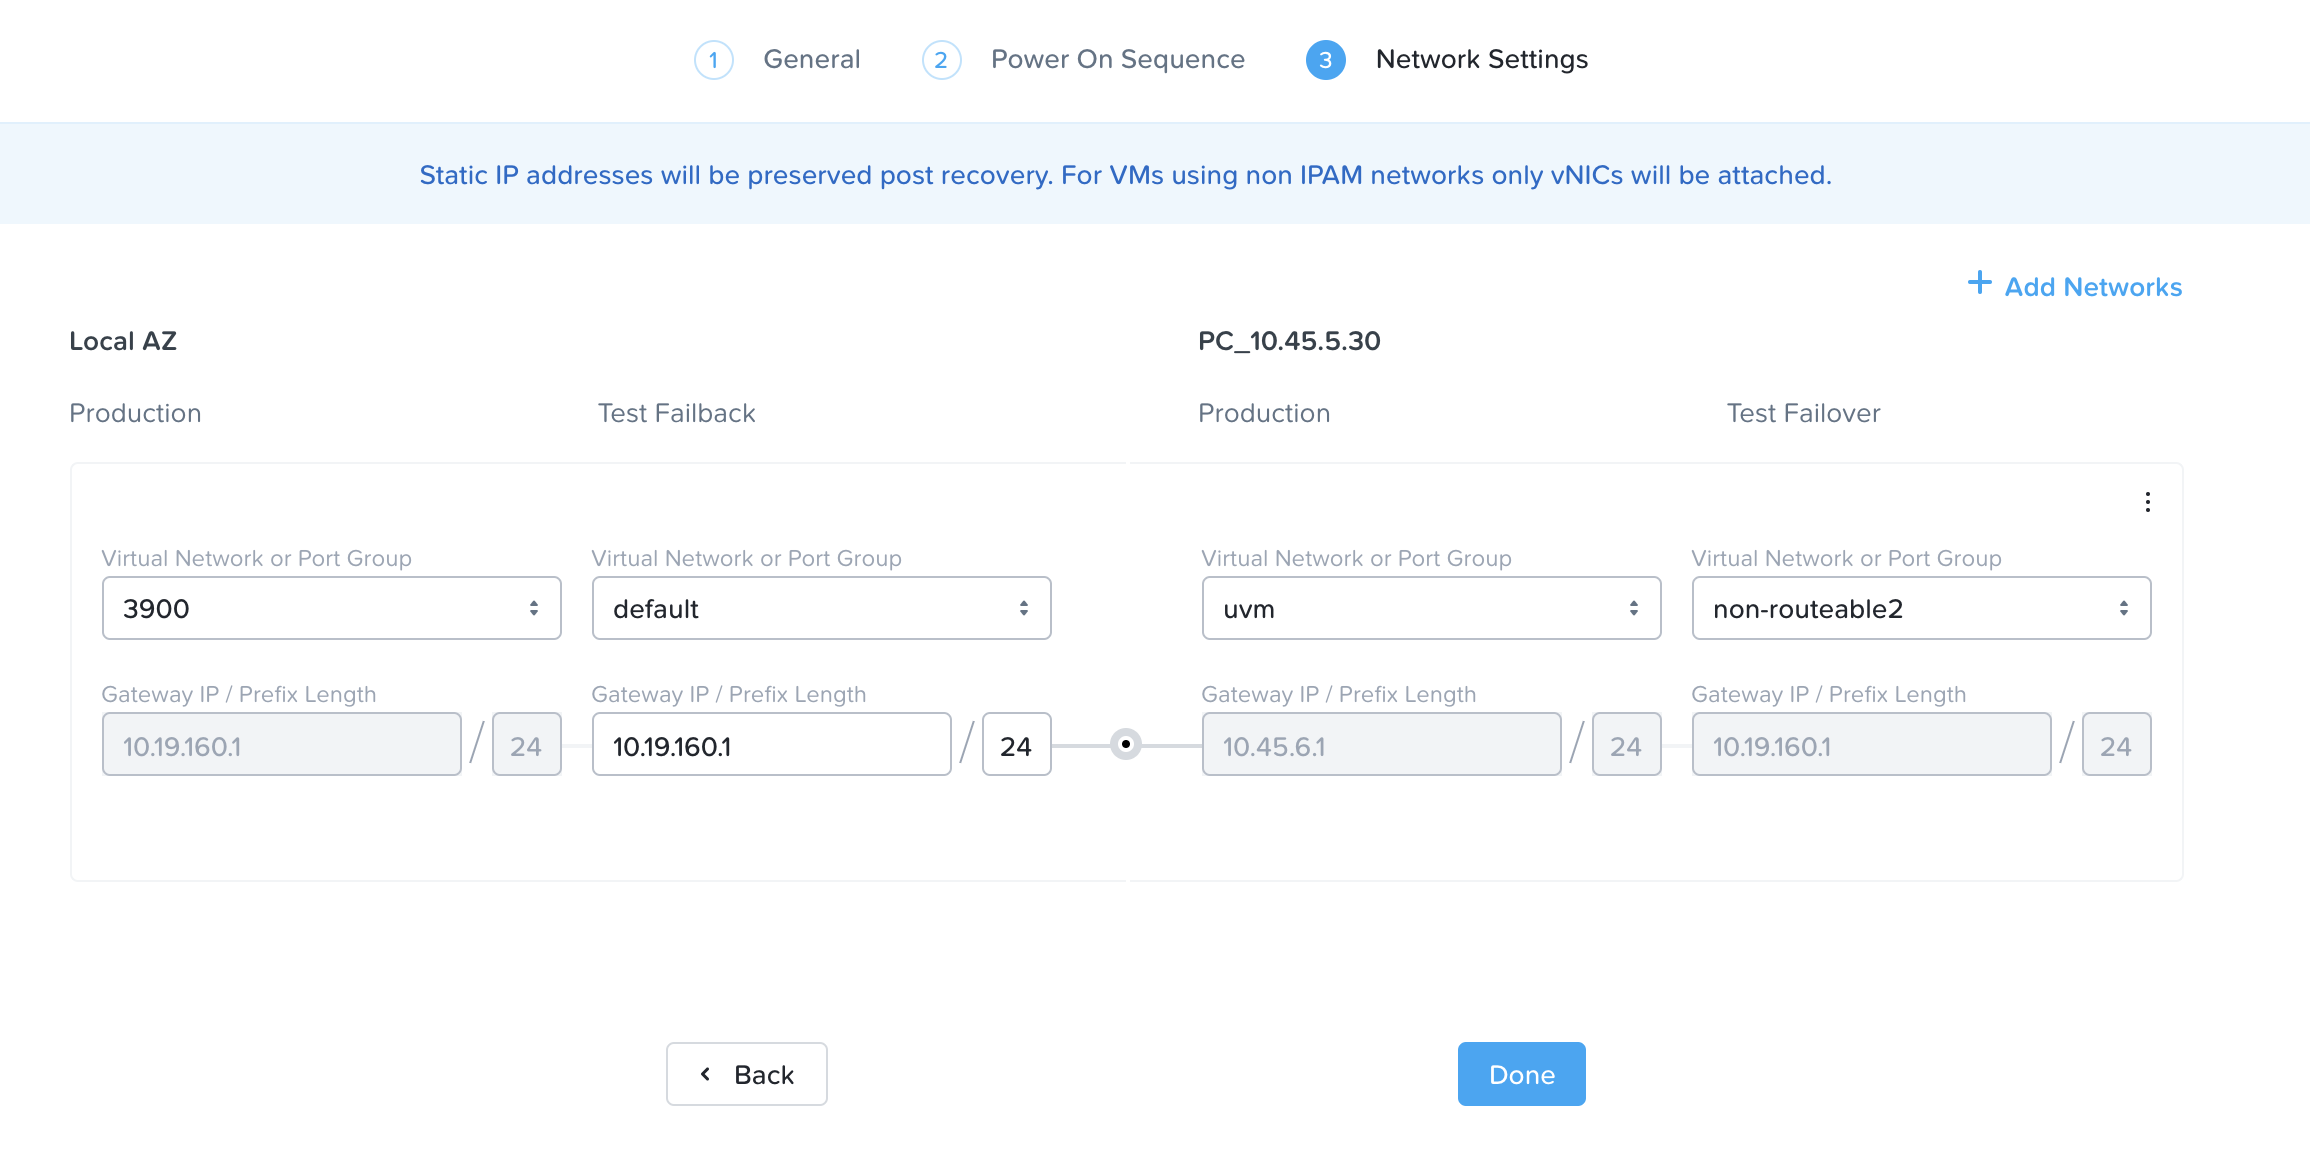 DR - Recovery Plan - Network Mapping
Note
Failover / Failback Networks
In most cases you will want to use a non-routable or isolated network for your test networks. This will ensure you don't have any issues with duplicate SIDs, arp entries, etc.
Migrating to NutanixLearn how Nutanix Move can help you migrate your VMs and files to Nutanix.
» Download this section as PDF (opens in a new tab/window)
Note
Interested in getting hands-on with a VM Migration with Nutanix Move? Take it for a spin with Nutanix Test Drive!
https://www.nutanix.com/test-drive-migrate-applicationsNutanix Move can migrate VMs onto the Nutanix Cloud Platform from many different hypervisors such as ESXi and Hyper-V as well as from AWS EC2, VMware Cloud (VMC) on AWS and Microsoft Azure. For the most up-to-date listing of supported migrations check the Move user guide.
Move allows you to create different migration plans to migrate your VMs. Below are some best practices for VM migration plans.
VM Migration Best Practices
- Group VMs for Migration
- Migrate in parallel from multiple hosts
- Max of 50 VMs per Migration Plan
- Migrations for ESXi Support up to 100 max VMs
- Optimize your Schedule
- Pre-seed VM data in advance of cutover
- Cutover should be within one week of the initial pre-seed
- Elongated seeding windows can incur additional disk usage in the source VM.
- Guest OS Preparation
- Two key reasons why VM prep fails:
- UAC and WinRM
- Switch to Manual mode to troubleshoot VM preparation issues
- Two key reasons why VM prep fails:
- DB Server Migrations
- Move supports “like for like” migrations
- DB Server migrations should follow best practices and may require re-platforming
- Move can migrate Databases, but you need to apply best practices after migrations
» Download this section as PDF (opens in a new tab/window)
Move Architecture
Nutanix Move is a VM appliance typically hosted on the target AHV cluster. Several software services come together to build Nutanix Move, but we can group them into the following major software components:
- The management server
- The management server maintains source and target cluster information, migration plan details, and current status. It also allows APIs and the UI to create and manage migration plans.
- Agents for source and target
- The source agent is a platform-specific (ESXi, Hyper-V, AHV, or cloud) software component that schedules migration copy requests through disk readers. It collects source cluster and VM details and helps you select the VMs to migrate using the management server UI.
- Disk readers and writers
- Disk reader processes use source-specific APIs to read data and coordinate with disk writer processes to complete outstanding copy operations. The disk reader checkpoints copy operations to handle failures and resume operations as needed.
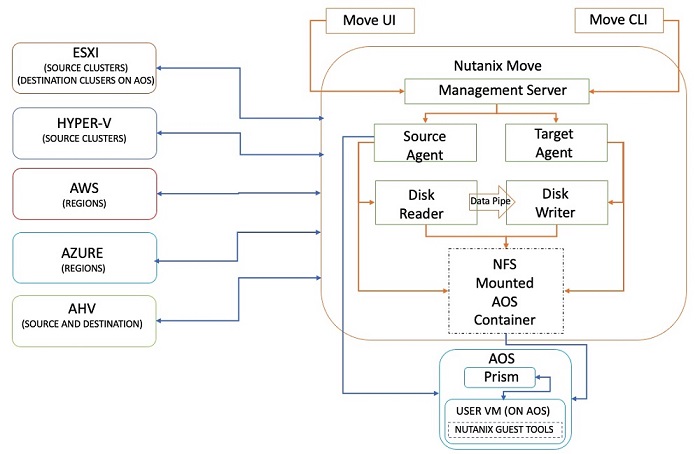
The architecture for each source environment that Move uses is slightly different, but Nutanix makes the difference in implementation invisible to users.
Nutanix Move for ESXi
The architecture of Nutanix Move for ESXi uses vCenter for inventory collection and vSphere Storage APIs for Data Protection (VADP), the Virtual Disk Development Kit (VDDK), and Changed Block Tracking (CBT) for data migration.
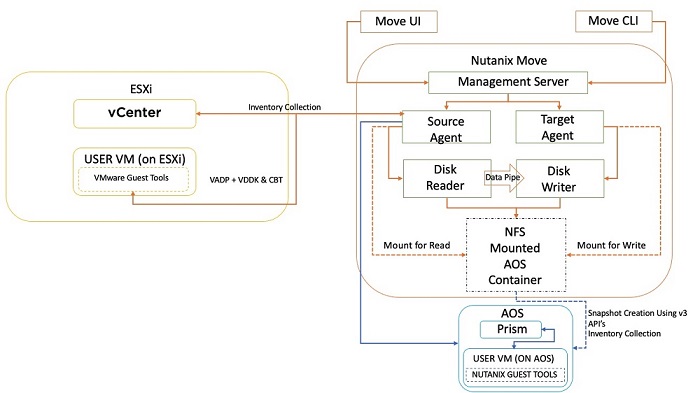
Nutanix Move for Hyper-V
The architecture of Nutanix Move for Hyper-V has an agent on each Hyper-V server that makes up part of the Hyper-V cluster. It then uses the agents to move data and the Hyper-V Manager to collect inventory.
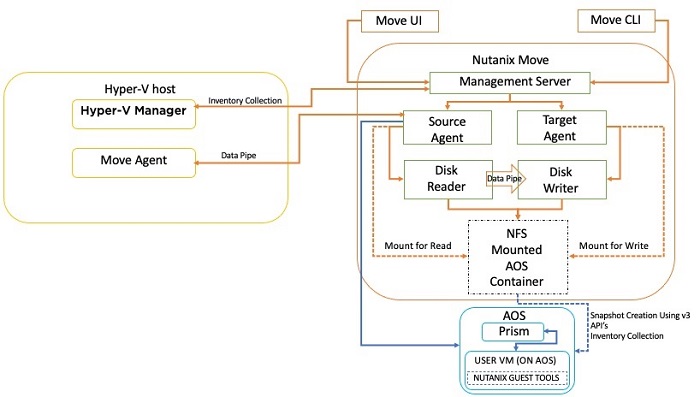
Nutanix Move for AWS
The architecture of Nutanix Move for AWS is somewhat different from Move in other environments. When you add AWS as an environment, the Move appliance connects to AWS for inventory and uses the Elastic Block Store (EBS) direct APIs for data migration. Move no longer creates an agent VM as it did in earlier versions.
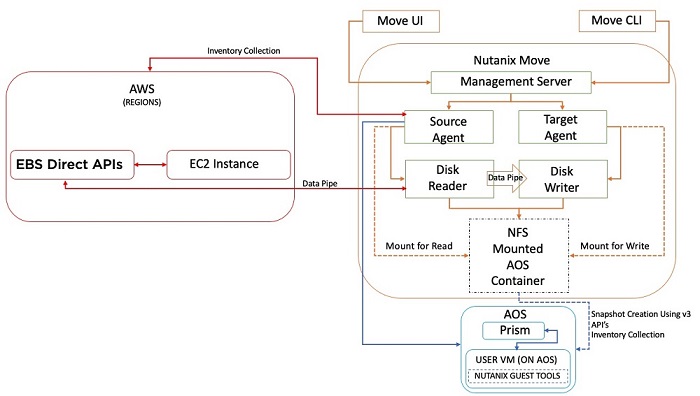
Nutanix Move for Azure
The architecture of Nutanix Move for Azure is similar to the architecture of Move for AWS in that it uses the Azure Public Cloud REST APIs to collect inventory and access storage.
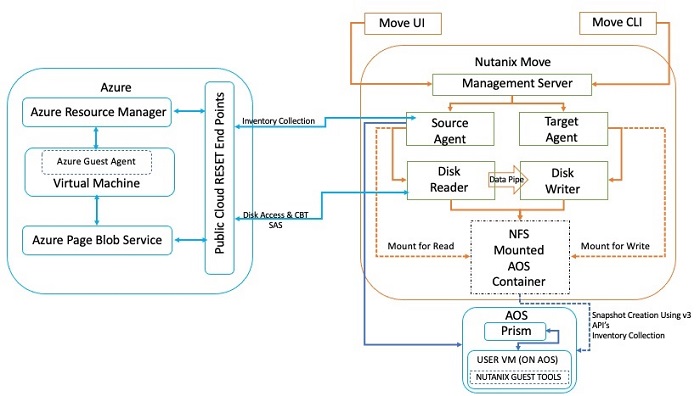
» Download this section as PDF (opens in a new tab/window)
Files Migration Architecture
- Move is the Control Pane
- Nutanix Files is the Data Plane
- Move orchestrates files migration using the Nutanix Files v4 APIs and Nutanix Files performs the data copy from the source using SMB or NFS
- The same Move appliance can perform both files and VM migrations
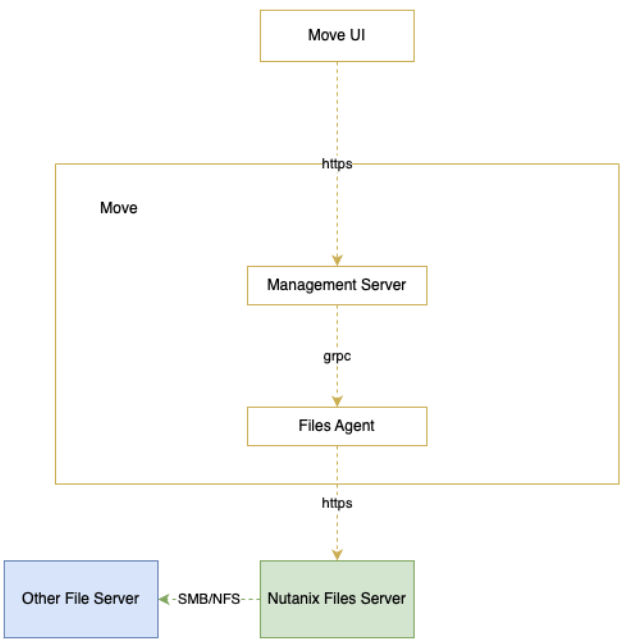
Prerequisites
Prerequisites for Move File Migration
- Move version 5.0 and later support file migration
- Move should be able to reach the destination Nutanix Files server over TCP port 9440
Prerequisites on Target Nutanix Files Server
- Files 4.4 and later (migration API support added in Files 4.4)
- Configure API user with username and password
- NFS/SMB access to source server network from target Nutanix Files server
- Target share should not have MaxSize (storage limit) configured
Prerequisites for SMB Source (From Files)
- Username and password for the backup operator
- SMB version 2 and above
Prerequisites for NFS Source
- Disable root squash for share to be migrated.
- Make sure sys_auth is supported for share to be migrated
- NFS V3 is supported
Best Practices
- Currently, only five concurrent migrations are allowed. So, only five share/share paths can be migrated in parallel
- Perform a small number of migrations and complete them before starting others. This will ensure the shortest cutover time.
- Move will run an incremental sync iteration every 24 hours.
- Source share should be in read-only mode before triggering cutover. During cutover, Move will perform the final sync iteration and complete the migration.
- Pausing a Migration Plan, which has ongoing sync iteration, doesn’t free up the parallel pipe for other migrations. It is advisable to pause the migration after the ongoing iteration has finished.
Troubleshooting
Support Bundle Collection
-
Download the Move Support Bundle from the UI
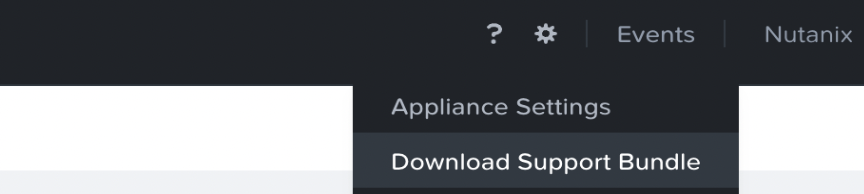
- Download Realtime Logs from the UI
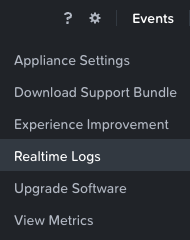
-
Choose the filesagent and mgmtserver filters
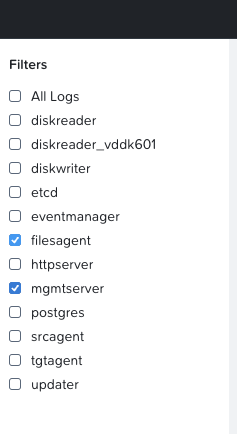
- Log files location
- /opt/xtract-vm/logs
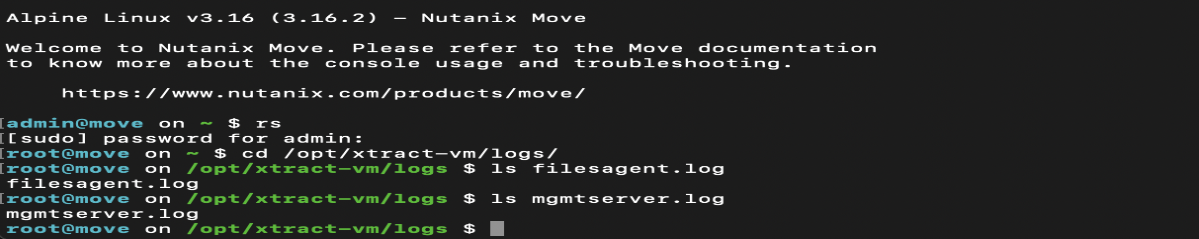
- /opt/xtract-vm/logs
-
The Move service for files migration is filesagent
- When SMB migration fails due to user permissions you’ll see the following
- Solution: Add user to the backup operator group
- NFS migration fails with auth type sys is not configured
- Solution: Change authentication to system
Storage
Unified Storage ServicesLearn all about Nutanix Volumes, Files, and Objects.
» Download this section as PDF (opens in a new tab/window)
The Nutanix Volumes feature (previously know as Acropolis Volumes) exposes back-end DSF storage to external consumers (guest OS, physical hosts, containers, etc.) via iSCSI.
This allows any operating system to access DSF and leverage its storage capabilities. In this deployment scenario, the OS is talking directly to Nutanix bypassing any hypervisor.
Core use-cases for Volumes:
- Shared Disks
- Oracle RAC, Microsoft Failover Clustering, etc.
- Disks as first-class entities
- Where execution contexts are ephemeral and data is critical
- Containers, OpenStack, etc.
- Guest-initiated iSCSI
- Bare-metal consumers
- Exchange on vSphere (for Microsoft Support)
Qualified Operating Systems
The solution is iSCSI spec compliant, the qualified operating systems are just those of which have been validated by QA.
- Microsoft Windows Server 2008 R2, 2012 R2
- Redhat Enterprise Linux 6.0+
Volumes Constructs
The following entities compose Volumes:
- Data Services IP: Cluster wide IP address used for iSCSI login requests (Introduced in 4.7)
- Volume Group: iSCSI target and group of disk devices allowing for centralized management, snapshotting, and policy application
- Disk(s): Storage devices in the Volume Group (seen as LUNs for the iSCSI target)
- Attachment: Allowing a specified initiator IQN access to the volume group
- Secret(s): Secret used for CHAP/Mutual CHAP authentication
NOTE: On the backend, a VG’s disk is just a vDisk on DSF.
Pre-Requisites
Before we get to configuration, we need to configure the Data Services IP which will act as our central discovery / login portal.
We’ll set this on the ‘Cluster Details’ page (Gear Icon -> Cluster Details):
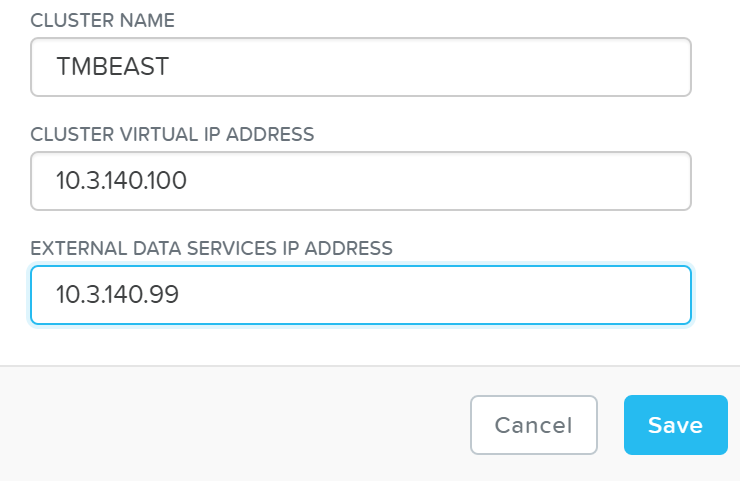 Volumes - Data Services IP
This can also be set via NCLI / API:
ncli cluster edit-params external-data-
services-ip-address=DATASERVICESIPADDRESS
Target Creation
To use Volumes, the first thing we’ll do is create a ‘Volume Group’ which is the iSCSI target.
From the ‘Storage’ page click on ‘+ Volume Group’ on the right hand corner:
 Volumes - Add Volume Group
This will launch a menu where we’ll specify the VG details:
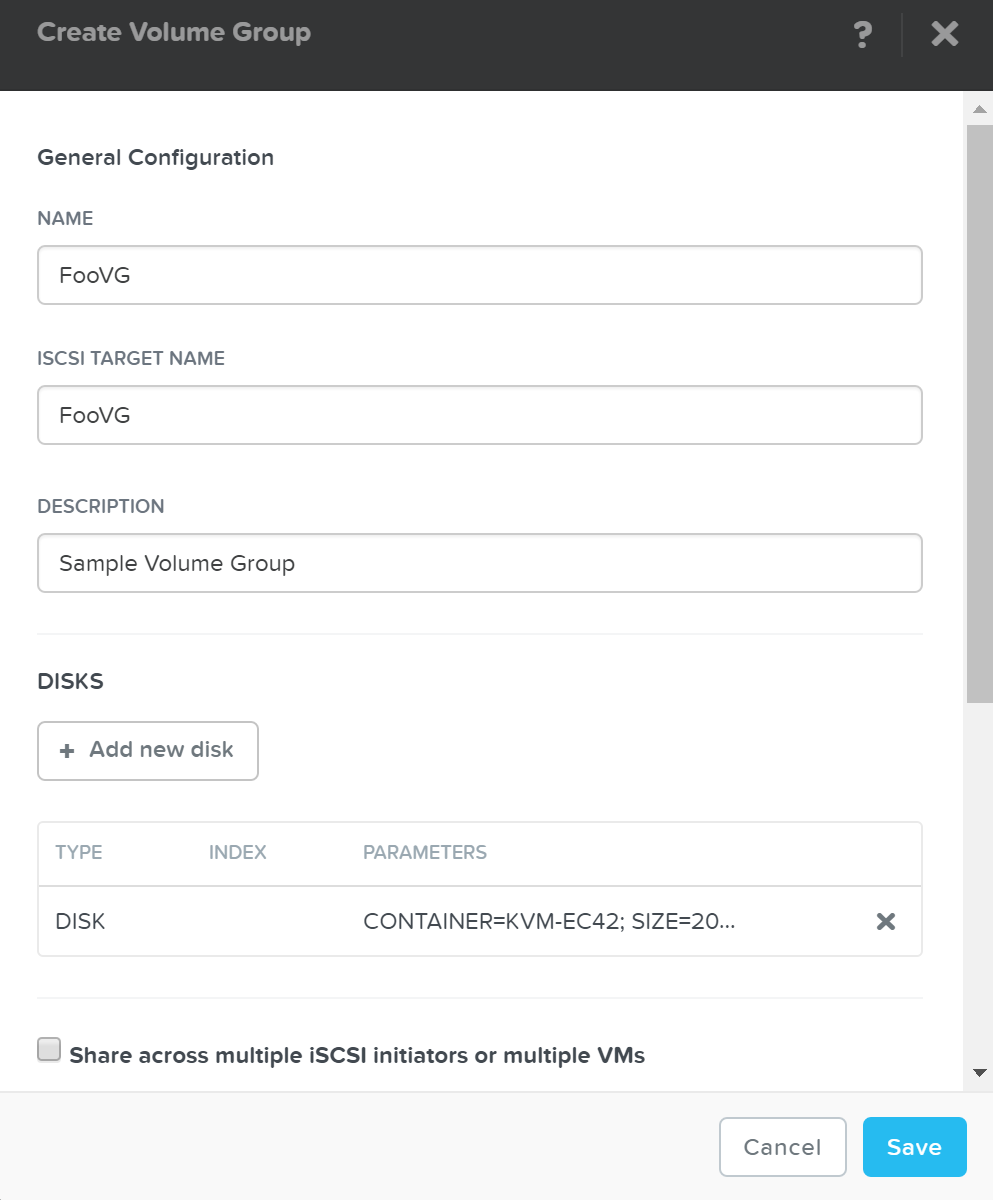 Volumes - Add VG Details
Next we’ll click on ‘+ Add new disk’ to add any disk(s) to the target (visible as LUNs):
A menu will appear allowing us to select the target container and size of the disk:
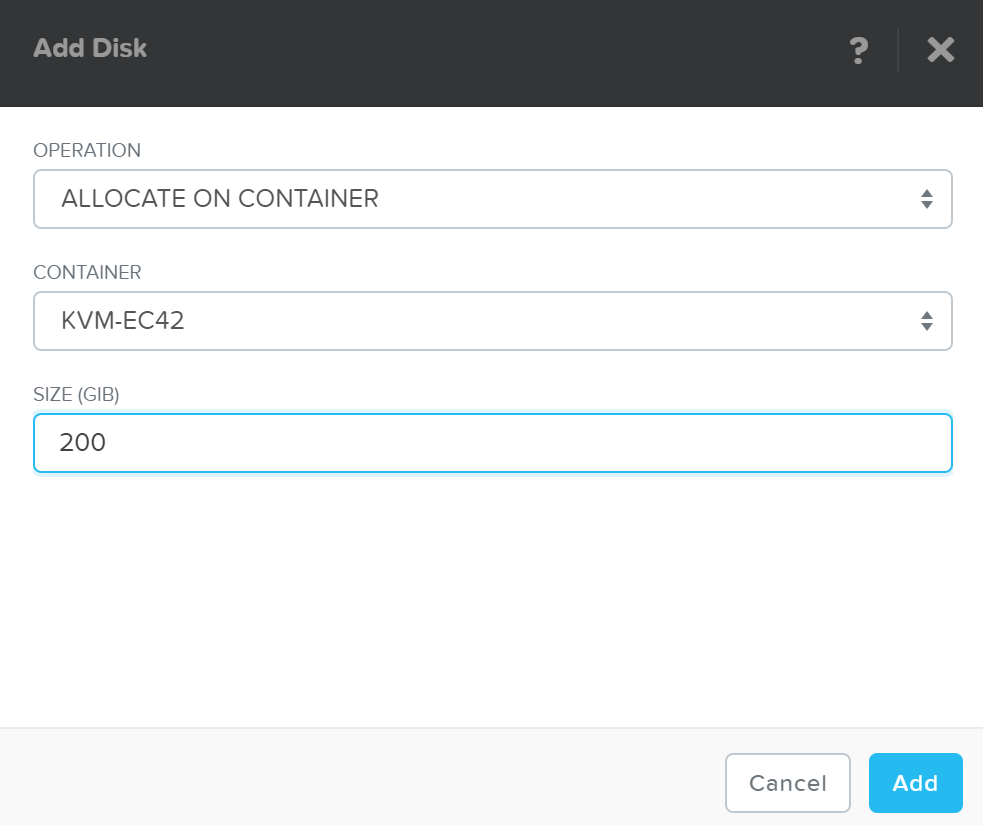 Volumes - Add Disk
Click ‘Add’ and repeat this for however many disks you’d like to add.
Once we’ve specified the details and added disk(s) we’ll attach the Volume Group to a VM or Initiator IQN. This will allow the VM to access the iSCSI target (requests from an unknown initiator are rejected):
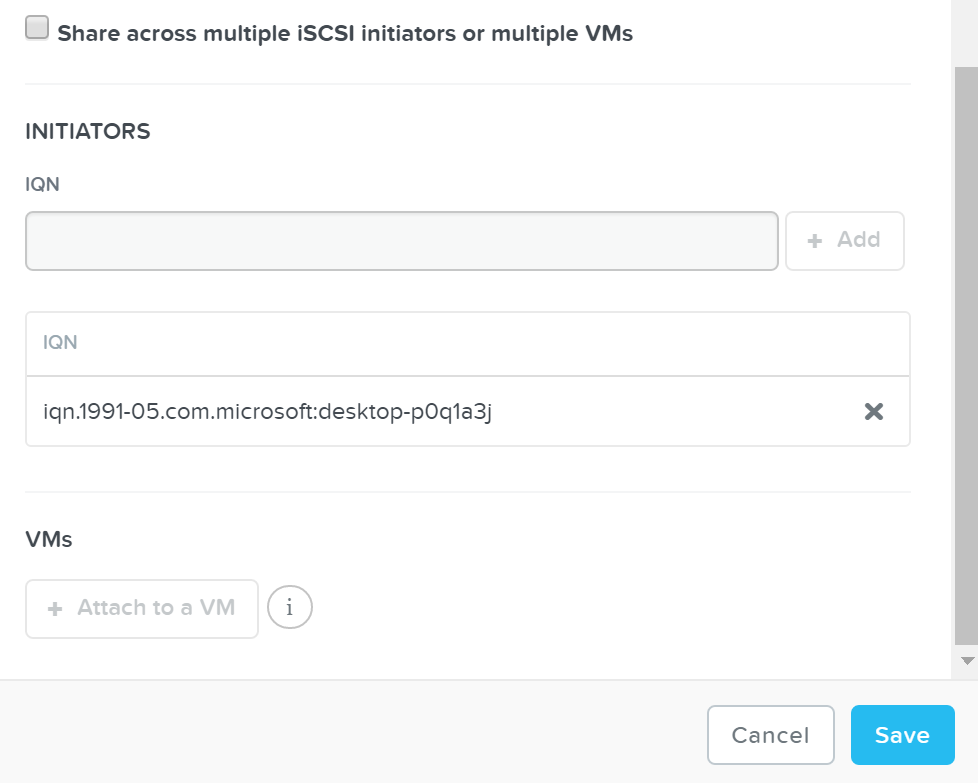 Volumes - Initiator IQN / VM
Click ‘Save’ and the Volume Group configuration is complete!
This can all be done via ACLI / API as well:
Create VG
vg.create VGName
Add disk(s) to VG
Vg.disk_create VGName container=CTRName create_size=Disk size, e.g. 500G
Attach initiator IQN to VG
Vg.attach_external VGName InitiatorIQN
Path High-Availability (HA)
As mentioned previously, the Data Services IP is leveraged for discovery. This allows for a single address that can be leveraged without the need of knowing individual CVM IP addresses.
The Data Services IP will be assigned to the current iSCSI leader. In the event that fails, a new iSCSI leader will become elected and assigned the Data Services IP. This ensures the discovery portal will always remain available.
The iSCSI initiator is configured with the Data Services IP as the iSCSI target portal. Upon a login request, the platform will perform an iSCSI login redirect to a healthy Stargate.
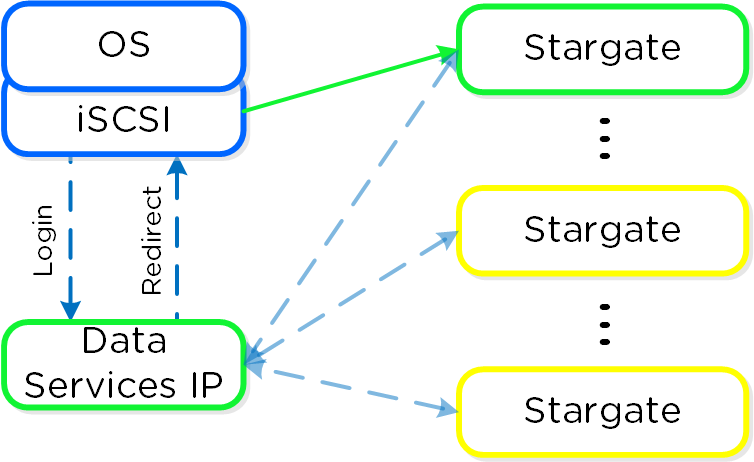 Volumes - Login Redirect
In the event where the active (affined) Stargate goes down, the initiator retries the iSCSI login to the Data Services IP, which will then redirect to another healthy Stargate.
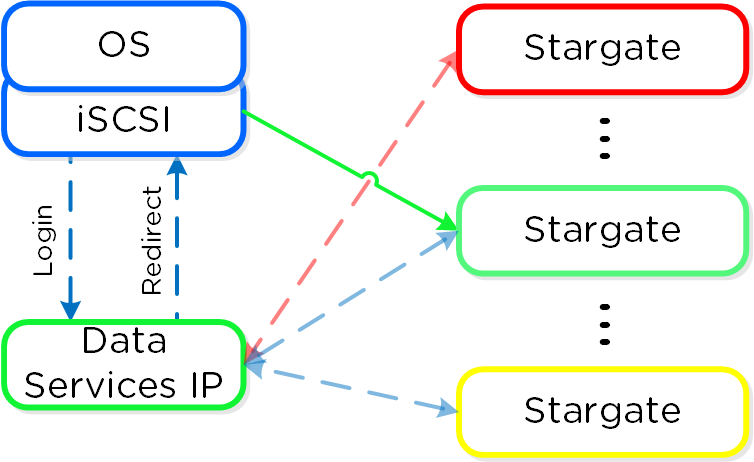 Volumes - Failure Handling
If the affined Stargate comes back up and is stable, the currently active Stargate will quiesce I/O and kill the active iSCSI session(s). When the initiator re-attempts the iSCSI login, the Data Services IP will redirect it to the affined Stargate.
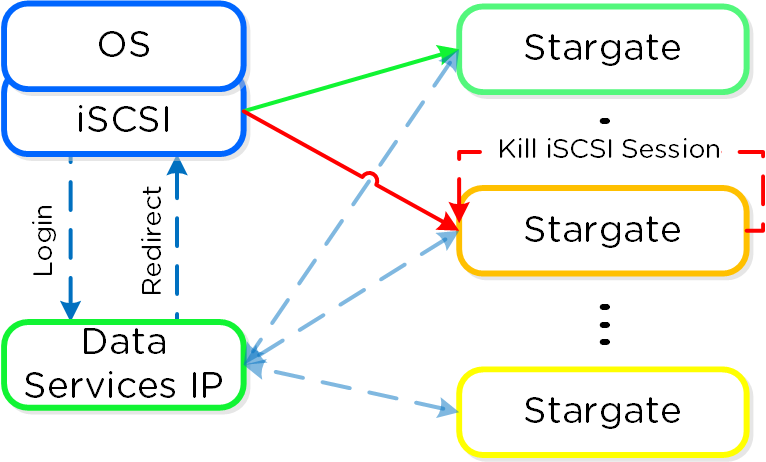 Volumes - Failback
Note
Health Monitoring and Defaults
Stargate health is monitored using Zookeeper for Volumes, using the exact same mechanism as DSF.
For failback, the default interval is 120 seconds. This means once the affined Stargate is healthy for 2 or more minutes, we will quiesce and close the session. Forcing another login back to the affined Stargate.
Given this mechanism, client side multipathing (MPIO) is no longer necessary for path HA. When connecting to a target, there’s now no need to check ‘Enable multi-path’ (which enables MPIO):
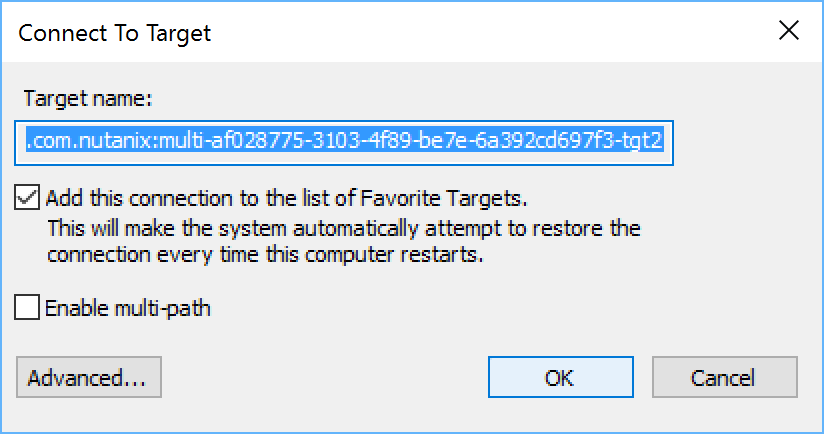 Volumes - No MPIO
Multi-Pathing
The iSCSI protocol spec mandates a single iSCSI session (TCP connection) per target, between initiator and target. This means there is a 1:1 relationship between a Stargate and a target.
As of 4.7, 32 (default) virtual targets will be automatically created per attached initiator and assigned to each disk device added to the volume group (VG). This provides an iSCSI target per disk device. Previously this would have been handled by creating multiple VGs with a single disk each.
When looking at the VG details in ACLI/API you can see the 32 virtual targets created for each attachment:
attachment_list {
	external_initiator_name: "iqn.1991-05.com.microsoft:desktop-foo"
	target_params {
		num_virtual_targets: 32
	}
}
Here we’ve created a sample VG with 3 disks devices added to it. When performing a discovery on my client we can see an individual target for each disk device (with a suffix in the format of ‘-tgt[int]’):
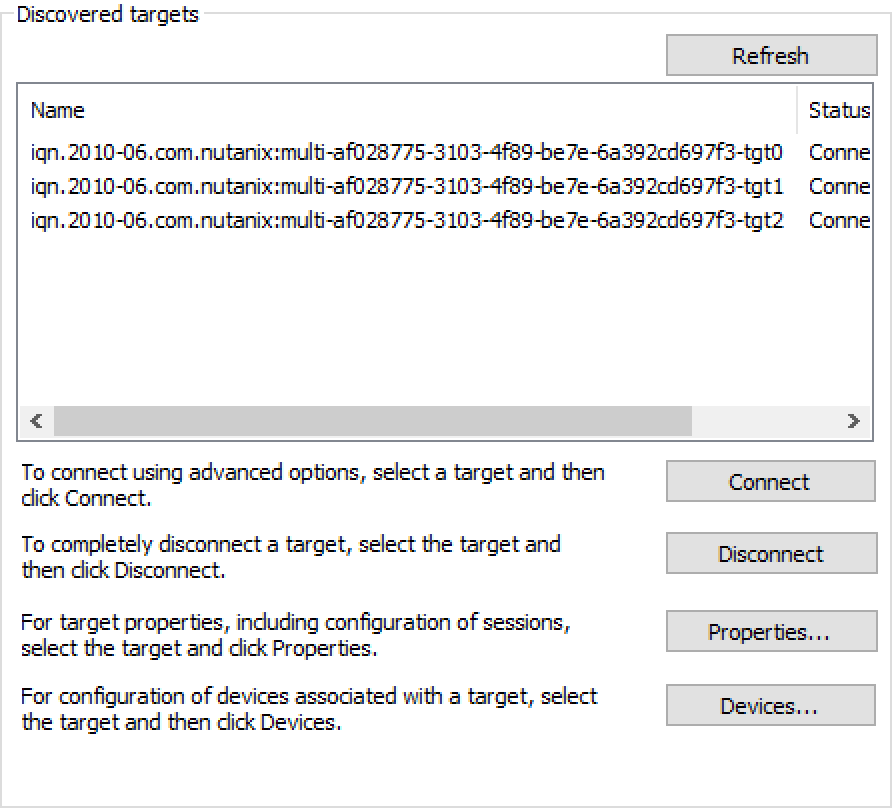 Volumes - Virtual Target
This allows each disk device to have its own iSCSI session and the ability for these sessions to be hosted across multiple Stargates, increasing scalability and performance:
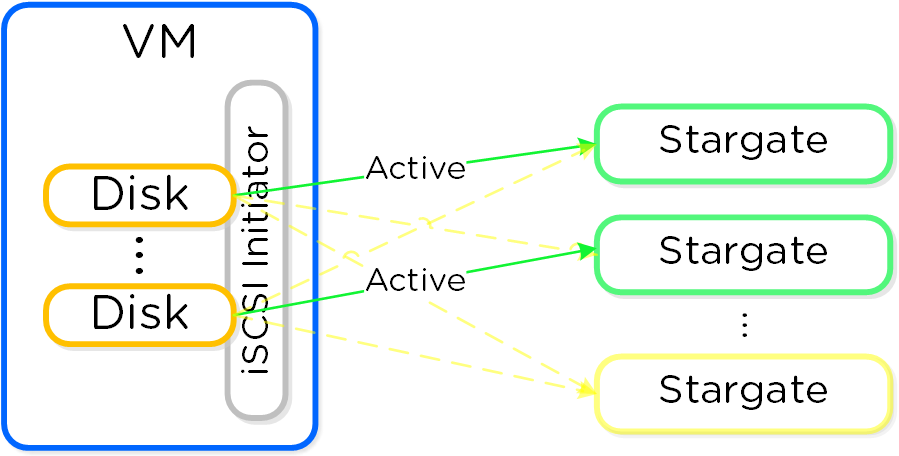 Volumes - Multi-Path
Load balancing occurs during iSCSI session establishment (iSCSI login), for each target.
Note
Active Path(s)
You can view the active Stargate(s) hosting the virtual target(s) with the following command (will display CVM IP for hosting Stargate):
# Windows
Get-NetTCPConnection -State Established -RemotePort 3205

# Linux
iscsiadm -m session -P 1
As of 4.7 a simple hash function is used to distribute targets across cluster nodes. In 5.0 this is integrated with the Dynamic Scheduler which will re-balance sessions if necesary. We will continue to look at the algorithm and optimize as necessary. It is also possible to set a preferred node which will be used as long as it is in a healthy state.
Note
SCSI UNMAP (TRIM)
Volumes supports the SCSI UNMAP (TRIM) command in the SCSI T10 specification. This command is used to reclaim space from deleted blocks.
» Download this section as PDF (opens in a new tab/window)
The Nutanix Files feature allows users to leverage the Nutanix platform as a highly available file server. This allows for a single namespace where users can store home directories and files.
Supported Configurations
The solution is applicable to the configurations below (list may be incomplete, refer to documentation for a fully supported list):
Core Use Case(s):
- Home folders / user profiles
- File storage
- Media repository
- Persistent container storage
Management interfaces(s):
- Prism Element (PE)
- Prism Central (PC)
Hypervisor(s):
- AHV
- ESXi
Upgrades:
- Prism
Compatible Features:
- Nutanix Snapshots and DR
- File share level replication and DR (Smart DR)
- File tiering to S3 compliant storage (Smart Tier)
- File level snapshots including Windows Previous Version (WPV)
- Self Service Restore
- CFT Backups
File Protocols:
- SMB 2
- SMB 3
- NFS v4
- NFS v3
Files Constructs
This feature is composed of a few high-level constructs:
- File Server
- High-level namespace. Each file server will have its own set of Files VMs (FSVM) which are deployed
- Share
- Share exposed to users. A file server can have multiple shares (e.g. departmental shares, etc.)
- Folder
- Folders for file storage. Folders are sharded across FSVMs
The figure shows the high-level mapping of the constructs:
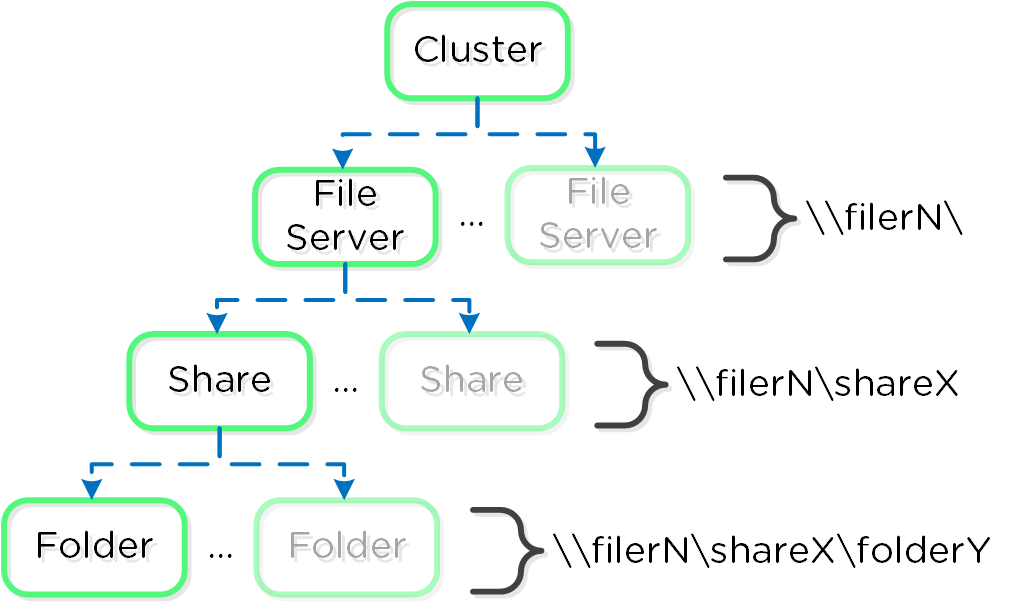 Files Mapping
The Nutanix Files feature follows the same methodology for distribution as the Nutanix platform to ensure availability and scale. A minimum of 3 FSVMs will be deployed as part of the File Server deployment.
The figure shows a detailed view of the components:
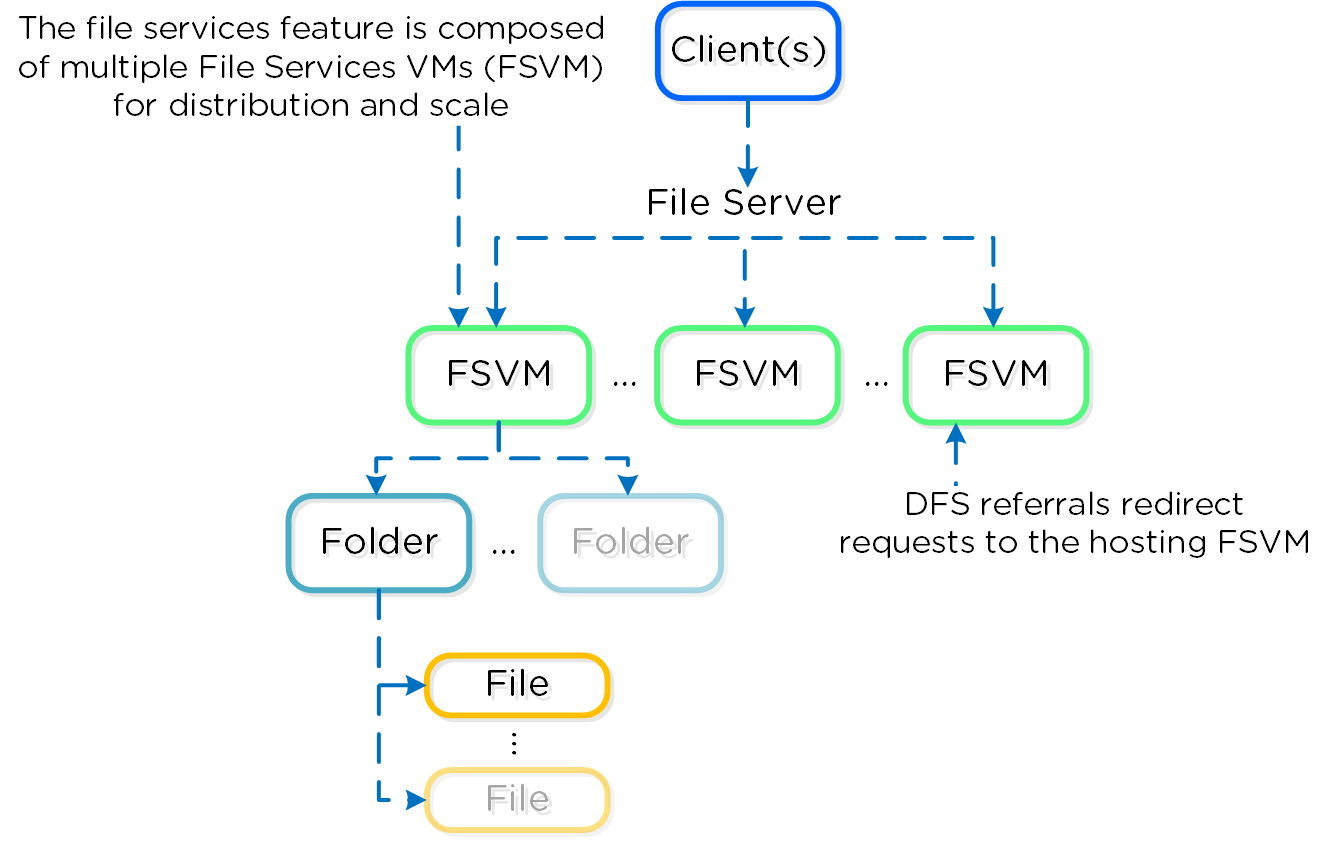 Files Detail
The FSVMs are combined into a logical file server instance sometimes referred to as a Files cluster. You can create multiple Files clusters within a single Nutanix cluster. The FSVMs are transparently deployed as part of the configuration process.
The figure shows a detailed view of FSVMs on the AOS platform:
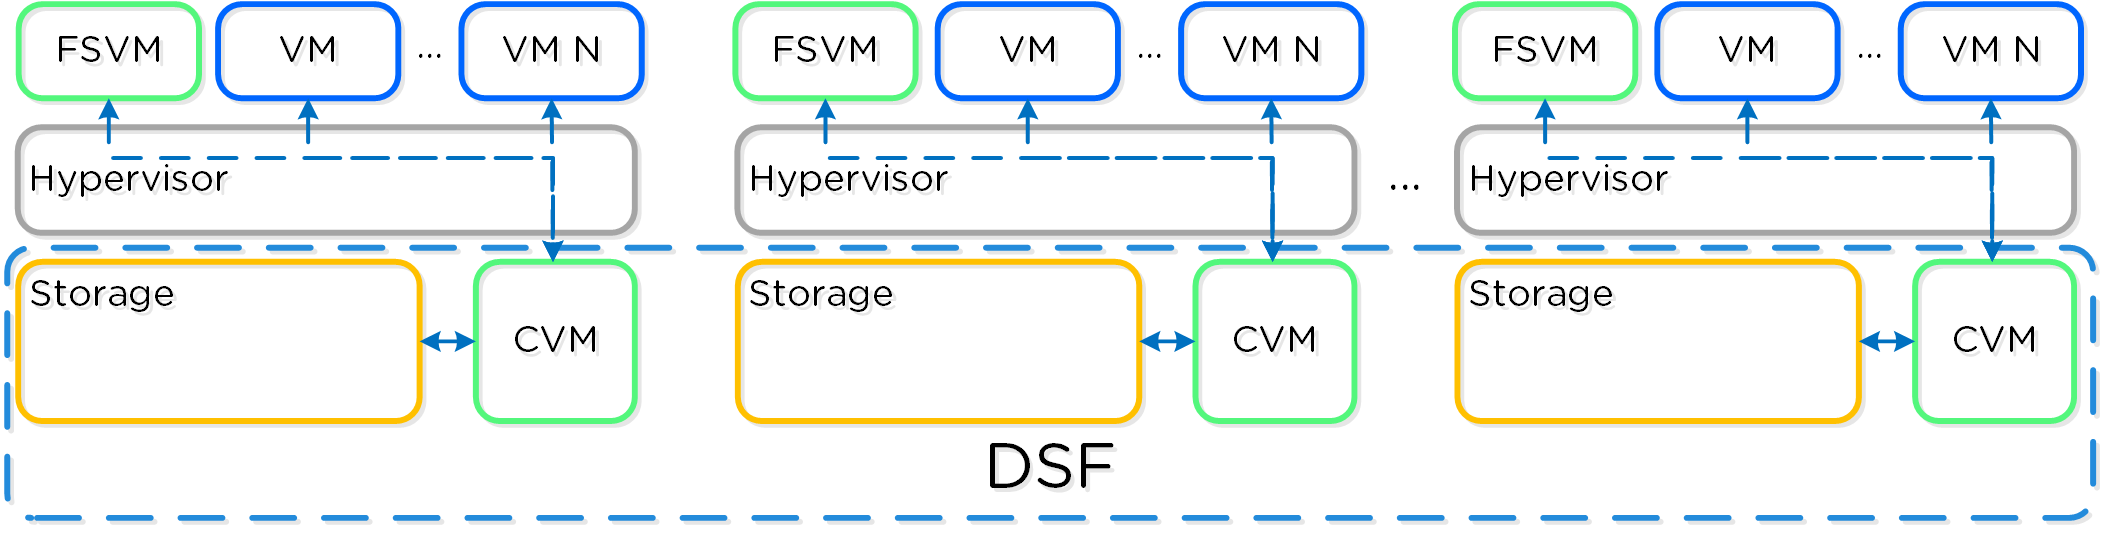 FSVM Deployment Arch
Authentication and Authorization
The Nutanix Files feature is fully integrated into Microsoft Active Directory (AD) and DNS. This allows all of the secure and established authentication and authorization capabilities of AD to be leveraged. All share permissions, user and group management is done using the traditional Windows MMC for file management.
As part of the installation process the following AD / DNS objects will be created:
- AD Computer Account for File Server
- AD Service Principal Name (SPN) for File Server and each FSVM
- DNS entry for File Server pointing to all FSVM(s)
- DNS entry for each FSVM
Note
AD Privileges for File Server Creation
A user account with the domain admin or equivalent privileges must be used to deploy the File Service feature as AD and DNS objects are created.
High-Availability (HA)
Each FSVM leverages the Volumes API for its data storage which is accessed via in-guest iSCSI. This allows any FSVM to connect to any iSCSI target in the event of a FSVM outage.
The figure shows a high-level overview of the FSVM storage:
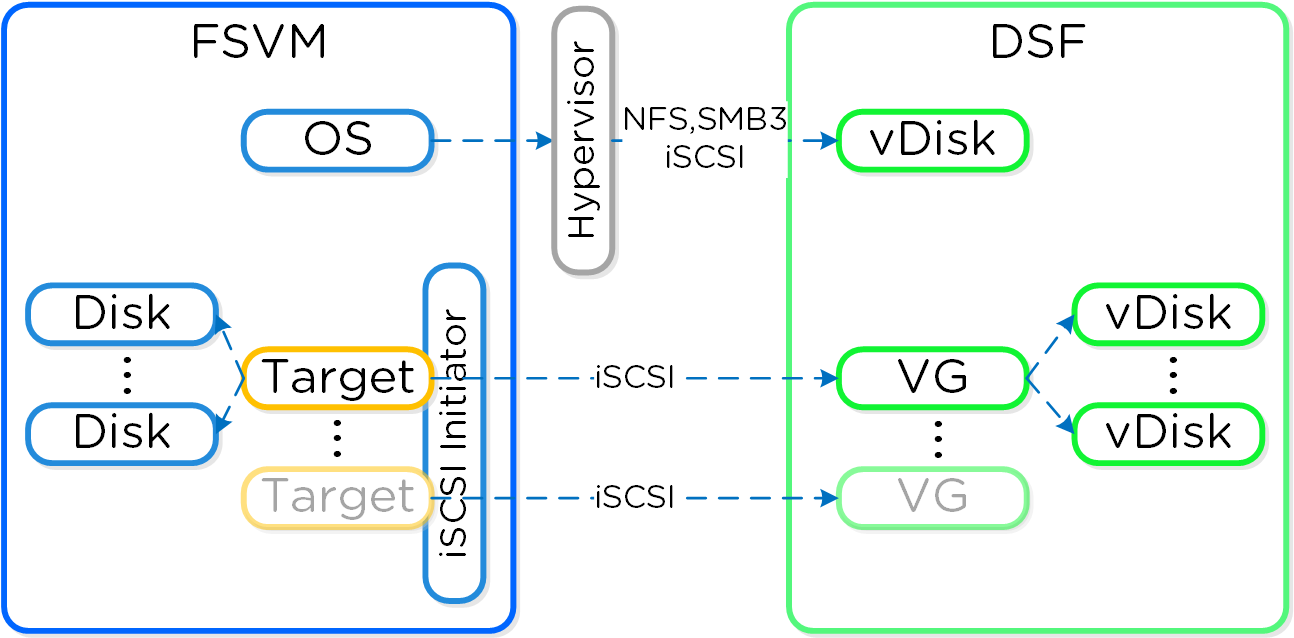 FSVM Storage
In the event a CVM becomes unavailable (e.g. active path down), iSCSI redirection is used to failover targets to another CVM which will then takeover IO.
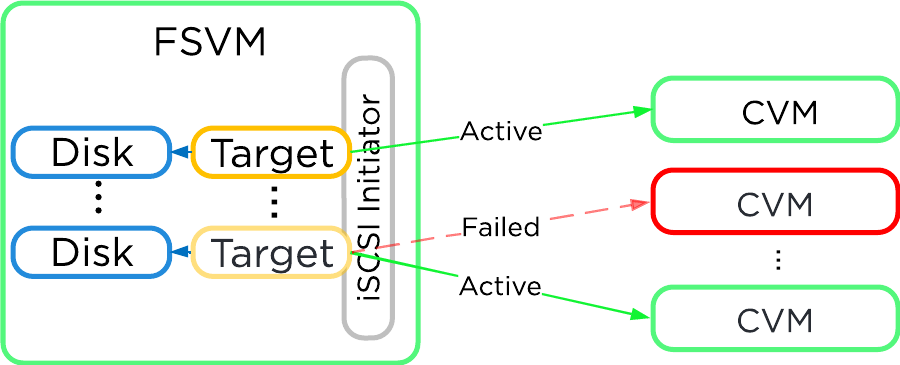 FSVM Storage Failover
When the original CVM comes back and is healthy it will be marked as the active path to provide for IO.
In a normal operating environment each FSVM will be communicating with its own VGs for data storage with passive connections to the others. Each FSVM will have an IP which clients use to communicate with the FSVM as part of the DFS referral process. Clients do not need to know each individual FSVM’s IP as the DFS referral process will connect them to the correct IP hosting their shares and folder(s).
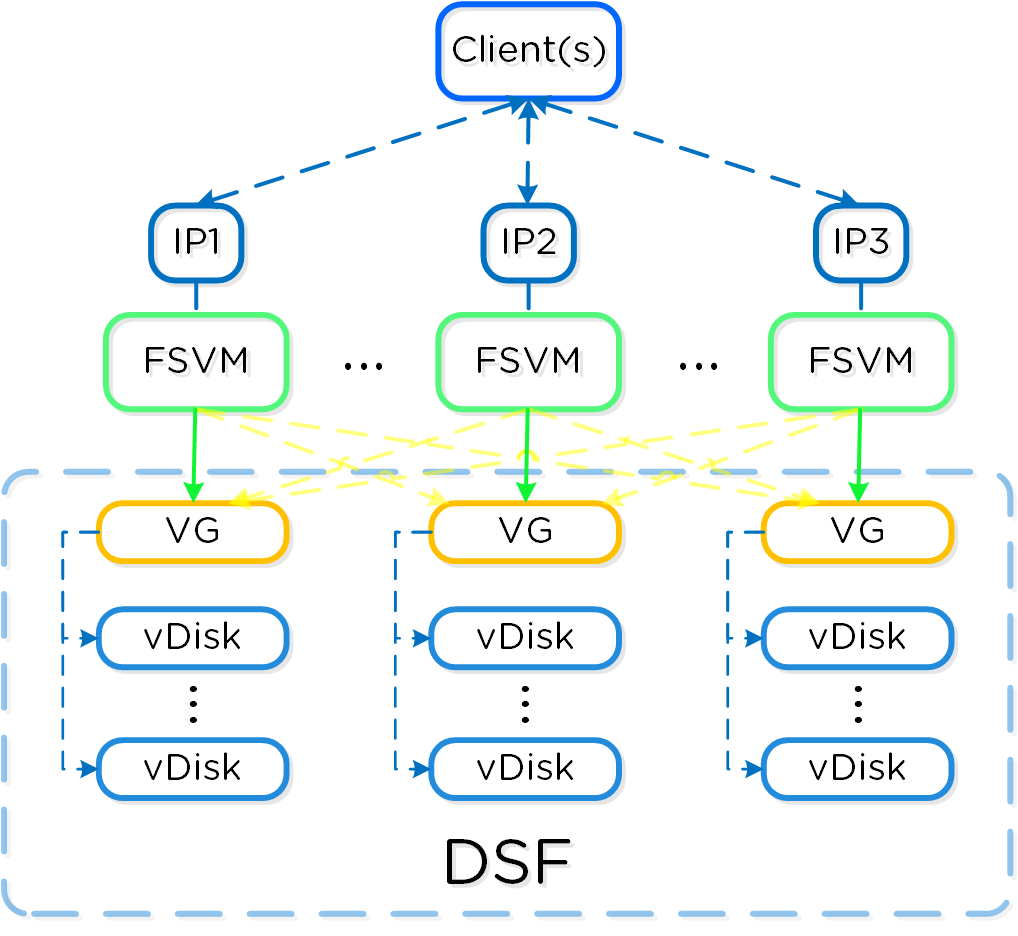 FSVM Normal Operation
In the event of a FSVM “failure” (e.g. maintenance, power off, etc.) the VG and IP of the failed FSVM will be taken over by another FSVM to ensure client availability.
The figure shows the transfer of the failed FSVM’s IP and VG:
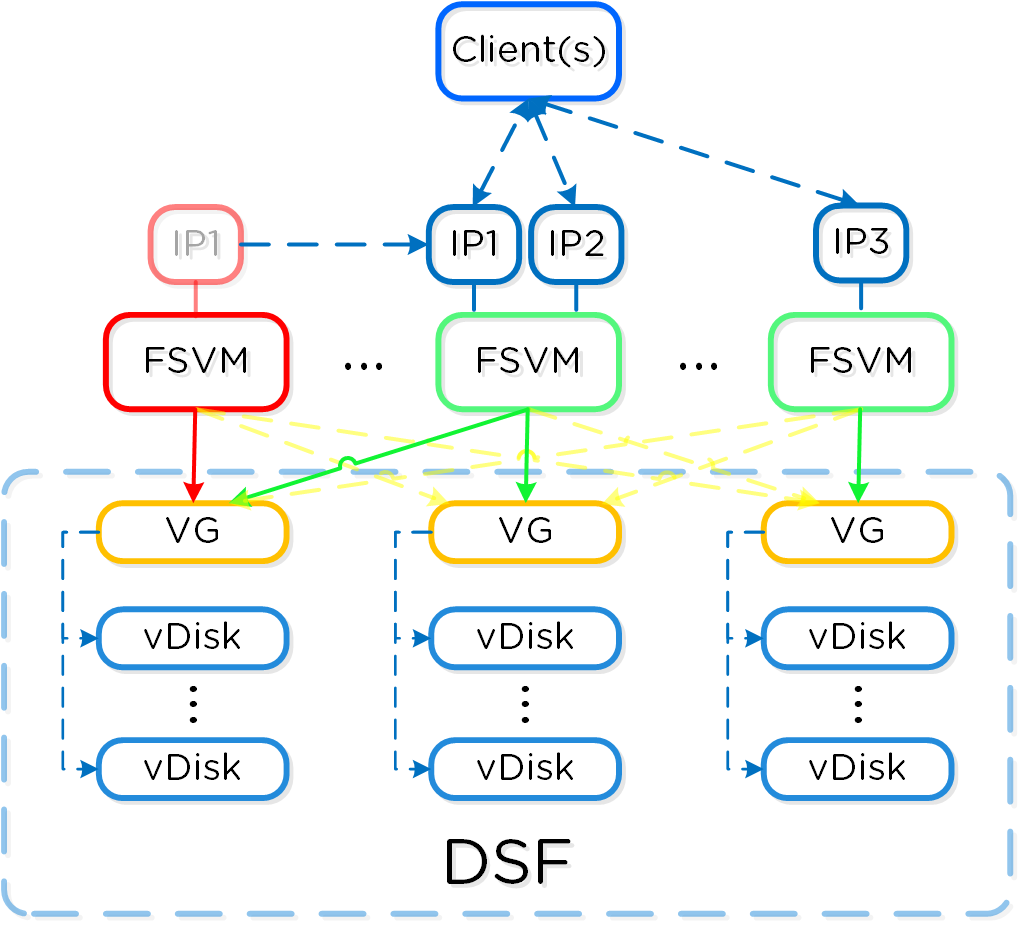 FSVM Failure Scenario
When the failed FSVM comes back and is stable, it will re-take its IP and VG and continue to serve client IO.
» Download this section as PDF (opens in a new tab/window)
The Nutanix Objects feature provides highly scalable and durable object services via an S3 compliant API (More Information on S3: LINK). Given Nutanix Objects is deployed on top of the Nutanix platform, it can take advantage of AOS features like compression, erasure coding, replication and more. Objects was introduced in AOS 5.11.
Supported Configurations
The solution is applicable to the configurations below (list may be incomplete, refer to documentation for a fully supported list):
Core Use Case(s):
- Backup target with compliance-level WORM
- Archival target for PACS / VNA, Email, long term backups
- Big Data including Data Lakes, AI/ML workloads, analytics, machine loggins, SIEM, Pub/Sub
- DevOps, cloud-native, content repos, K8s
Management interfaces(s):
- Prism Central (PC)
Hypervisor(s):
- N/A - Runs on Nutanix MSP (Dependent on MSP supported Hypervisors)
Upgrades:
- LCM
Key Features:
- WORM
- Versioning
- Legal Hold
- Multiprotocol
- Streaming Replication
- Multi-part Upload
- Fast Copy
- S3 Select
Supported Protocols:
- S3 (version 4)
- NFSv3
Note
Nutanix Microservices Platform (MSP)
Nutanix Objects leverages the Nutanix Microservices Platform (MSP) and is one of the first core services to do so.
Nutanix MSP provides a common framework and services to deploy the Objects component's associated containers and platform services like Identity and Access Management (IAM) and Load Balancing (LB).
Key terms
The following key terms are used throughout this section and defined in the following:
- Bucket
- An organization unit exposed to users and contains the objects (think share to a file on a file server). A deployment can, and typically will, have multiple buckets (e.g. departmental, compartmental, etc.)
- Object
- The actual unit (blob) of storage and item interfaced with via the API (GET/PUT).
- S3
- The term used to describe the original object service Amazon Web Services (AWS) introduced and is now used synonymously for an object service. S3 also is used to define the object API which is highly leveraged throughout projects.
- Worker VMs
- Virtual machines created during object store deployment that host various containerized Objects services. The are also referred to as Objects nodes.
- Objects Browser
- A user interface (UI) that allows the users to directly launch the object store instance in a web browser and perform bucket and object level operations.
The figure shows the high-level mapping of the conceptual structure:
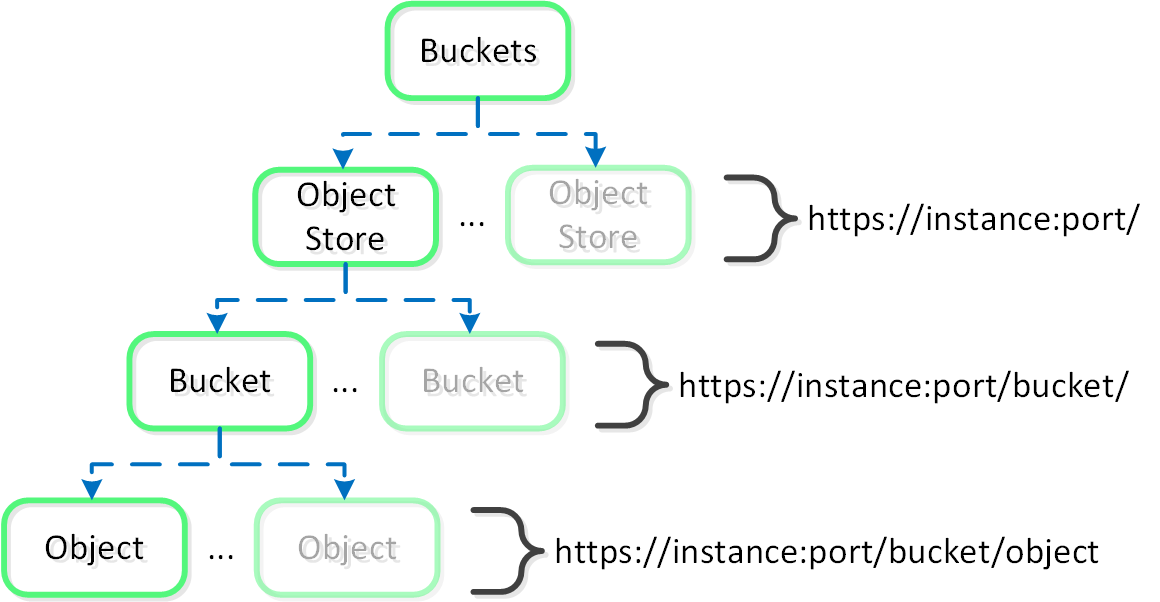 Objects - Hierarchy
Objects Constructs
This feature is composed of a few high-level constructs:
- Load Balancer
- The load balancer is part of the Nutanix MSP and serves as a proxy for service and data requests. This ensures high-availability for the service and load balancing among the Objects containers.
- Service Manager
- The service manager serves as the endpoint for all UI requests and manages object store instances. It is also responsible for collecting stats from instances.
- Metadata Server
- The metadata server contains all the metadata around a Nutanix Objects deployment (e.g. buckets, objects, etc.). To bolster performance of the metadata server, Nutanix developed ChakrDB, leveraging a RocksDB based Key-Value store which consumes Nutanix Volumes for storage.
- Object Controller
- Built in-house, this is the data path engine that is responsible for managing object data and coordinating metadata updates with the Metadata Server. It interfaces with Stargate via the Storage Proxy API.
- Region Manager
- The Region Manager is responsible to managing all of the object storage information (e.g. Region) on DSF.
- Region
- A region provides the high-level mapping between an object and the corresponding locations on Nutanix vDisk(s). Similar to a vDisk ID, offset and length.
- Atlas Service
- The Atlas Service is based on the MapReduce framework and is responsible for object lifecycle policy enforcement, garbage collection, tiering and more.
- S3 Adapter
- Built in-house and all new in Objects 3.2, the S3 adapter provides the S3 API, handles authorization as well as API requests from S3 clients. These are then translated to the Object Controller and processed.
The figure shows a detailed view of the Objects service architecture:
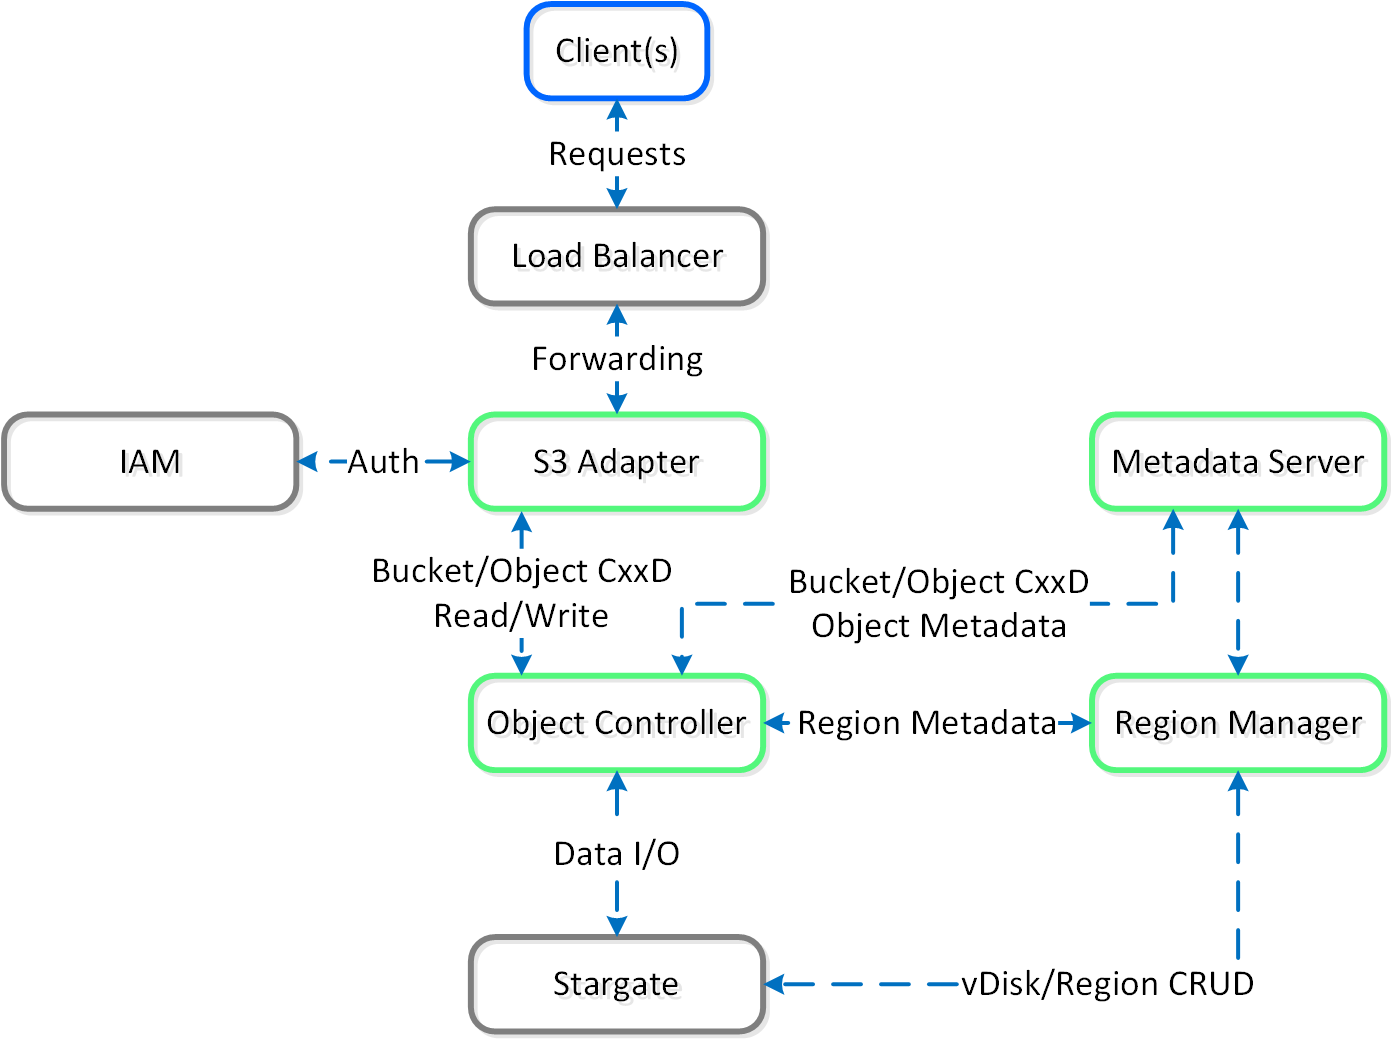 Objects - Architecture
The Objects specific components are highlighted in Nutanix Green. With objects there’s no concept of an “overwrite” hence the CxxD vs. CRUD (Create/Replace/Update/Delete). The commonly employed method for an object “overwrite” is to create a new revision or create a new object and point to the new object.
Note
Open Source Components
Nutanix Objects is built using a combination of organic innovation while also leveraging open source components. We believe this makes our products more robust and performant giving our customers the best solution for their business.
More Information on our Open Source License Disclosures: LINK
Object Storage and I/O
An object is stored in logical constructs called regions. A region is a fixed segment of space on a vDisk.
The figure shows an example of the relationship between a vDisk and region:
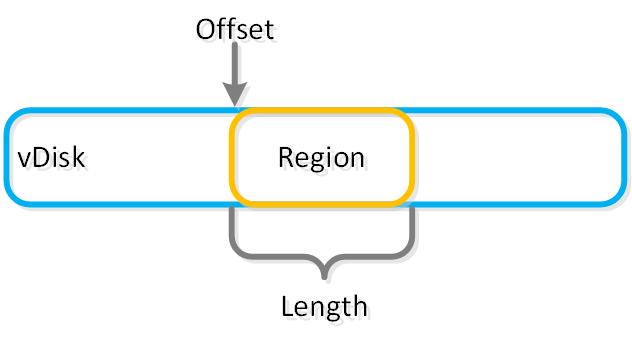 Objects - vDisk Region
Smaller objects may fit in a chunk of a single region (region id, offset, length), whereas larger objects may get striped across regions. When a large object is striped across multiple regions these regions can be hosted on multiple vDisks allowing multiple Stargates to be leveraged concurrently.
The figure shows an example of the relationship between a object, chunk and region:
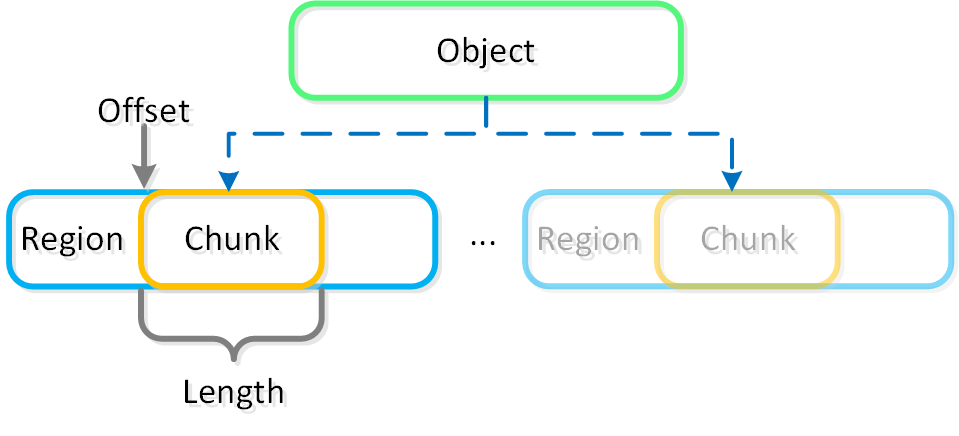 Objects - Object Chunk
The object services feature follows the same methodology for distribution as the Nutanix platform to ensure availability and scale. A minimum of 3 object VMs will be deployed as part of the Objects deployment.
Storage for Compute VMsLearn about AOS, the storage, compute, and virtualization platform that provides the core functionality leveraged by workloads and services on-premises, in the cloud, and at the edge.
» Download this section as PDF (opens in a new tab/window)
The Acropolis Operating System (AOS) provides the core functionality leveraged by workloads and services running on the platform. This includes, but isn’t limited to, things like storage services, upgrades, etc. Built on a foundation that doesn’t just manage resources—it optimizes them. AOS abstracts the complexity of hardware and hypervisors, using a distributed “Leader/Worker” model to ensure your workloads are always running on the best possible node without manual tuning. This translates to absolute workload mobility and proactive “hot spot” elimination through a dynamic scheduler that understands both compute and storage demands.
The figure highlights an image illustrating the conceptual nature of AOS at various layers:
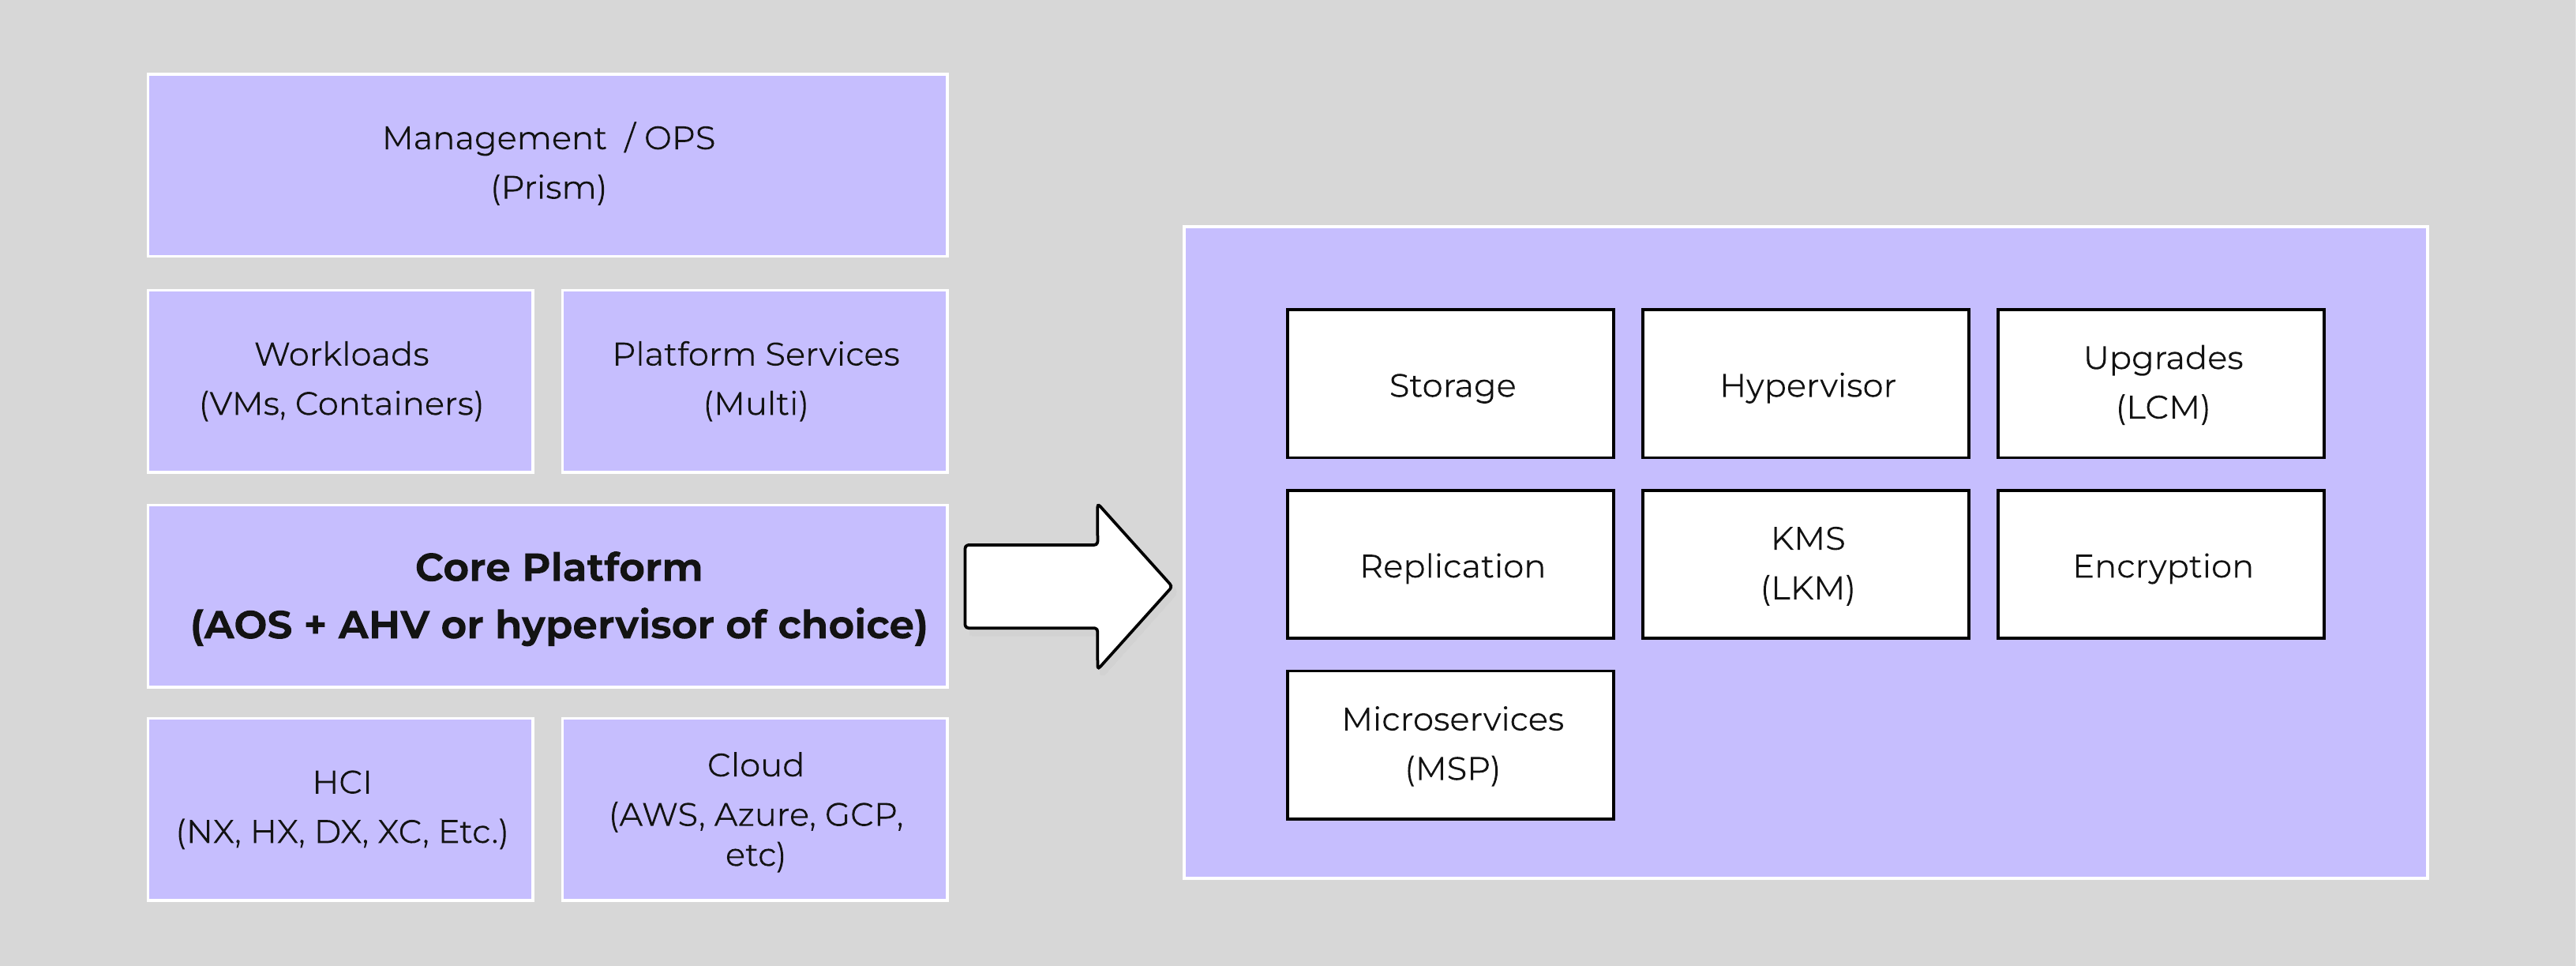 High-level AOS Architecture
Building upon the distributed nature of everything Nutanix does, we’re expanding this into the virtualization and resource management space. AOS is a back-end service that allows for workload and resource management, provisioning, and operations. Its goal is to abstract the facilitating resource (e.g., hypervisor, on-premises, cloud, etc.) from the workloads running, while providing a single “platform” to operate.
This gives workloads the ability to seamlessly move between hypervisors, cloud providers, and platforms.
Note
Supported Hypervisors for VM Management
AHV and ESXi are the supported hypervisors for VM management. The Volumes API and read-only operations are still supported on all.
Acropolis Services
An Acropolis Worker runs on every CVM with an elected Acropolis Leader which is responsible for task scheduling, execution, IPAM, etc. Similar to other components which have a Leader, if the Acropolis Leader fails, a new one will be elected.
The role breakdown for each can be seen below:
- Acropolis Leader
- Task scheduling & execution
- Stat collection / publishing
- Network Controller (for hypervisor)
- VNC proxy (for hypervisor)
- HA (for hypervisor)
- Acropolis Worker
- Stat collection / publishing
- VNC proxy (for hypervisor)
Here we show a conceptual view of the Acropolis Leader / Worker relationship:
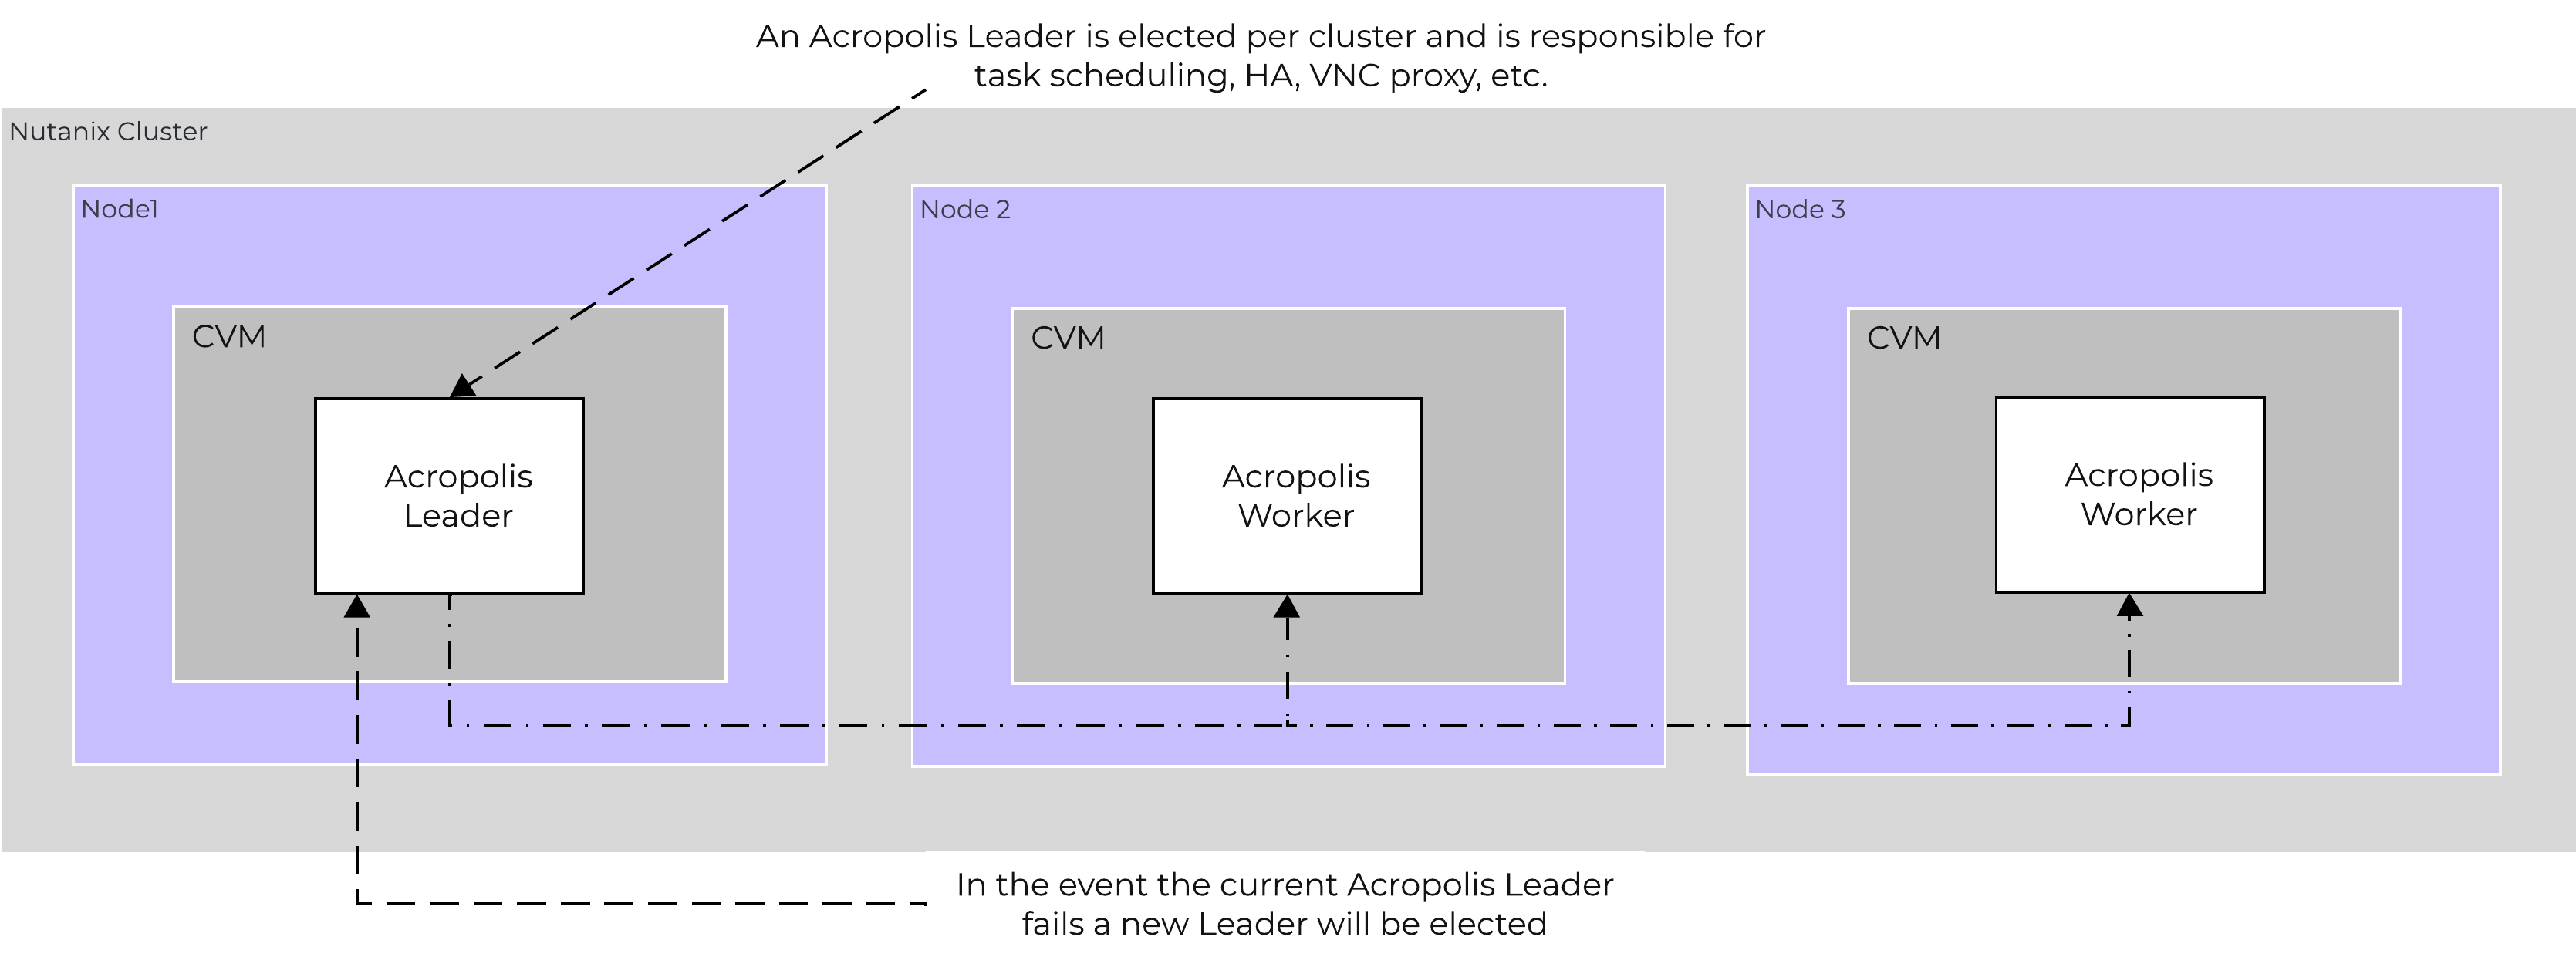 Acropolis Services
Dynamic Scheduler
Efficient scheduling of resources is critical to ensure resources are effectively consumed. The AOS Dynamic Scheduler extends the traditional means of scheduling that relies upon compute utilization (CPU/MEM) to make placement decisions. It leverages compute, as well as storage and other statisctical data to drive VM and volume (ABS) placement decisions. This ensures that resources are effectively consumed and end-user performance is optimal.
Resource scheduling can be broken down into two key areas:
- Initial placement
- Where an item is scheduled at power-on
- Runtime Optimization
- Movement of workloads based upon runtime metrics
The figure shows a high-level view of the scheduler architecture:
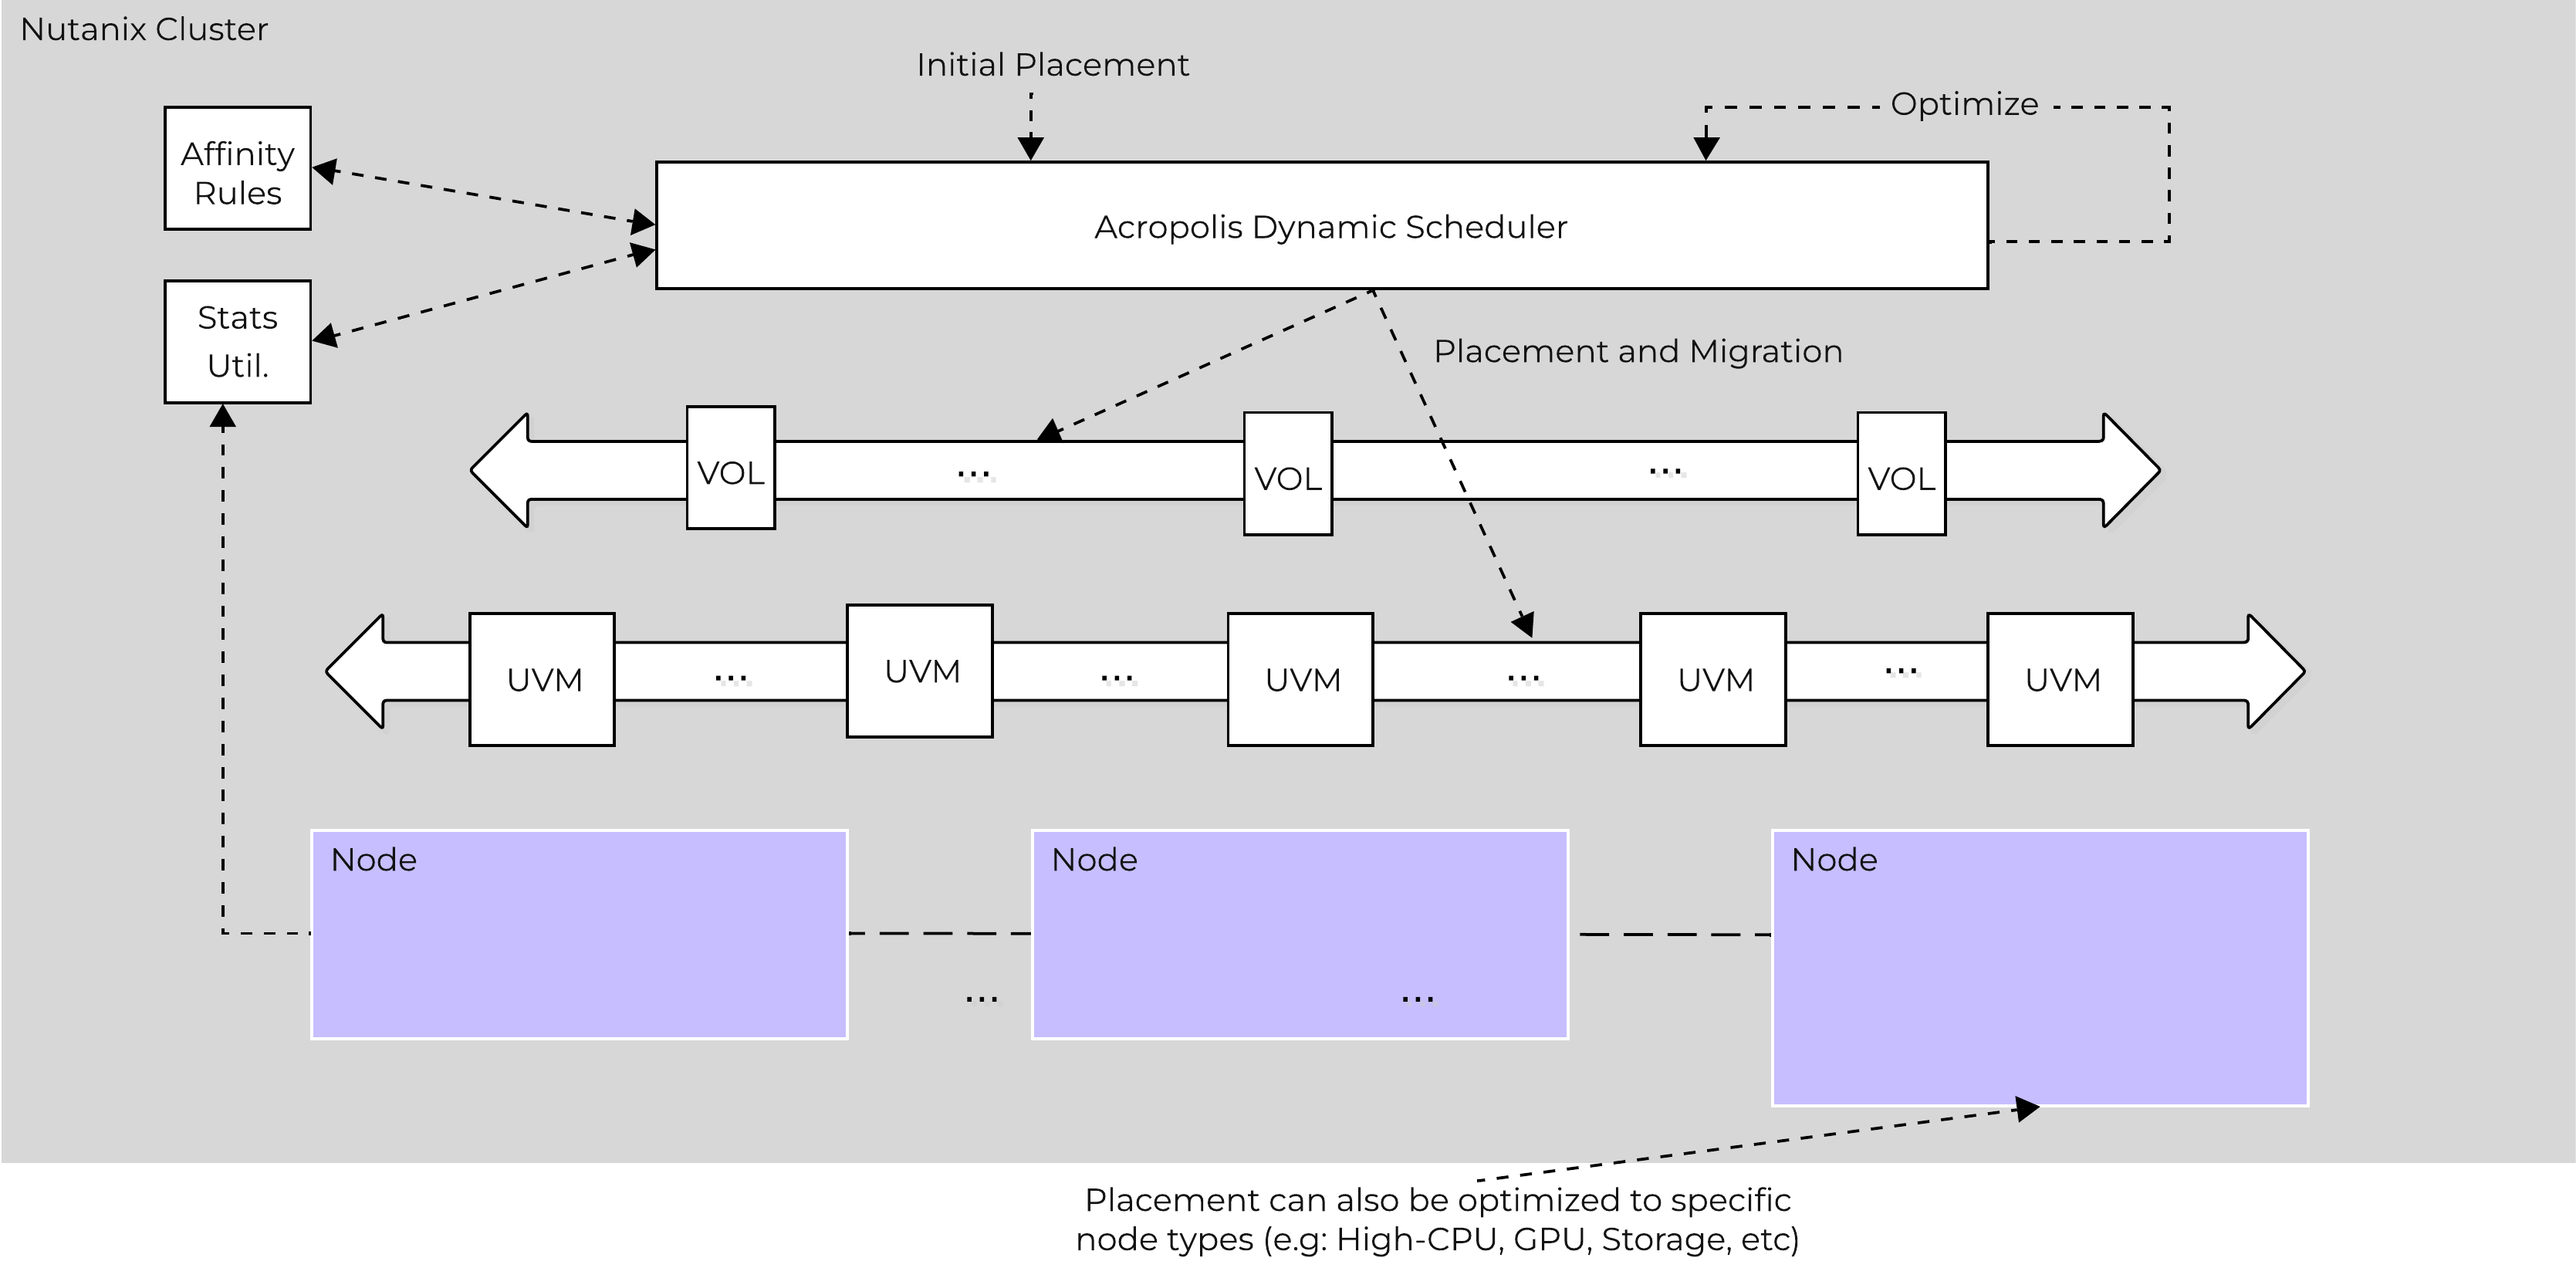 AOS Dynamic Scheduler
| The dynamic scheduler runs consistently throughout the day to optimize placement (currently every 15 minutes | Gflag: lazan_anomaly_detection_period_secs). Estimated demand is calculated using historical utilization values and fed into a smoothing algorithm. This estimated demand is what is used to determine movement, which ensures a sudden spike will not skew decisions. |
Note
A different approach towards resource optimization
Conventional cluster schedulers were generally focused on the principle of evenly spreading workloads across available resourecs to achieve balance. NOTE: how aggressively it tries to eliminate skew is determined by the balancing configuration (e.g. manual -> none, conservative -> some, aggressive -> more).
For example, say we had 3 hosts in a cluster, each of which is utilized 50%, 5%, 5% respectively. Typical solutions would try to re-balance workloads to get each hosts utilization ~20%. But why?
What we're really trying to do is eliminate / negate any contention for resources, not eliminate skew. Unless there is contention for resources there is no positive gain from "balancing" workloads. In fact by forcing unnecessary movement it can cause additional requisite work (e.g. memory transfer, cache re-localization, etc.), all of which consumes resources.
The AOS Dynamic Scheduler focuses more on alleviating hot spots. It will only invoke workload movement if there is expected contention for resources, not because of skew. NOTE: DSF works in a different way and works to ensure uniform distribution of data throughout the cluster to eliminate hot spots and speed up rebuilds. To learn more of DSF, check out the 'disk balancing' section.
At power-on ADS will balance VM initial placement throughout the cluster.
Placement Decisions
Placement decisions are based upon the following items:
- Compute utilization
-
We monitor each individual node’s compute utilization. In the event where a node’s expected CPU allocation breaches its threshold (currently 85% of host CPU Gflag: lazan_host_cpu_usage_threshold_fraction) we will migrate VMs off those host(s) to re-balance the workload. A key thing to mention here is a migration will only be performed when there is contention. If there is skew in utilization between nodes (e.g. 3 nodes at 10% and 1 at 50%) we will not perform a migration as there is no benefit from doing so until there is contention for resources.
-
- Storage performance
-
Being a hyperconverged platform we manage both compute and storage resources. The scheduler will monitor each node’s Stargate process utilization. In the event where certain Stargate(s) breach their allocation threshold (currently 85% of CPU allocated to Stargate Gflag: lazan_stargate_cpu_usage_threshold_pct) , we will migrate resources across hosts to eliminate any hot spots. Both VMs and ABS Volumes can be migrated to eliminate any hot Stargates.
-
- [Anti-]Affinity rules
- Affinity or Anti-affinity constraints determine where certain resources are scheduled based upon other resources in the environment. In certain cases you want VMs to run on the same node for licensing reasons. In this case the VMs would be affined to the same host. In other cases you might want to ensure VMs run on different nodes for availability purposes. In this case the VMs would be anti-affined.
The scheduler will make its best effort to optimize workload placement based upon the prior items. The system places a penalty on movement to ensure not too many migrations are taking place. This is a key item as we want to make sure the movement doesn’t have any negative impacts on the workload.
After a migration the system will judge its “effectiveness” and see what the actual benefit is. This learning model can self-optimize to ensure there is a valid basis for any migration decision.
Storage Tiering and Prioritization
The Disk Balancing section below talks about how storage capacity was pooled among all nodes in a Nutanix cluster and that ILM would be used to keep hot data local. A similar concept applies to disk tiering, in which the cluster’s SSD and HDD tiers are cluster-wide and AOS ILM is responsible for triggering data movement events. A local node’s SSD tier is always the highest priority tier for all I/O generated by VMs running on that node, however all of the cluster’s SSD resources are made available to all nodes within the cluster. The SSD tier will always offer the highest performance and is a very important thing to manage for hybrid arrays.
The tier prioritization can be classified at a high-level by the following:
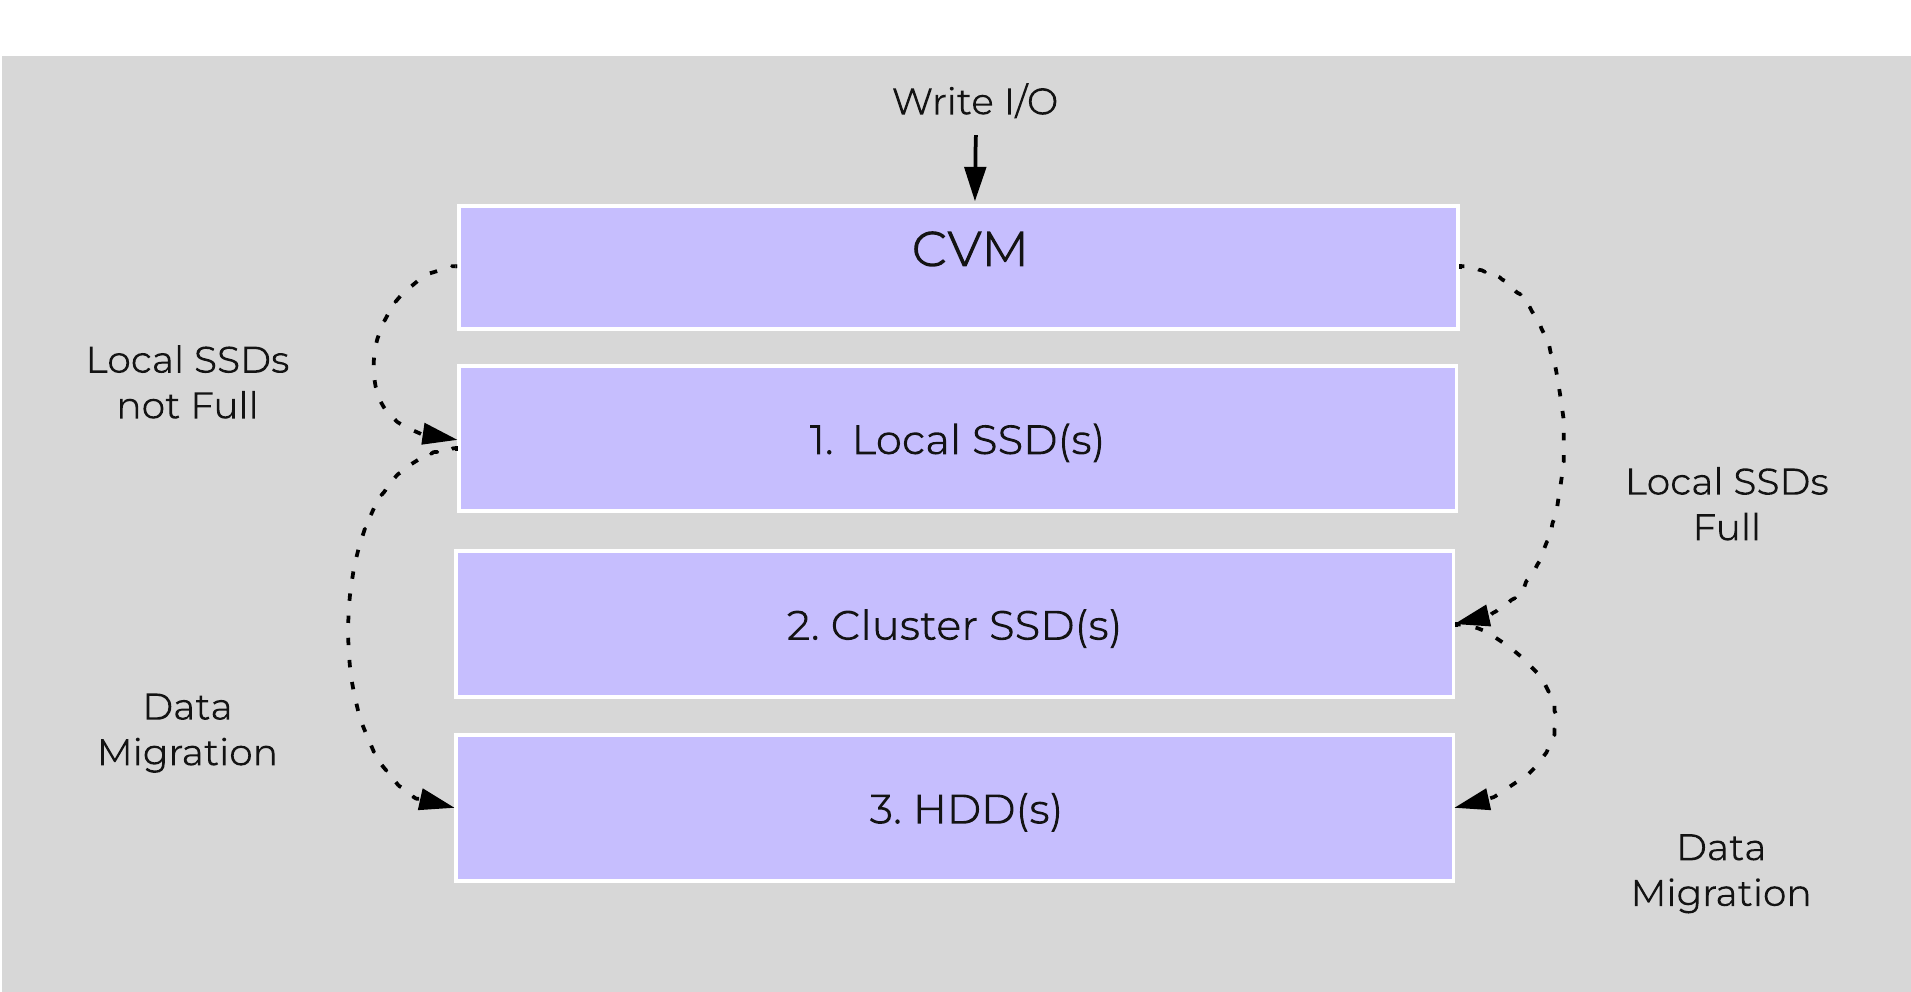 AOS Tier Prioritization
Specific types of resources (e.g. SSD, HDD, etc.) are pooled together and form a cluster wide storage tier. This means that any node within the cluster can leverage the full tier capacity, regardless if it is local or not.
The following figure shows a high level example of what this pooled tiering looks like:
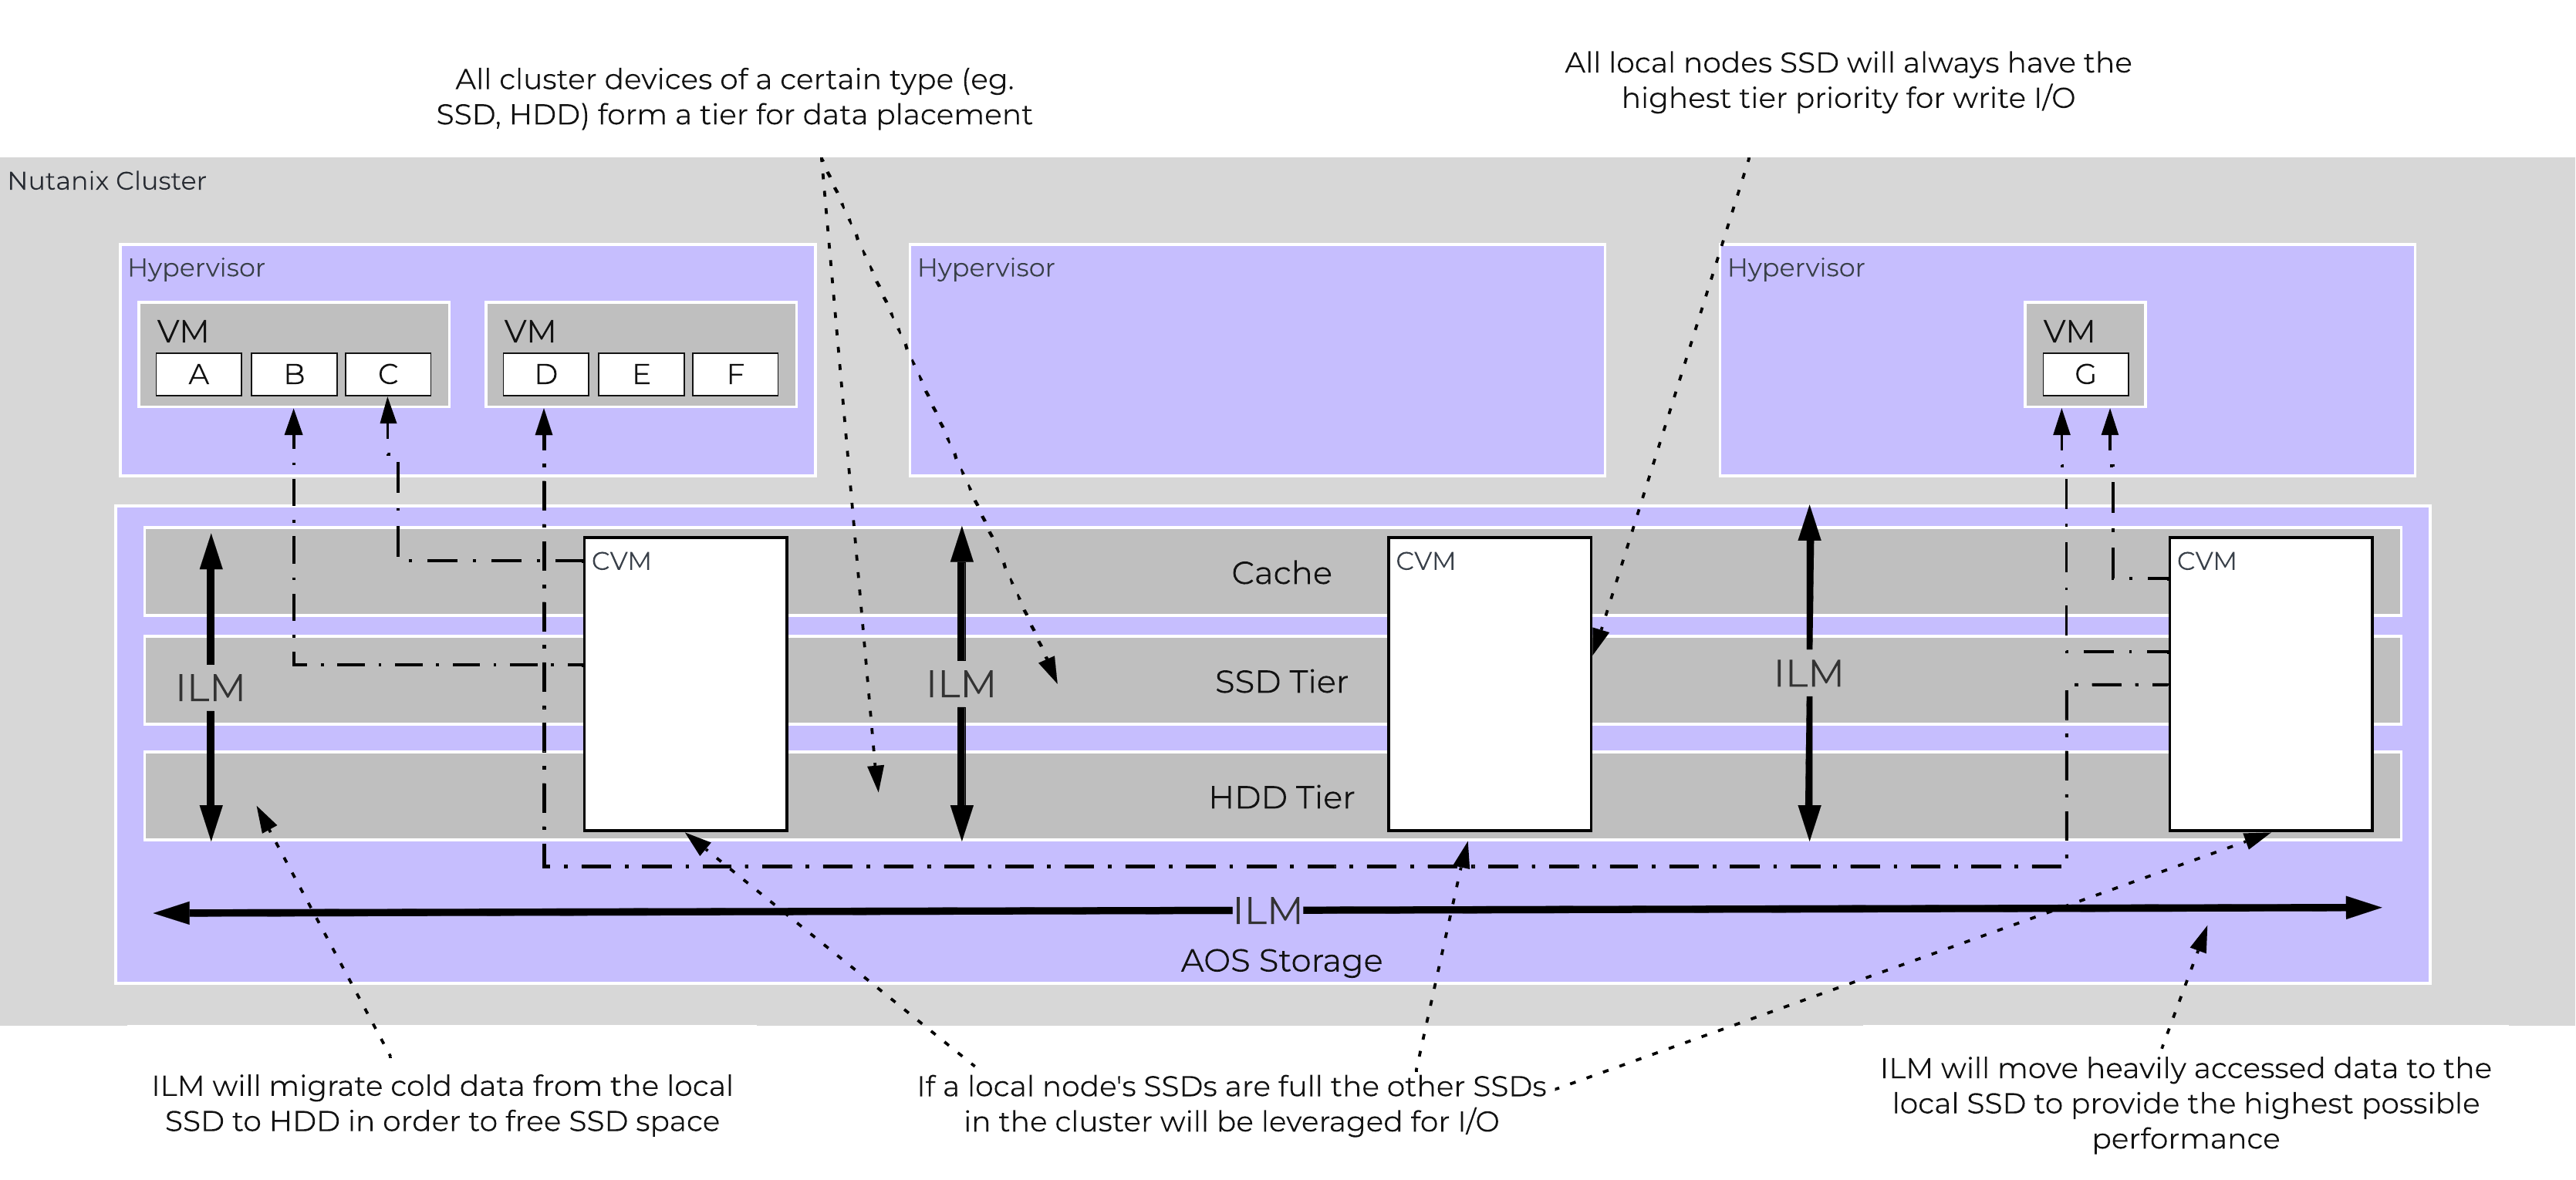 AOS Cluster-wide Tiering
A common question is what happens when a local node’s SSD becomes full? As mentioned in the Disk Balancing section, a key concept is trying to keep uniform utilization of devices within disk tiers. In the case where a local node’s SSD utilization is high, disk balancing will kick in to move the coldest data on the local SSDs to the other SSDs throughout the cluster. This will free up space on the local SSD to allow the local node to write to SSD locally instead of going over the network. A key point to mention is that all CVMs and SSDs are used for this remote I/O to eliminate any potential bottlenecks and remediate some of the hit by performing I/O over the network.
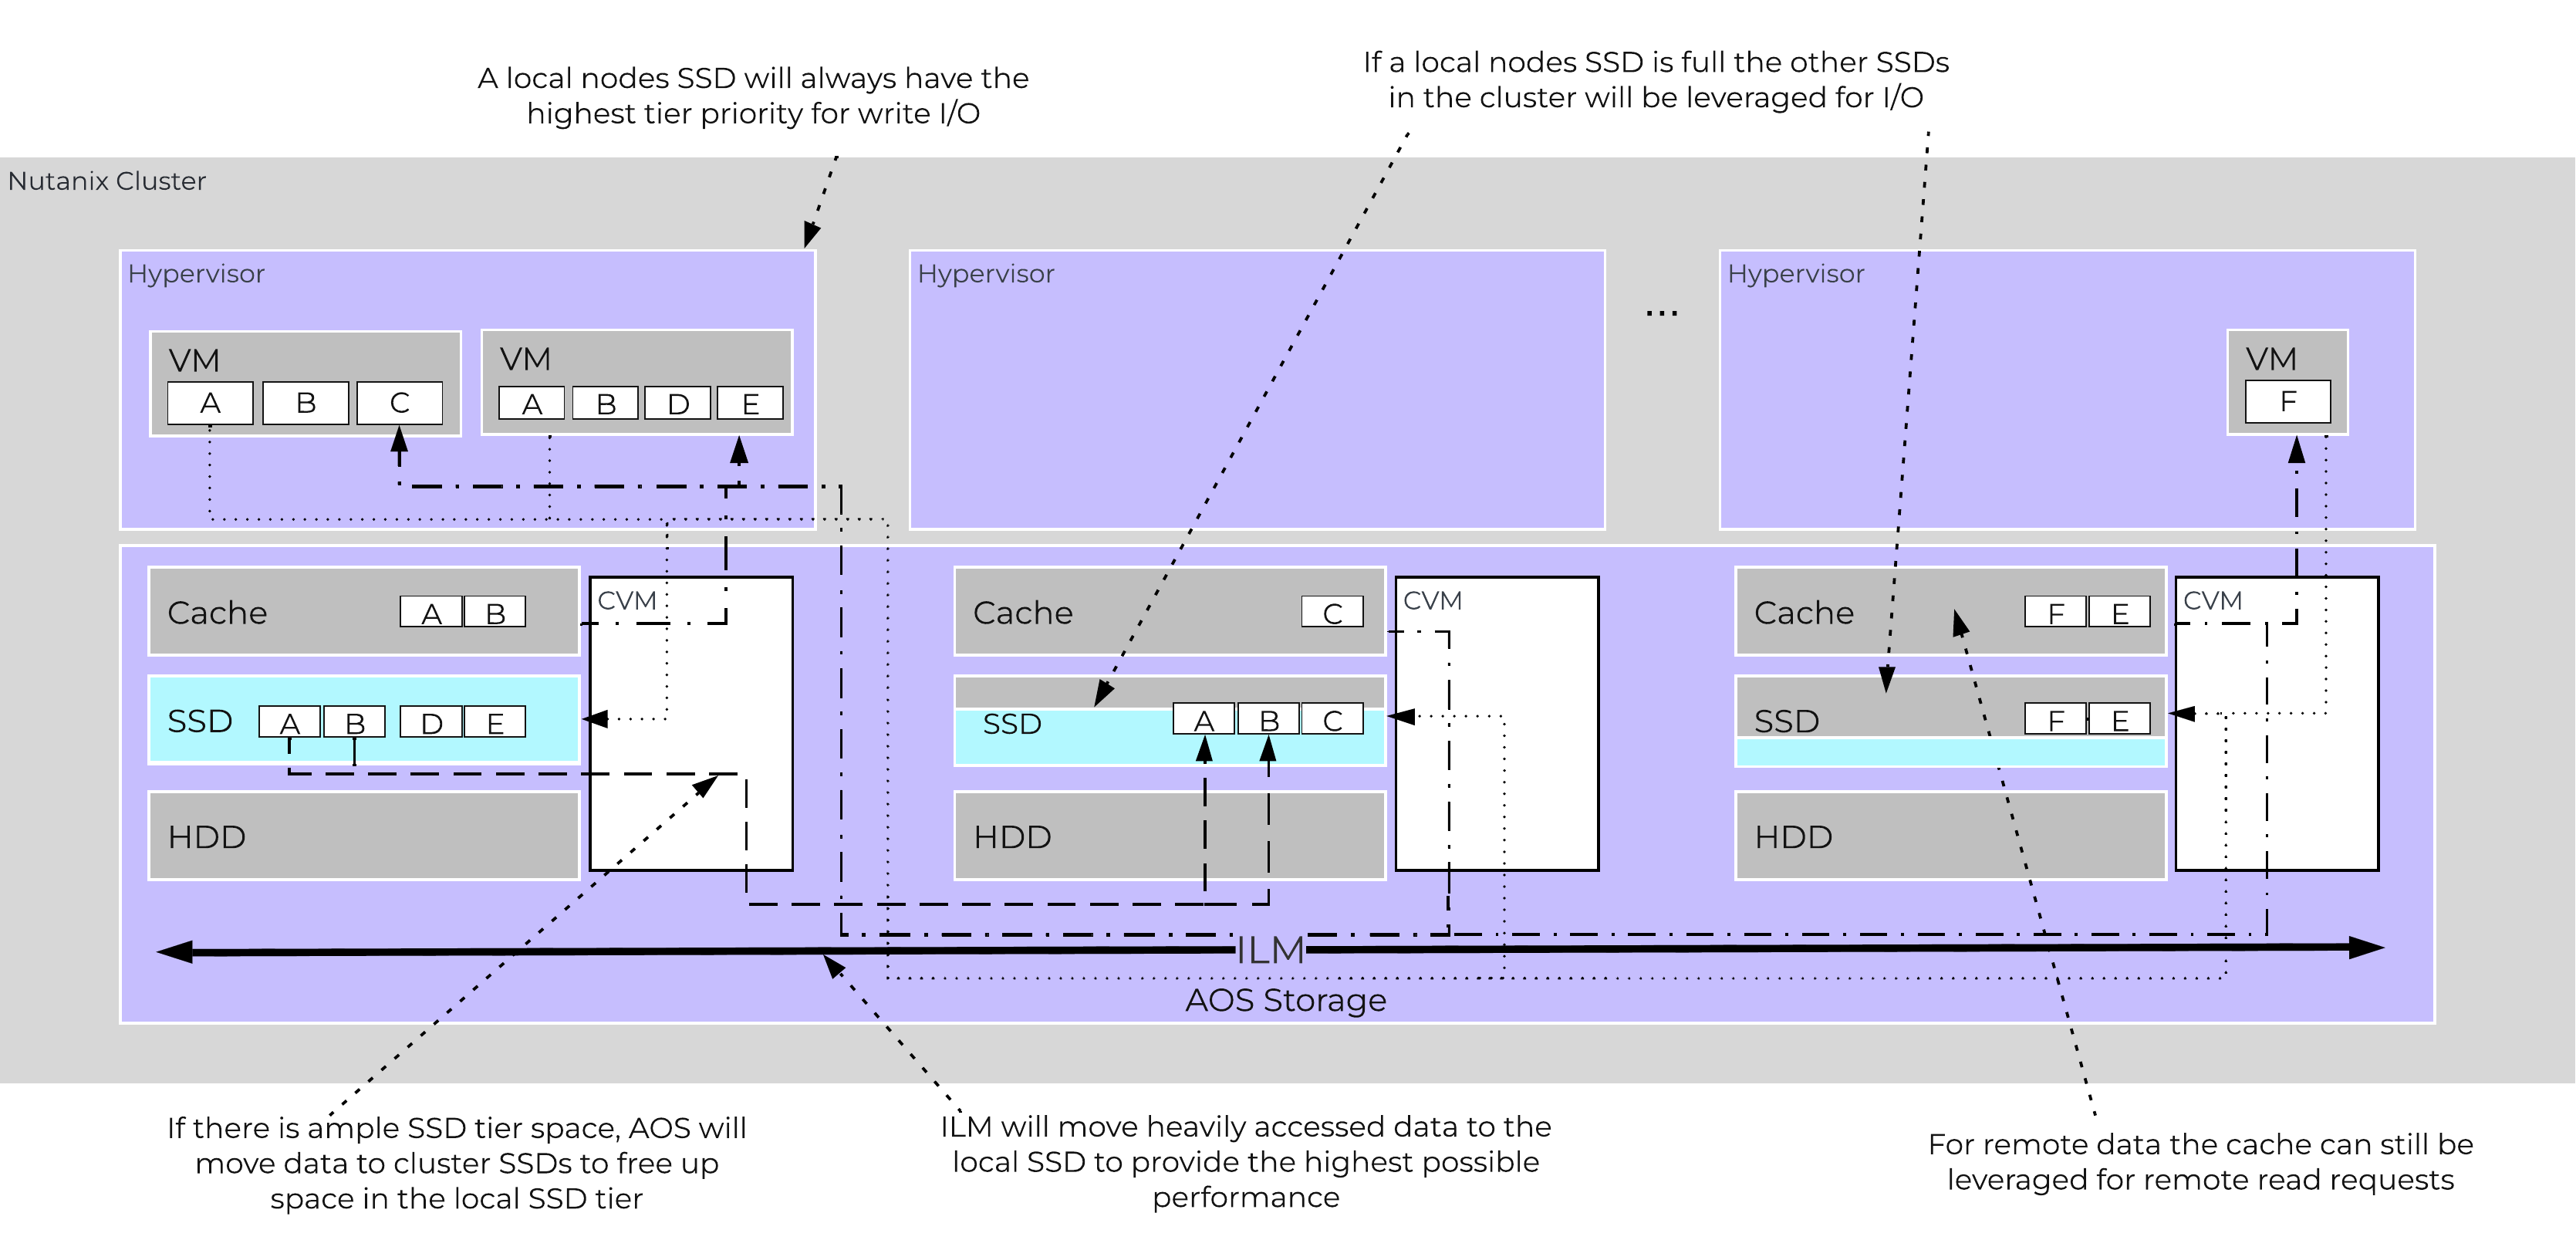 AOS Cluster-wide Tier Balancing
The other case is when the overall tier utilization breaches a specific threshold [curator_tier_usage_ilm_threshold_percent (Default=75)] where AOS ILM will kick in and as part of a Curator job will down-migrate data from the SSD tier to the HDD tier. This will bring utilization within the threshold mentioned above or free up space by the following amount [curator_tier_free_up_percent_by_ilm (Default=15)], whichever is greater. The data for down-migration is chosen using last access time. In the case where the SSD tier utilization is 95%, 20% of the data in the SSD tier will be moved to the HDD tier (95% –> 75%).
However, if the utilization was 80%, only 15% of the data would be moved to the HDD tier using the minimum tier free up amount.
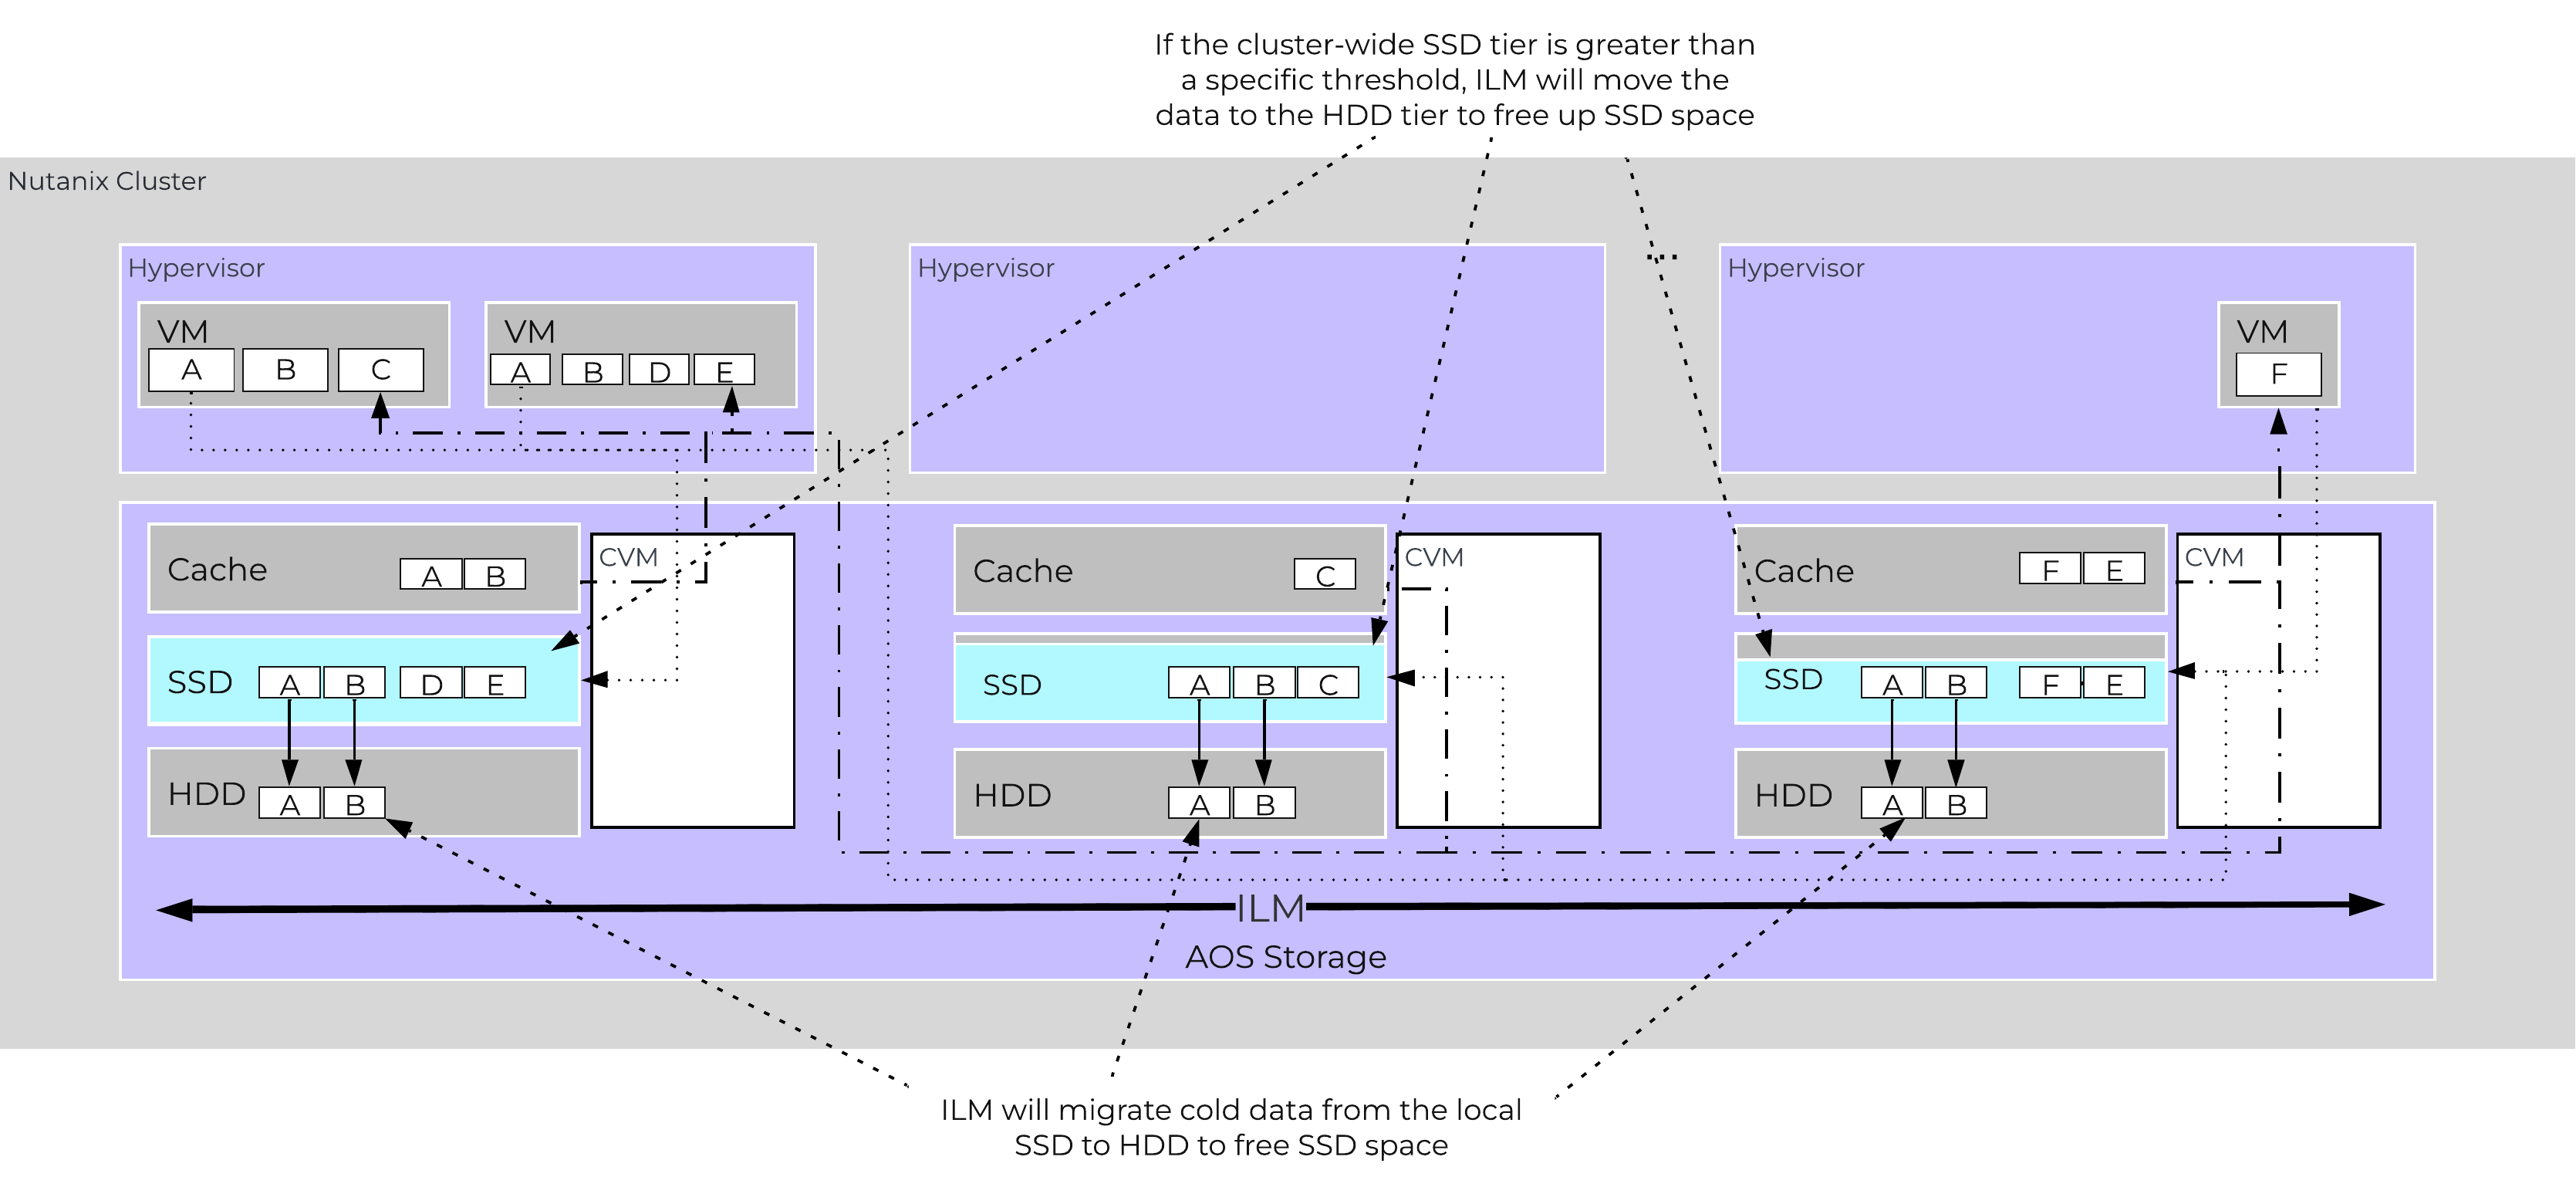 AOS Tier ILM
AOS ILM will constantly monitor the I/O patterns and (down/up) migrate data as necessary as well as bring the hottest data local regardless of tier. The logic for up-migration (or horizontal) follows the same as that defined for egroup locality: “3 touches for random or 10 touches for sequential within a 10 minute window where multiple reads every 10 second sampling count as a single touch”.
Disk Balancing
For a visual explanation, you can watch the following video: LINK
AOS is designed to be a very dynamic platform which can react to various workloads as well as allow heterogeneous node types: compute heavy (3155, 9151, etc.) and storage heavy (8150, etc.) to be mixed in a single cluster. Ensuring uniform distribution of data is an important item when mixing nodes with larger storage capacities. AOS has a native feature, called disk balancing, which is used to ensure uniform distribution of data throughout the cluster. Disk balancing works on a node’s utilization of its local storage capacity and is integrated with AOS ILM. Its goal is to keep utilization uniform among nodes once the utilization has breached a certain threshold.
NOTE: Disk balancing jobs are handled by Curator which has different priority queues for primary I/O (UVM I/O) and background I/O (e.g. disk balancing). This is done to ensure disk balancing or any other background activity doesn’t impact front-end latency / performance. In this cases the job’s tasks will be given to Chronos who will throttle / control the execution of the tasks. Also, movement is done within the same tier for disk balancing. For example, if data is skewed in the HDD tier, it can be moved amongst nodes in the same tier.
The following figure shows an example of a mixed cluster (3060 + 8150) in an “unbalanced” state:
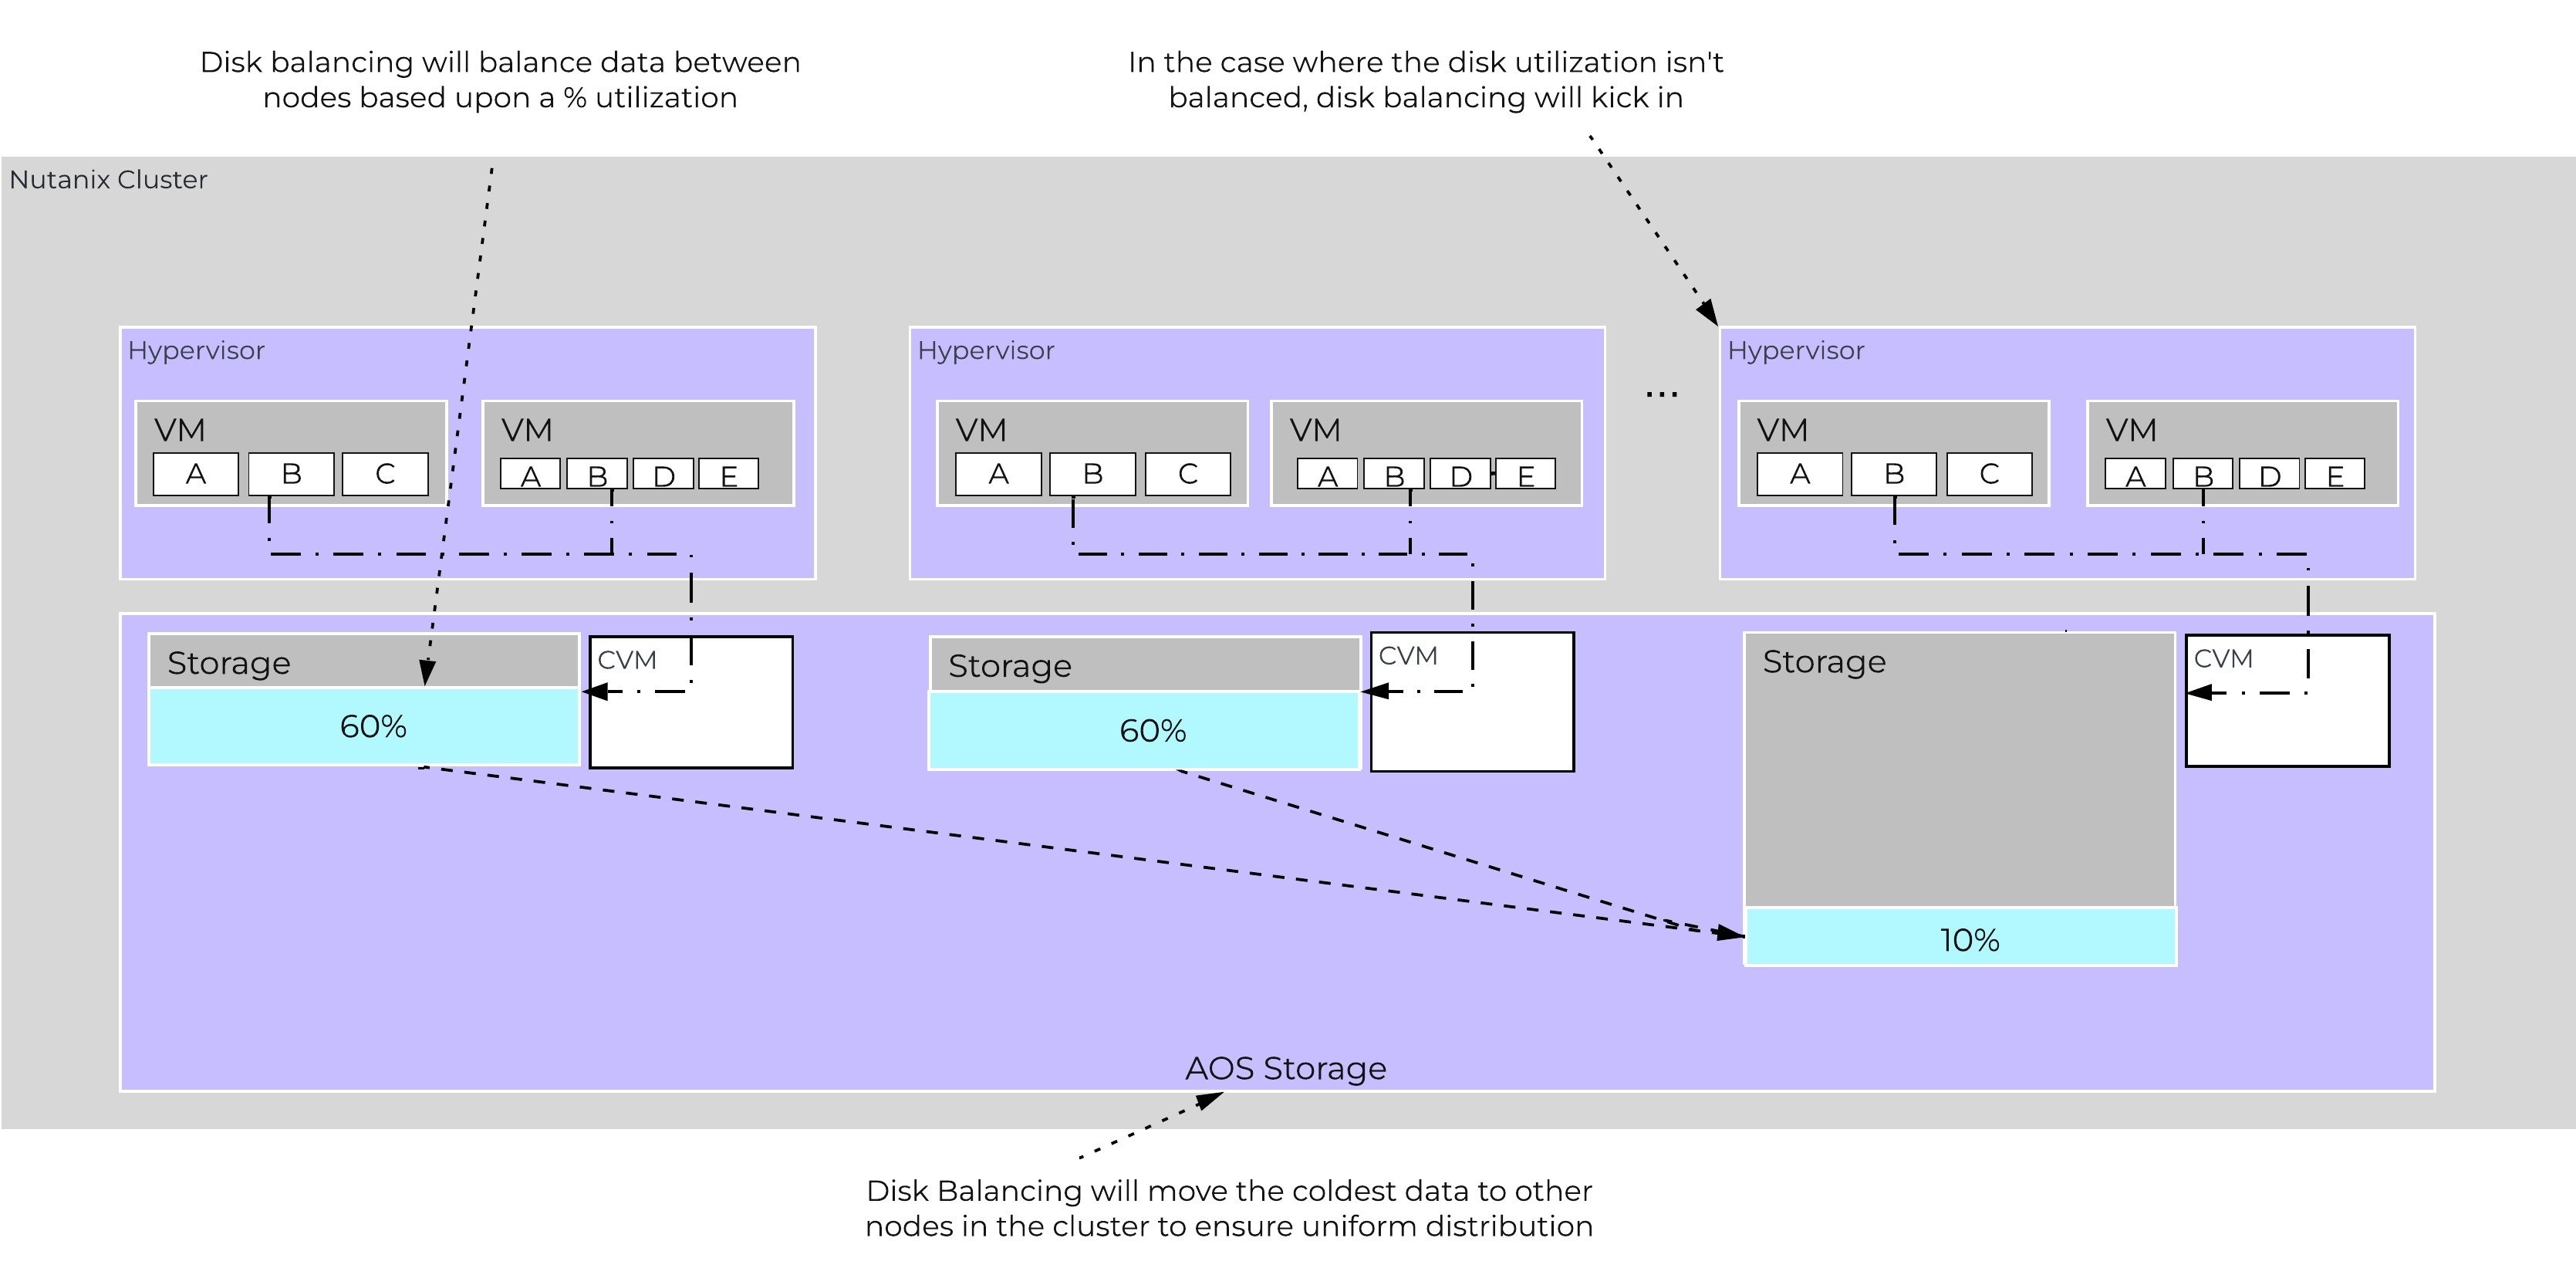 Disk Balancing - Unbalanced State
Disk balancing leverages the AOS Curator framework and is run as a scheduled process as well as when a threshold has been breached (e.g., local node capacity utilization > n %). In the case where the data is not balanced, Curator will determine which data needs to be moved and will distribute the tasks to nodes in the cluster. In the case where the node types are homogeneous (e.g., 3060), utilization should be fairly uniform. However, if there are certain VMs running on a node which are writing much more data than others, this can result in a skew in the per node capacity utilization. In this case, disk balancing would run and move the coldest data on that node to other nodes in the cluster. In the case where the node types are heterogeneous (e.g., 3060 + 8150/55/70), or where a node may be used in a “storage only” mode (not running any VMs), there will likely be a requirement to move data.
The following figure shows an example the mixed cluster after disk balancing has been run in a “balanced” state:
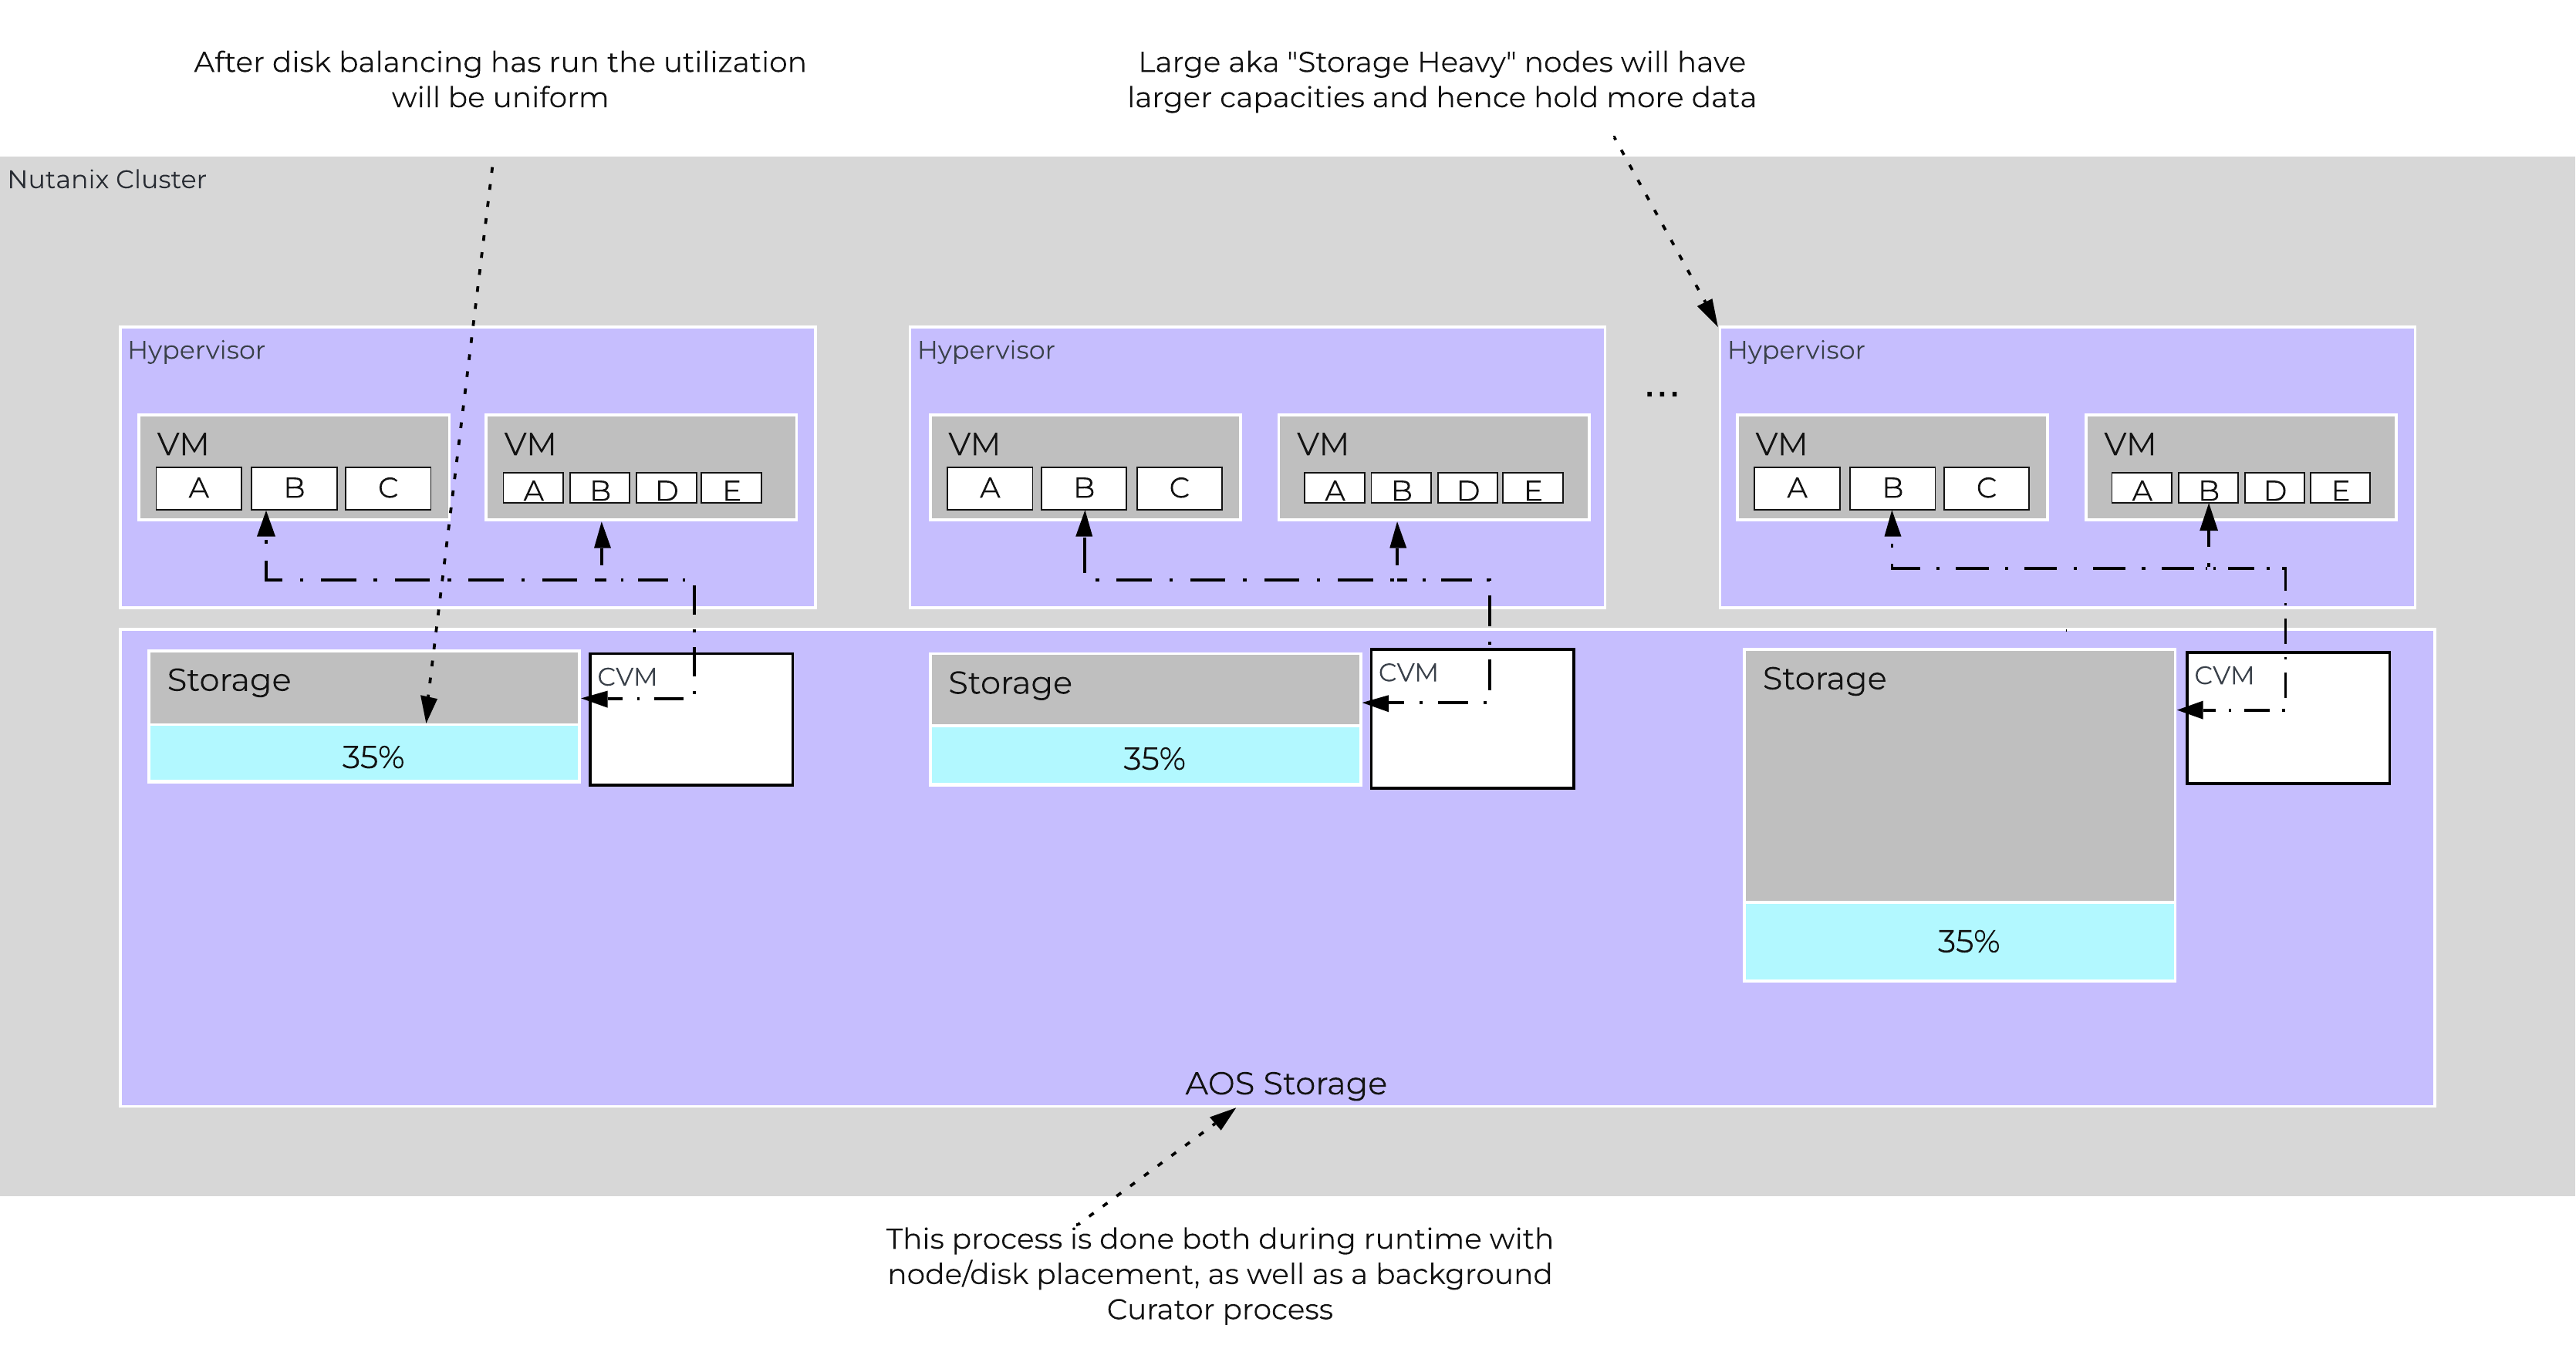 Disk Balancing - Balanced State
In some scenarios, customers might run some nodes in a “storage-only” state where only the CVM will run on the node whose primary purpose is bulk storage capacity. In this case, the full node’s memory can be added to the CVM to provide a much larger read cache.
The following figure shows an example of how a storage only node would look in a mixed cluster with disk balancing moving data to it from the active VM nodes:
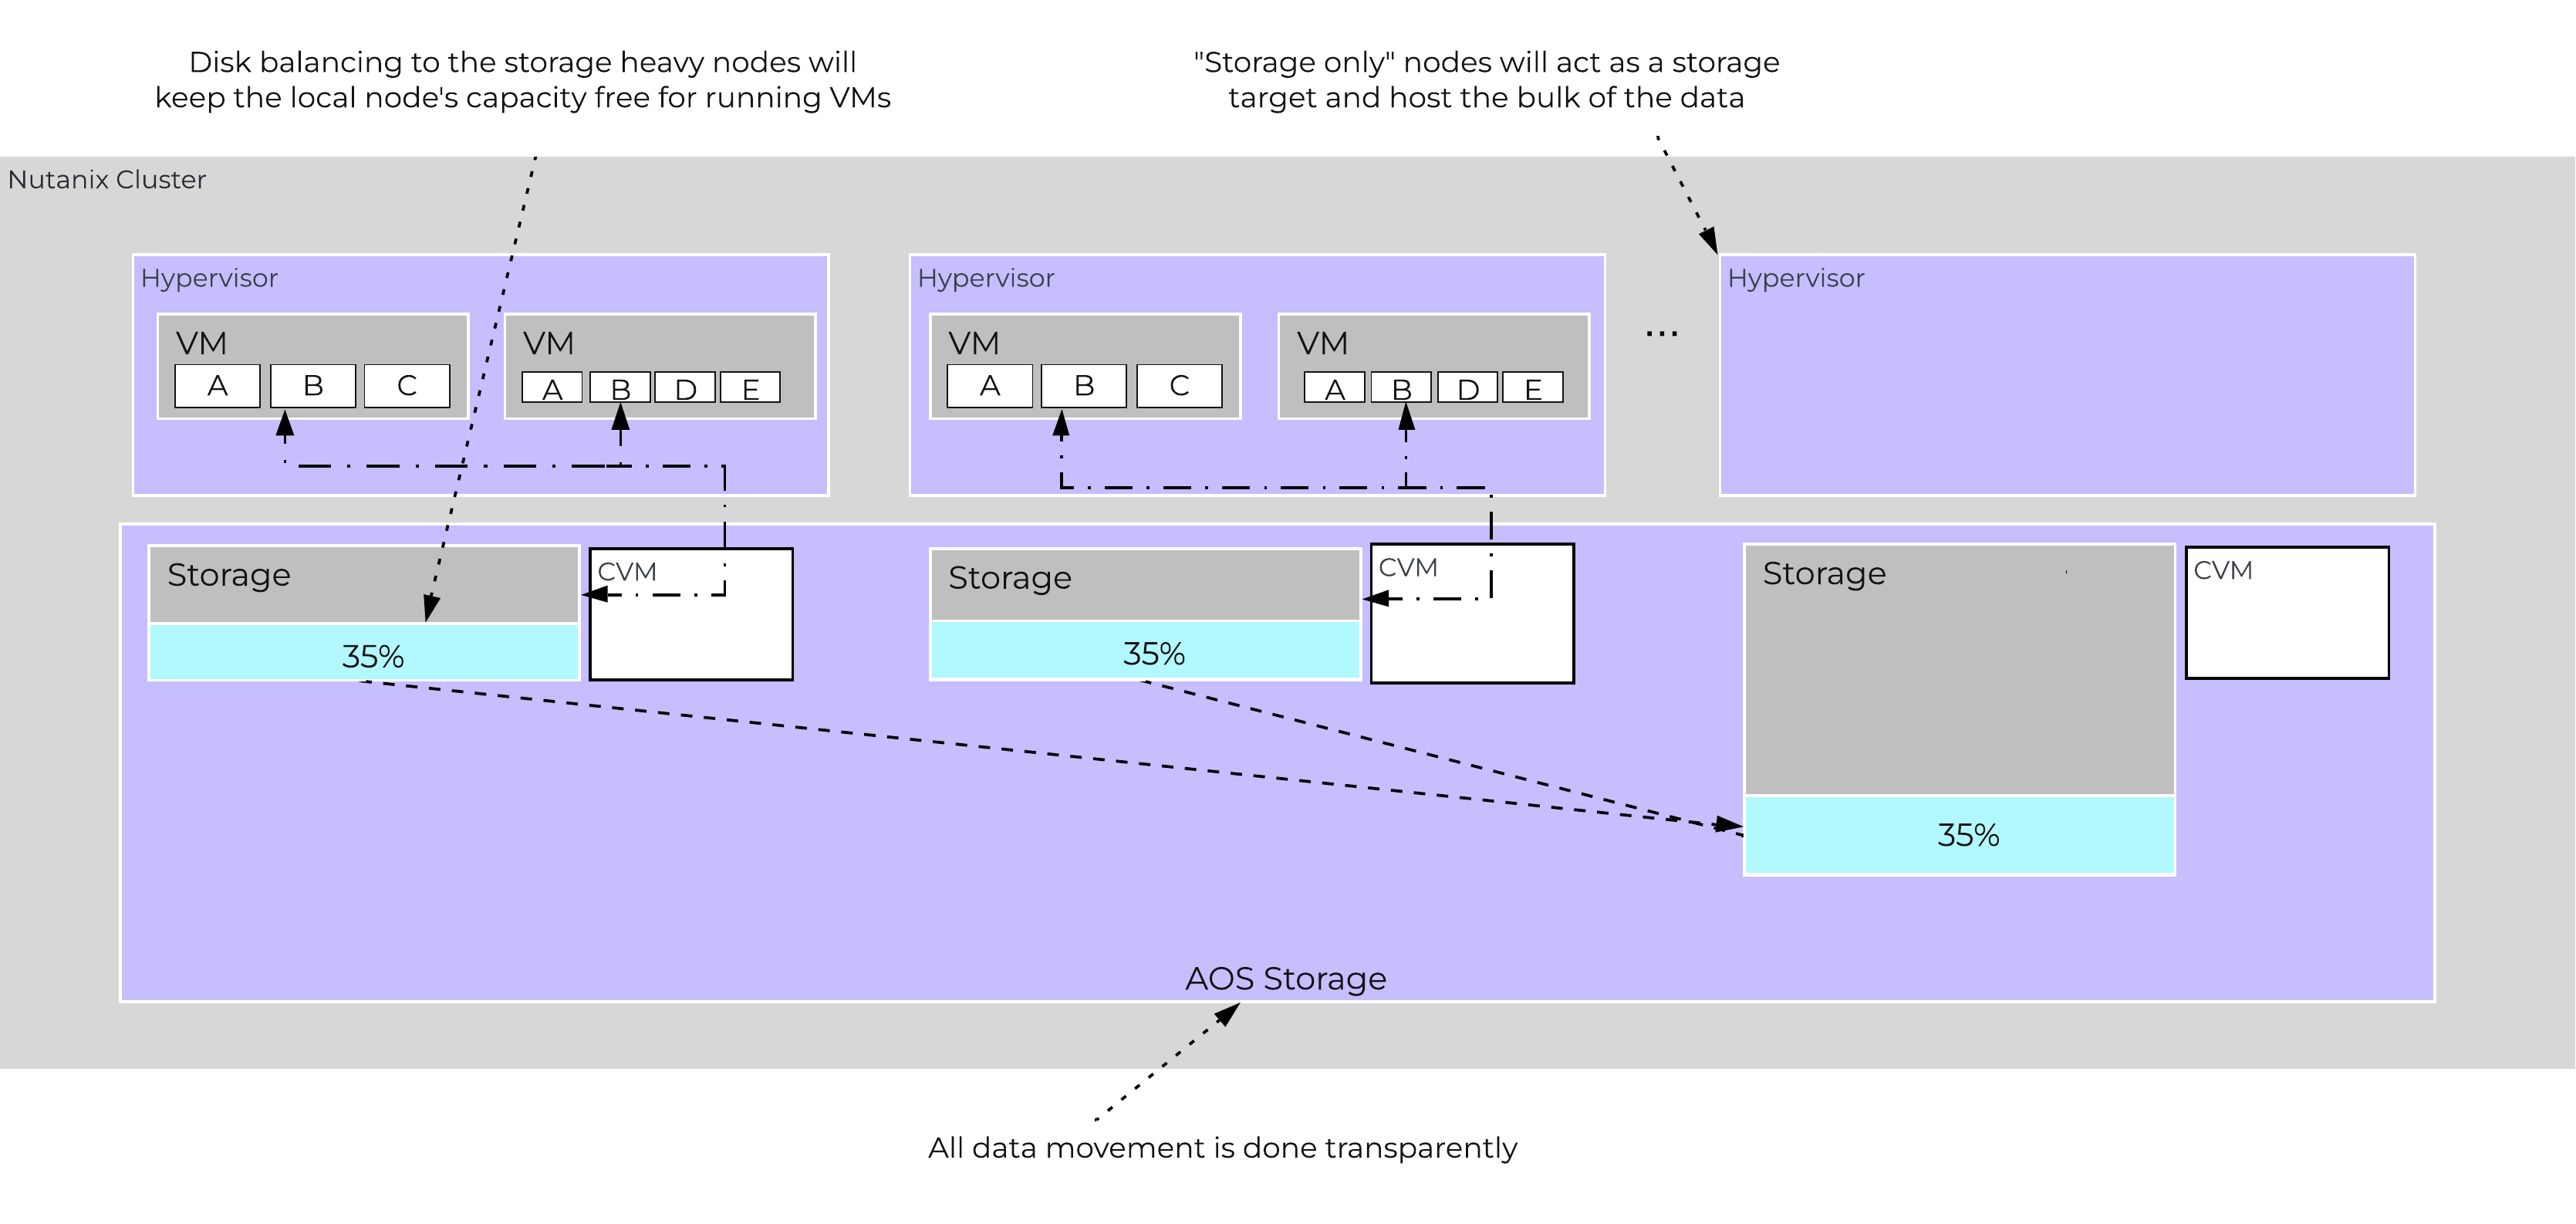 Disk Balancing - Storage Only Node
Snapshots and Clones
For a visual explanation, you can watch the following video: LINK
AOS provides native support for offloaded snapshots and clones which can be leveraged via VAAI, ODX, ncli, REST, Prism, etc. Both the snapshots and clones leverage the redirect-on-write algorithm which is the most effective and efficient. As explained in the Data Structure section above, a virtual machine consists of files (vmdk/vhdx) which are vDisks on the Nutanix platform.
A vDisk is composed of extents which are logically contiguous chunks of data, which are stored within extent groups which are physically contiguous data stored as files on the storage devices. When a snapshot or clone is taken, the base vDisk is marked immutable and another vDisk is created as read/write. At this point, both vDisks have the same block map, which is a metadata mapping of the vDisk to its corresponding extents. Contrary to traditional approaches which require traversal of the snapshot chain (which can add read latency), each vDisk has its own block map. This eliminates any of the overhead normally seen by large snapshot chain depths and allows you to take continuous snapshots without any performance impact.
The following figure shows an example of how this works when a snapshot is taken (source: NTAP):
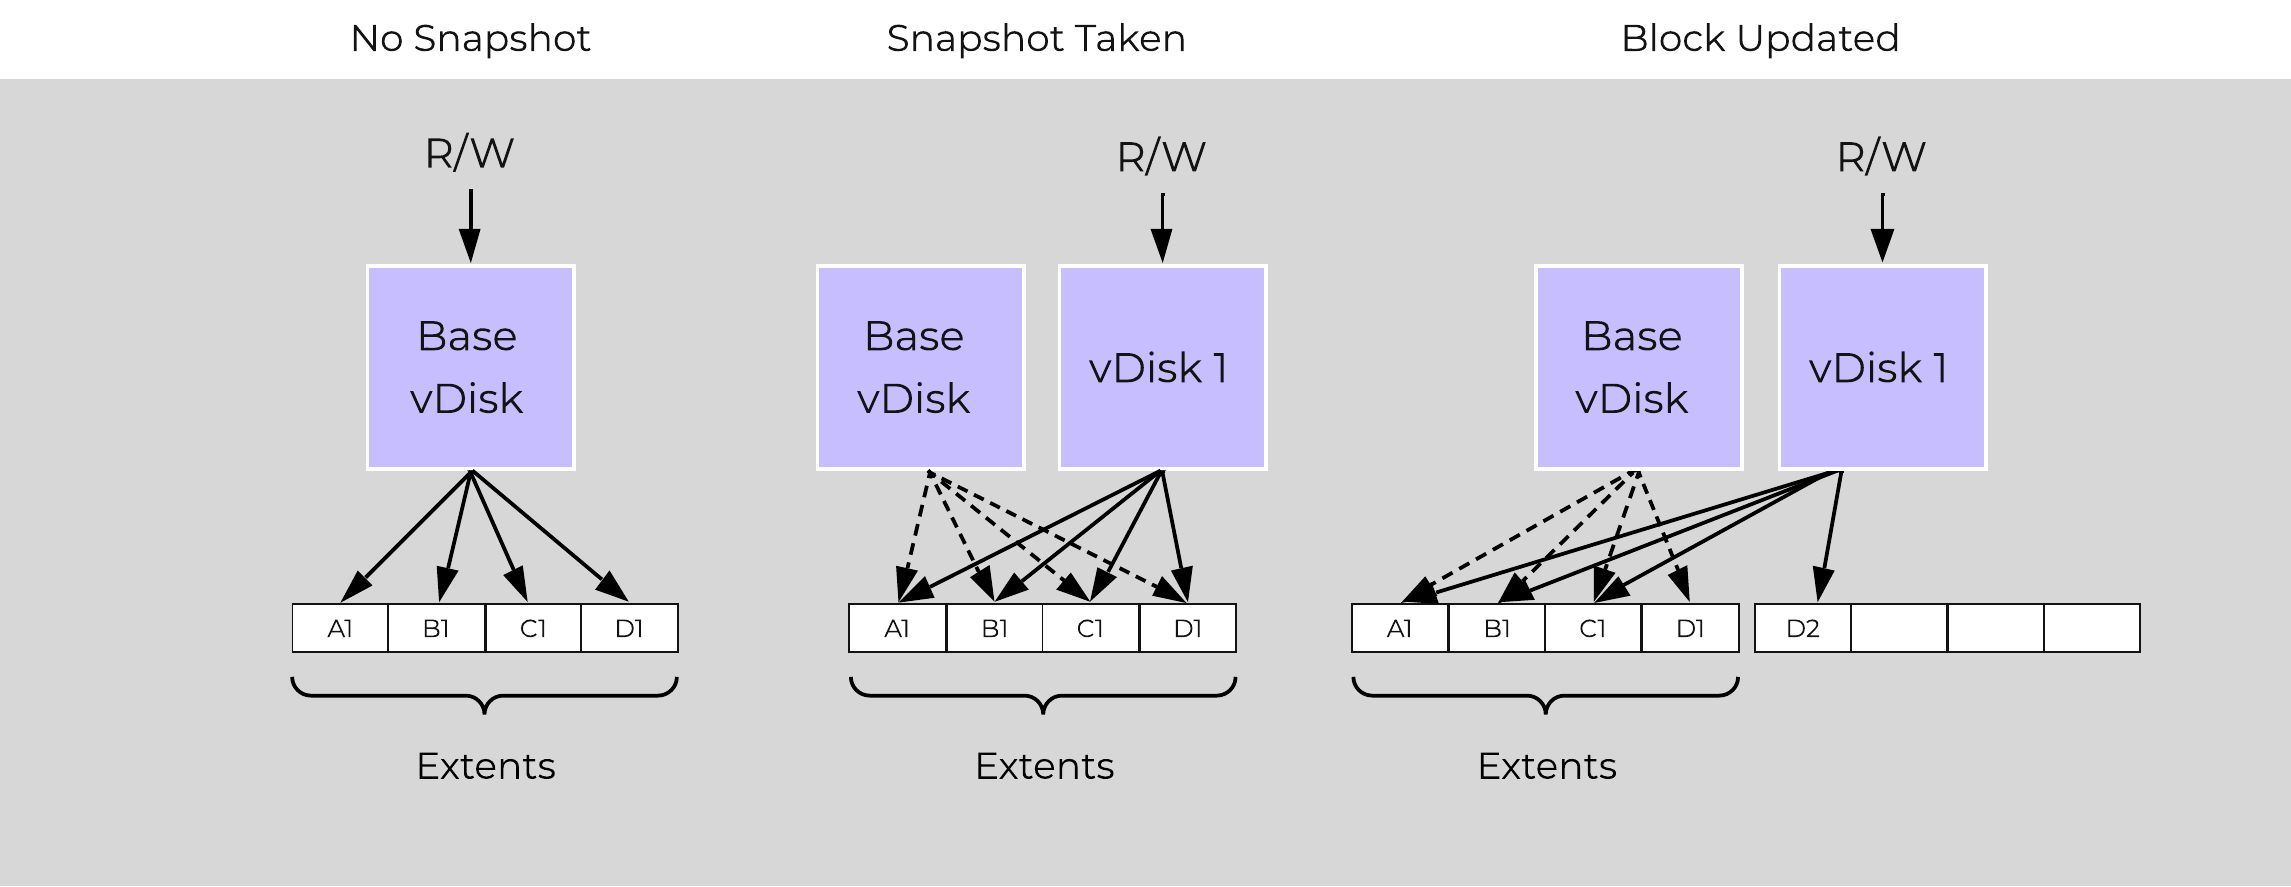 Example Snapshot Block Map
The same method applies when a snapshot or clone of a previously snapped or cloned vDisk is performed:
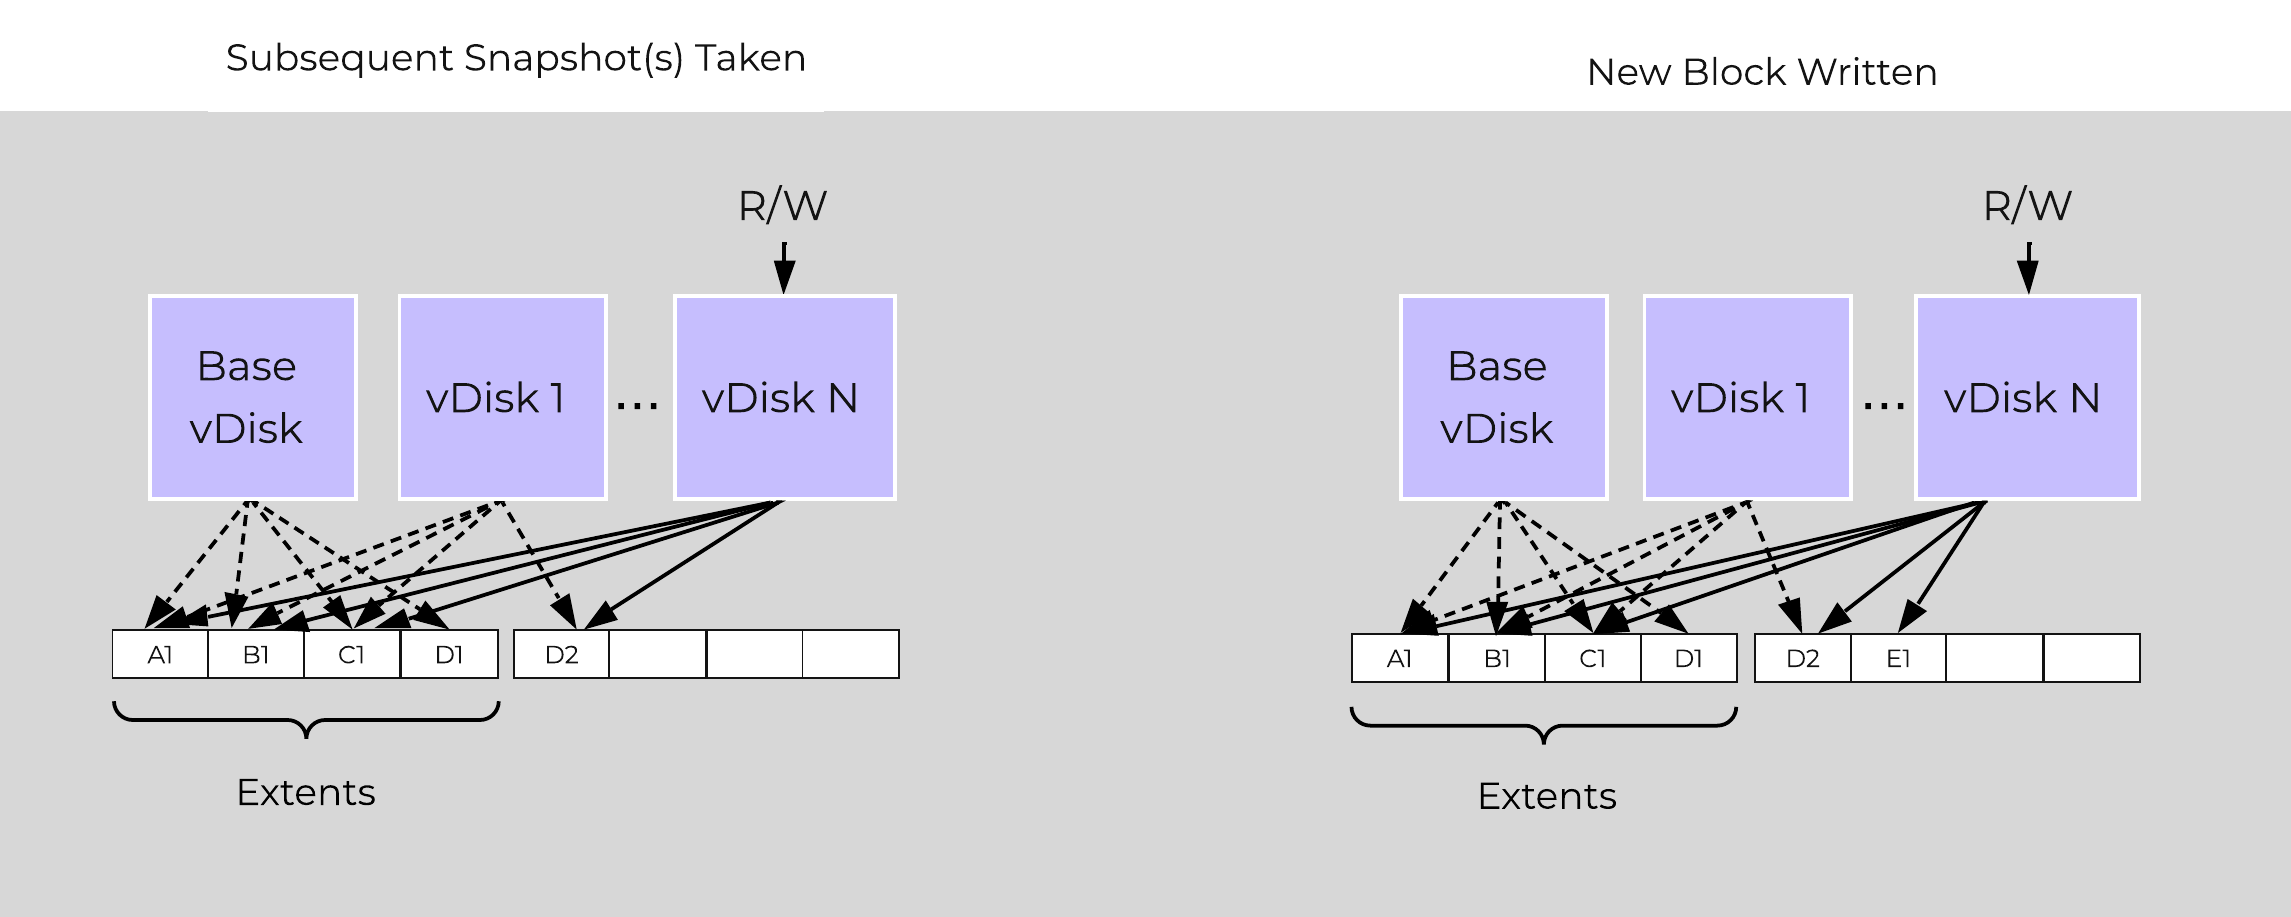 Multi-snap Block Map and New Write
The same methods are used for both snapshots and/or clones of a VM or vDisk(s). When a VM or vDisk is cloned, the current block map is locked and the clones are created. These updates are metadata only, so no I/O actually takes place. The same method applies for clones of clones; essentially the previously cloned VM acts as the “Base vDisk” and upon cloning, that block map is locked and two “clones” are created: one for the VM being cloned and another for the new clone. There is no imposed limit on the maximum number of clones.
They both inherit the prior block map and any new writes/updates would take place on their individual block maps.
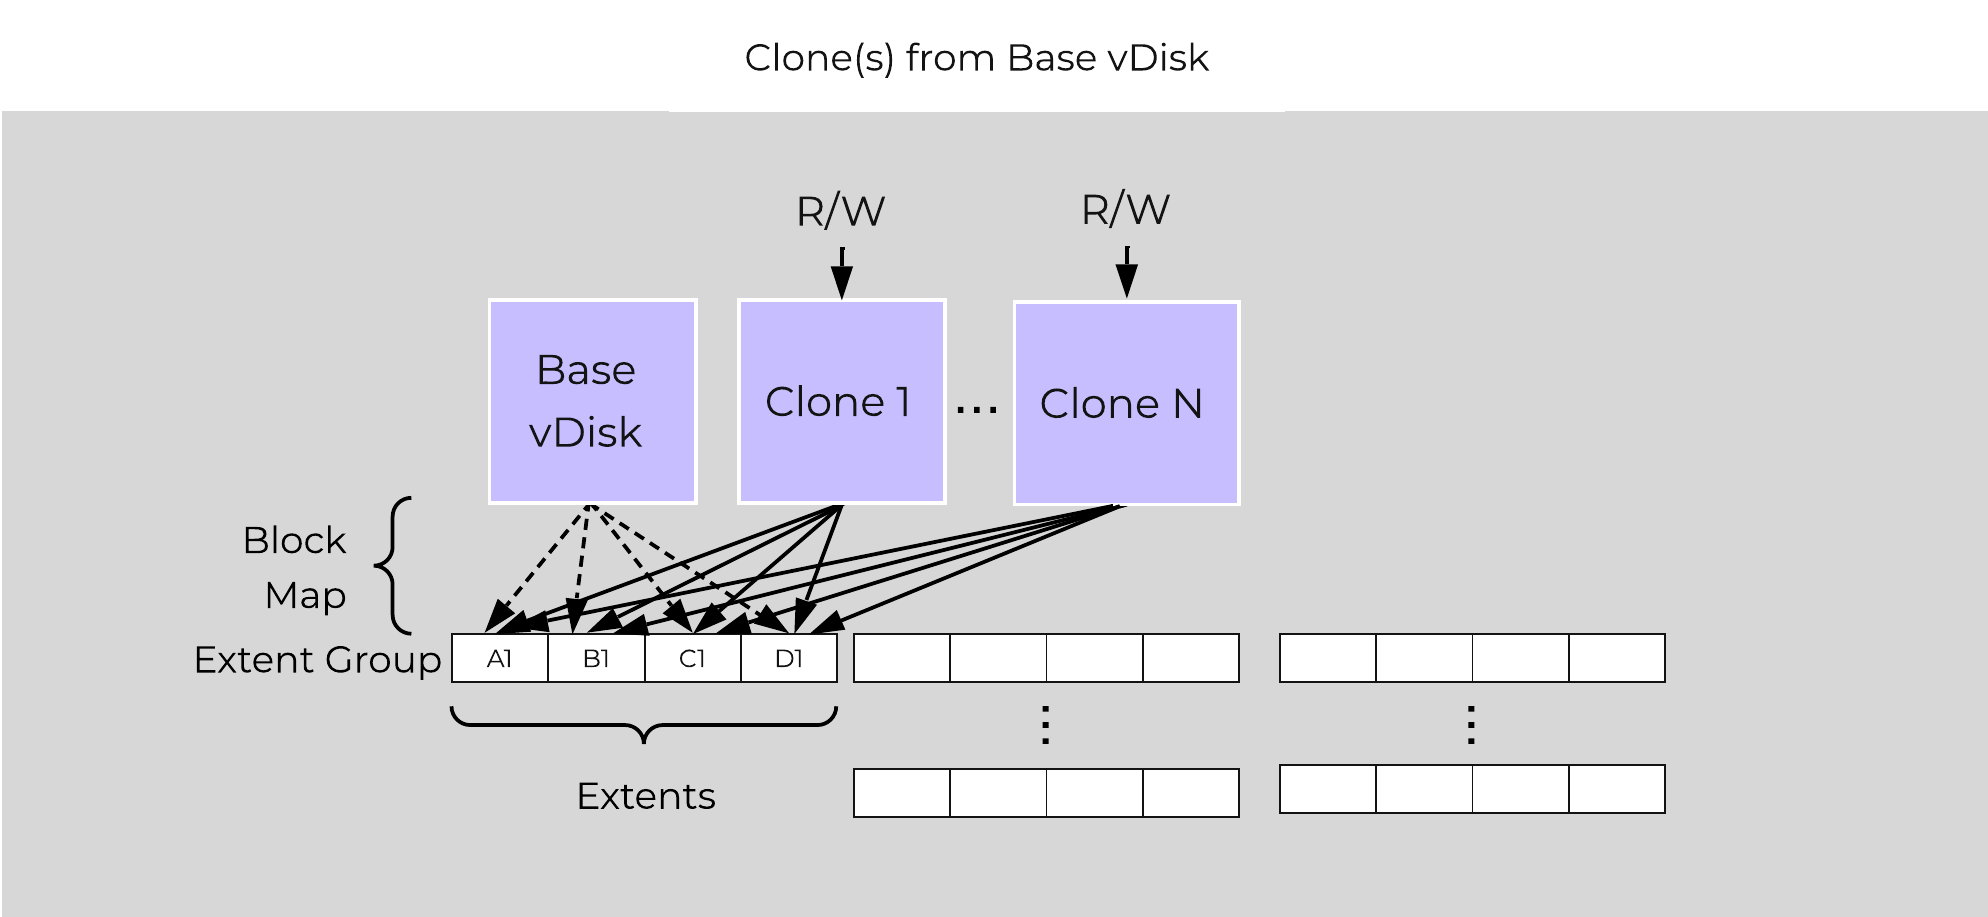 Multi-Clone Block Maps
As mentioned previously, each VM/vDisk has its own individual block map. So in the above example, all of the clones from the base VM would now own their block map and any write/update would occur there.
In the event of an overwrite the data will go to a new extent / extent group. For example, if data exists at offset o1 in extent e1 that was being overwritten, Stargate would create a new extent e2 and track that the new data was written in extent e2 at offset o2. The Vblock map tracks this down to the byte level.
The following figure shows an example of what this looks like:
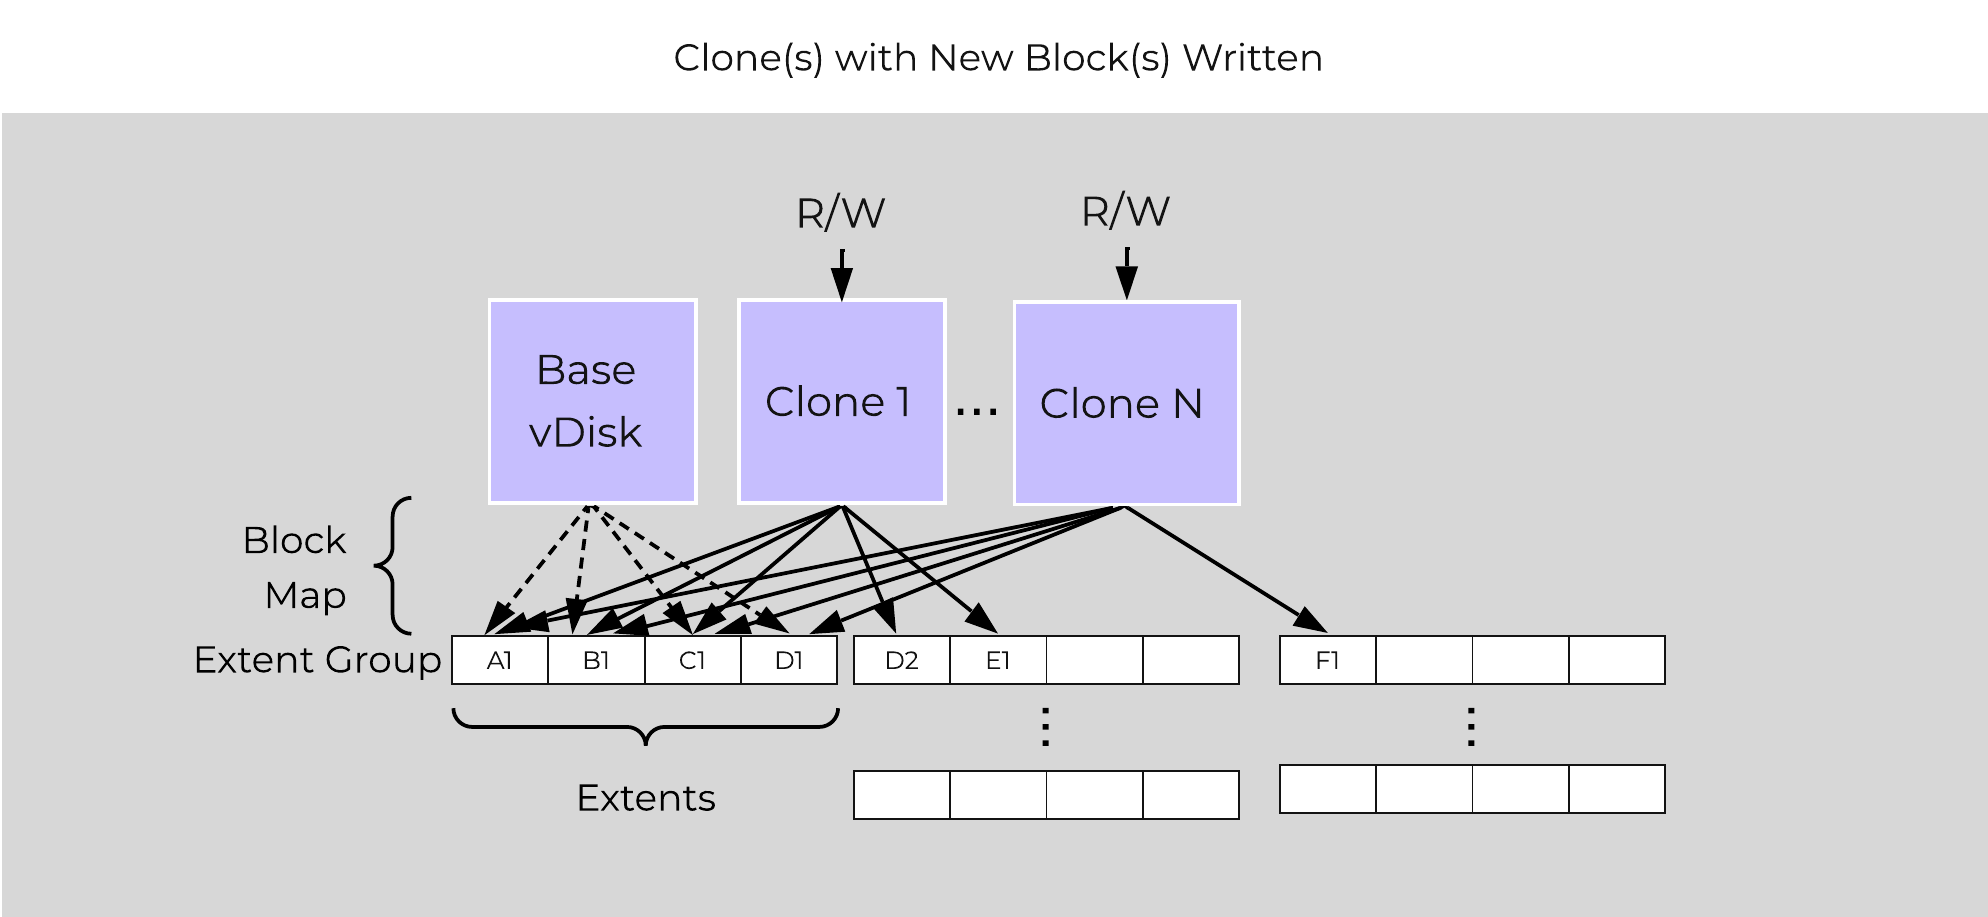 Clone Block Maps - New Write
Any subsequent clones or snapshots of a VM/vDisk would cause the original block map to be locked and would create a new one for R/W access.
Networking and I/O
The Nutanix platform does not leverage any backplane for inter-node communication and only relies on a standard 10GbE network. All storage I/O for VMs running on a Nutanix node is handled by the hypervisor on a dedicated private network. The I/O request will be handled by the hypervisor, which will then forward the request to the private IP on the local CVM. The CVM will then perform the remote replication with other Nutanix nodes using its external IP over the public 10GbE network. For all read requests, these will be served completely locally in most cases and never touch the 10GbE network. This means that the only traffic touching the public 10GbE network will be AOS remote replication traffic and VM network I/O. There will, however, be cases where the CVM will forward requests to other CVMs in the cluster in the case of a CVM being down or data being remote. Also, cluster-wide tasks, such as disk balancing, will temporarily generate I/O on the 10GbE network.
The following figure shows an example of how the VM’s I/O path interacts with the private and public 10GbE network:
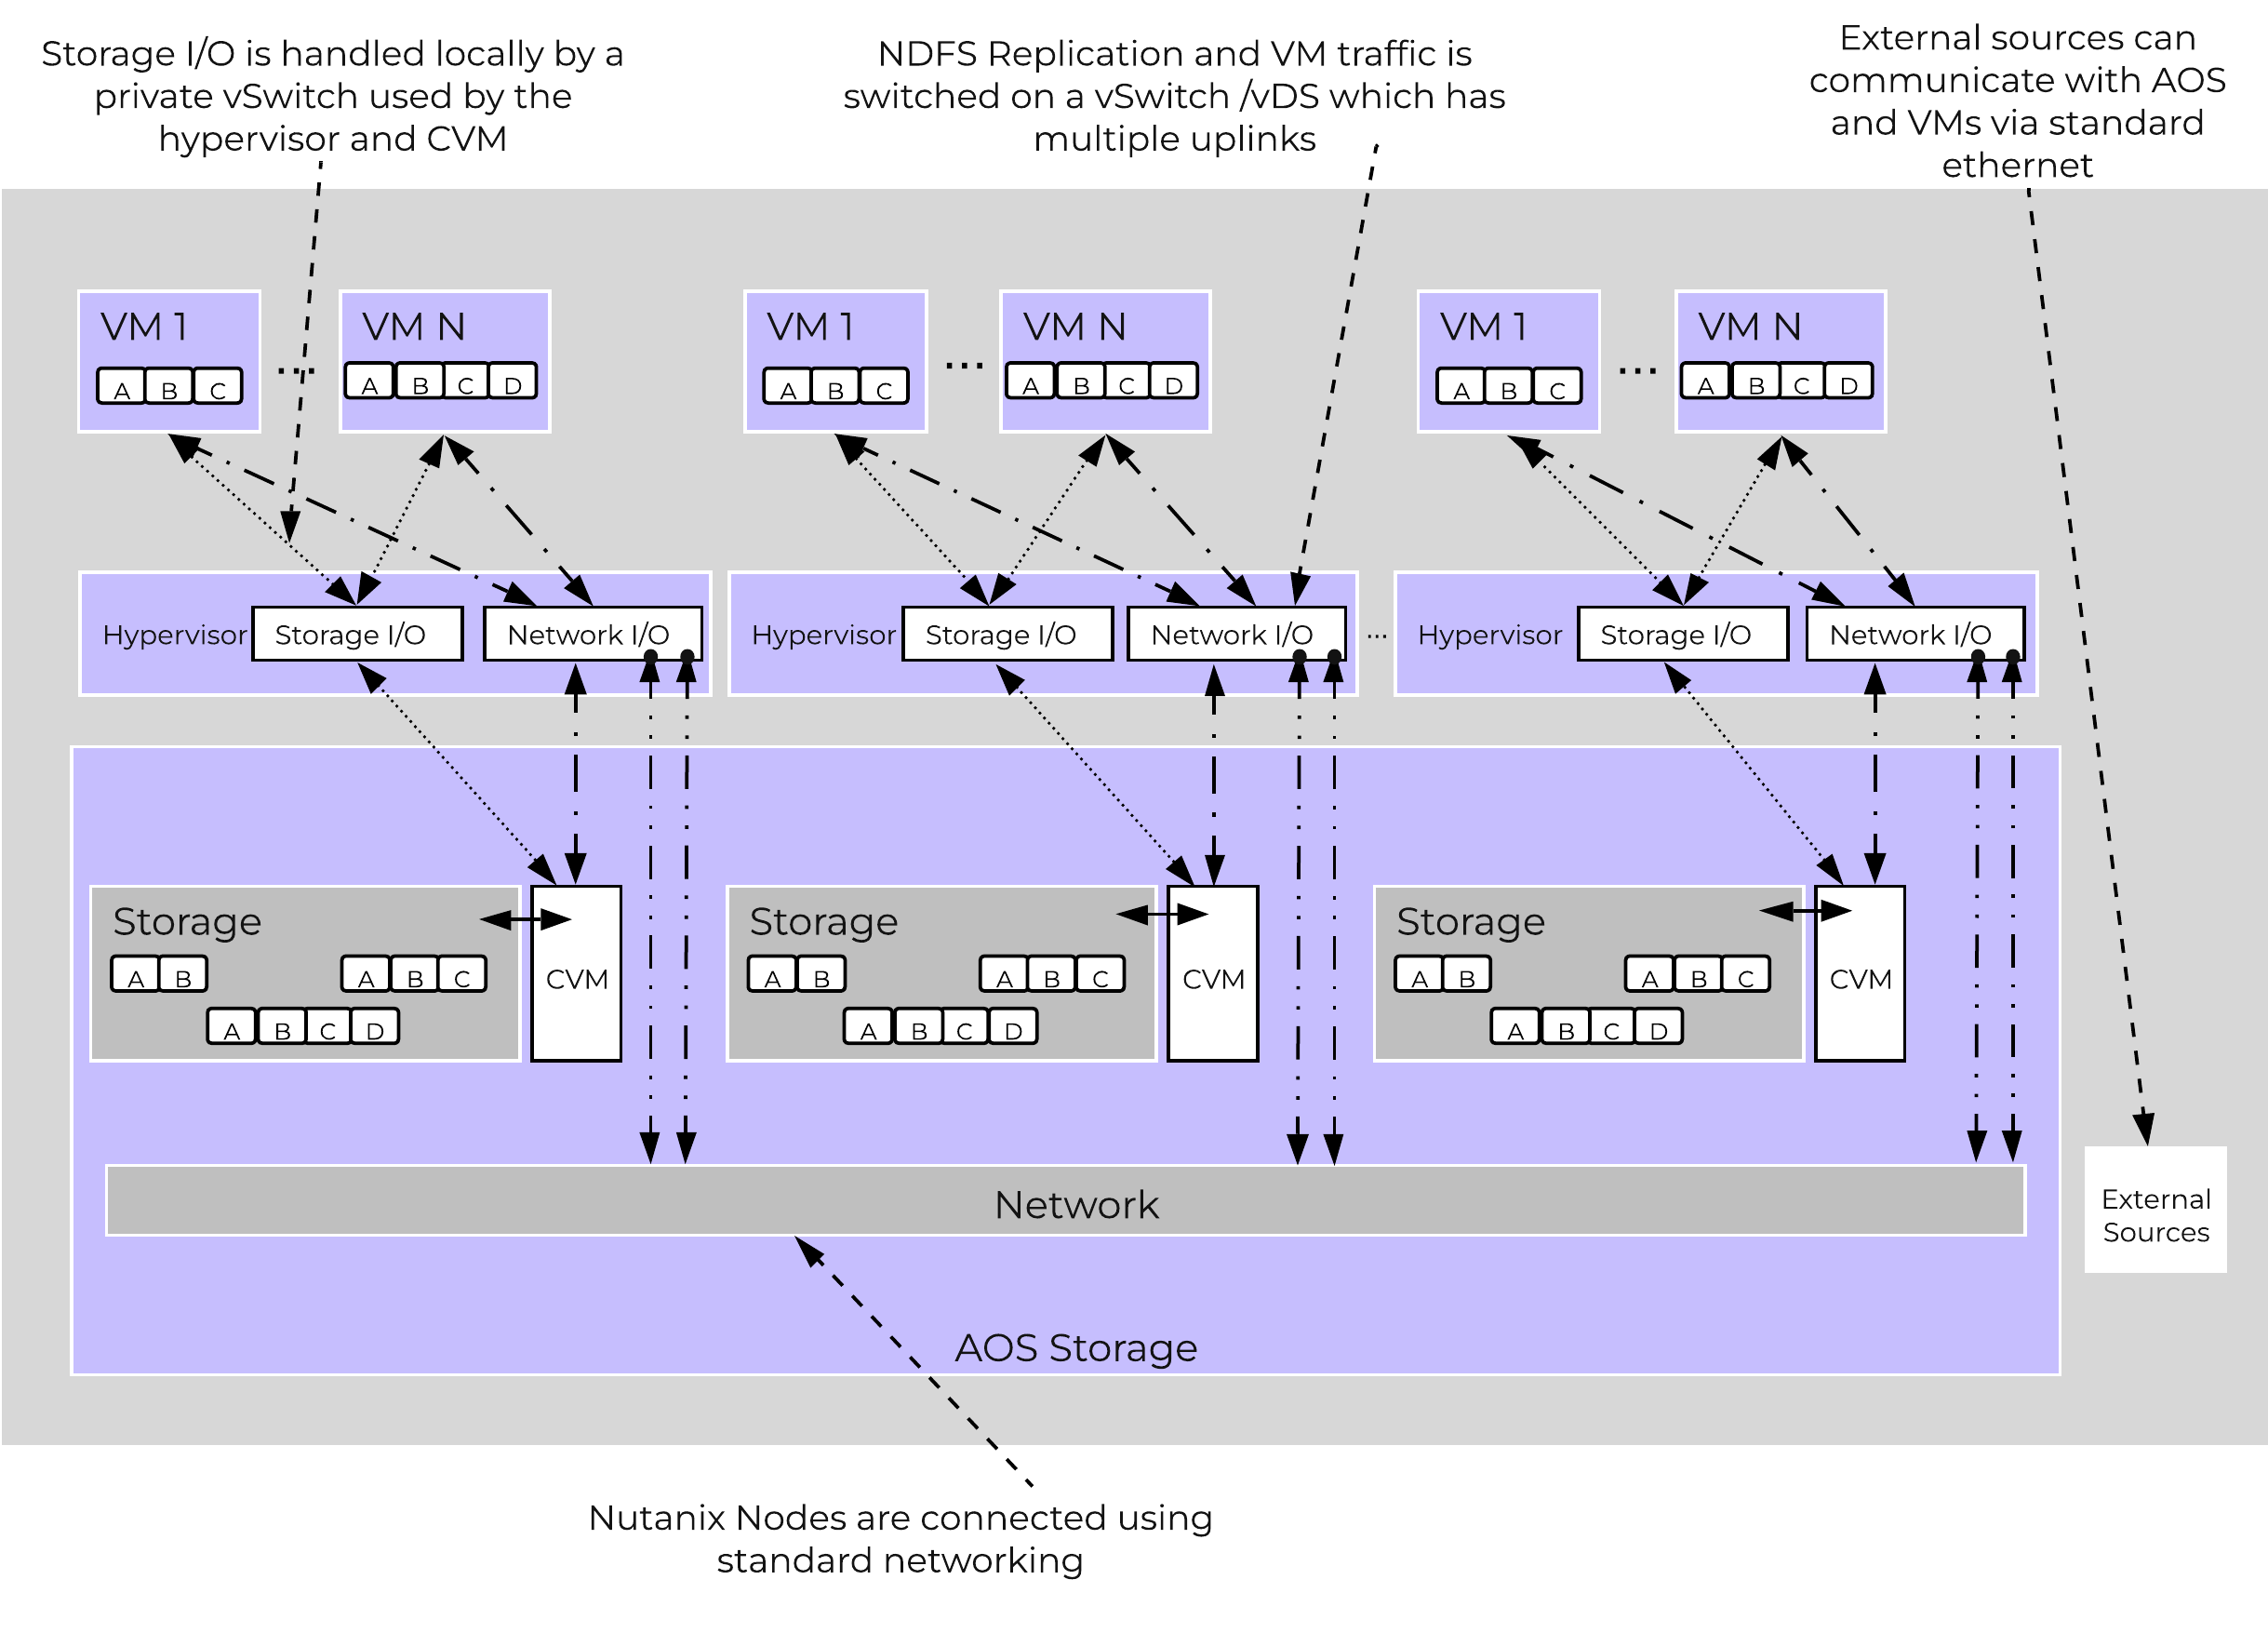 AOS Networking
Data Locality
Being a converged (compute+storage) platform, I/O and data locality are critical to cluster and VM performance with Nutanix. As explained above in the I/O path, all read/write IOs are served by the local Controller VM (CVM) which is on each hypervisor adjacent to normal VMs. A VM’s data is served locally from the CVM and sits on local disks under the CVM’s control. When a VM is moved from one hypervisor node to another (or during a HA event), the newly migrated VM’s data will be served by the now local CVM. When reading old data (stored on the now remote node/CVM), the I/O will be forwarded by the local CVM to the remote CVM. All write I/Os will occur locally right away. AOS will detect the I/Os are occurring from a different node and will migrate the data locally in the background, allowing for all read I/Os to now be served locally. The data will only be migrated on a read as to not flood the network.
Data locality occurs in two main flavors:
- Cache Locality
- Pulling remote data into the local Stargate’s Unified Cache. This is done at a 4K granularity.
- For instances where there are no local replicas, the requests will be forward to the Stargate(s) containing the replicas which will return the data and the local Stargate will store this locally then return the I/O. All subsequent requests for that data will be returned from the cache.
- Extent Group (egroup) Locality
- Migrating the vDisk extent group(s) (egroups) to be stored in the local Stargate’s Extent Store.
- If a replica egroup is already local, no movement is necessary.
- In this scenario the actual replica egroup will be re-localized after certain I/O thresholds are met. We don’t automatically re-localize / migrate egroups to ensure we’re leveraging the network efficiently.
- For AES enabled egroups the same horizontal migration occurs for cases where replicas aren’t local and the patterns are met.
The following figure shows an example of how data will “follow” the VM as it moves between hypervisor nodes:
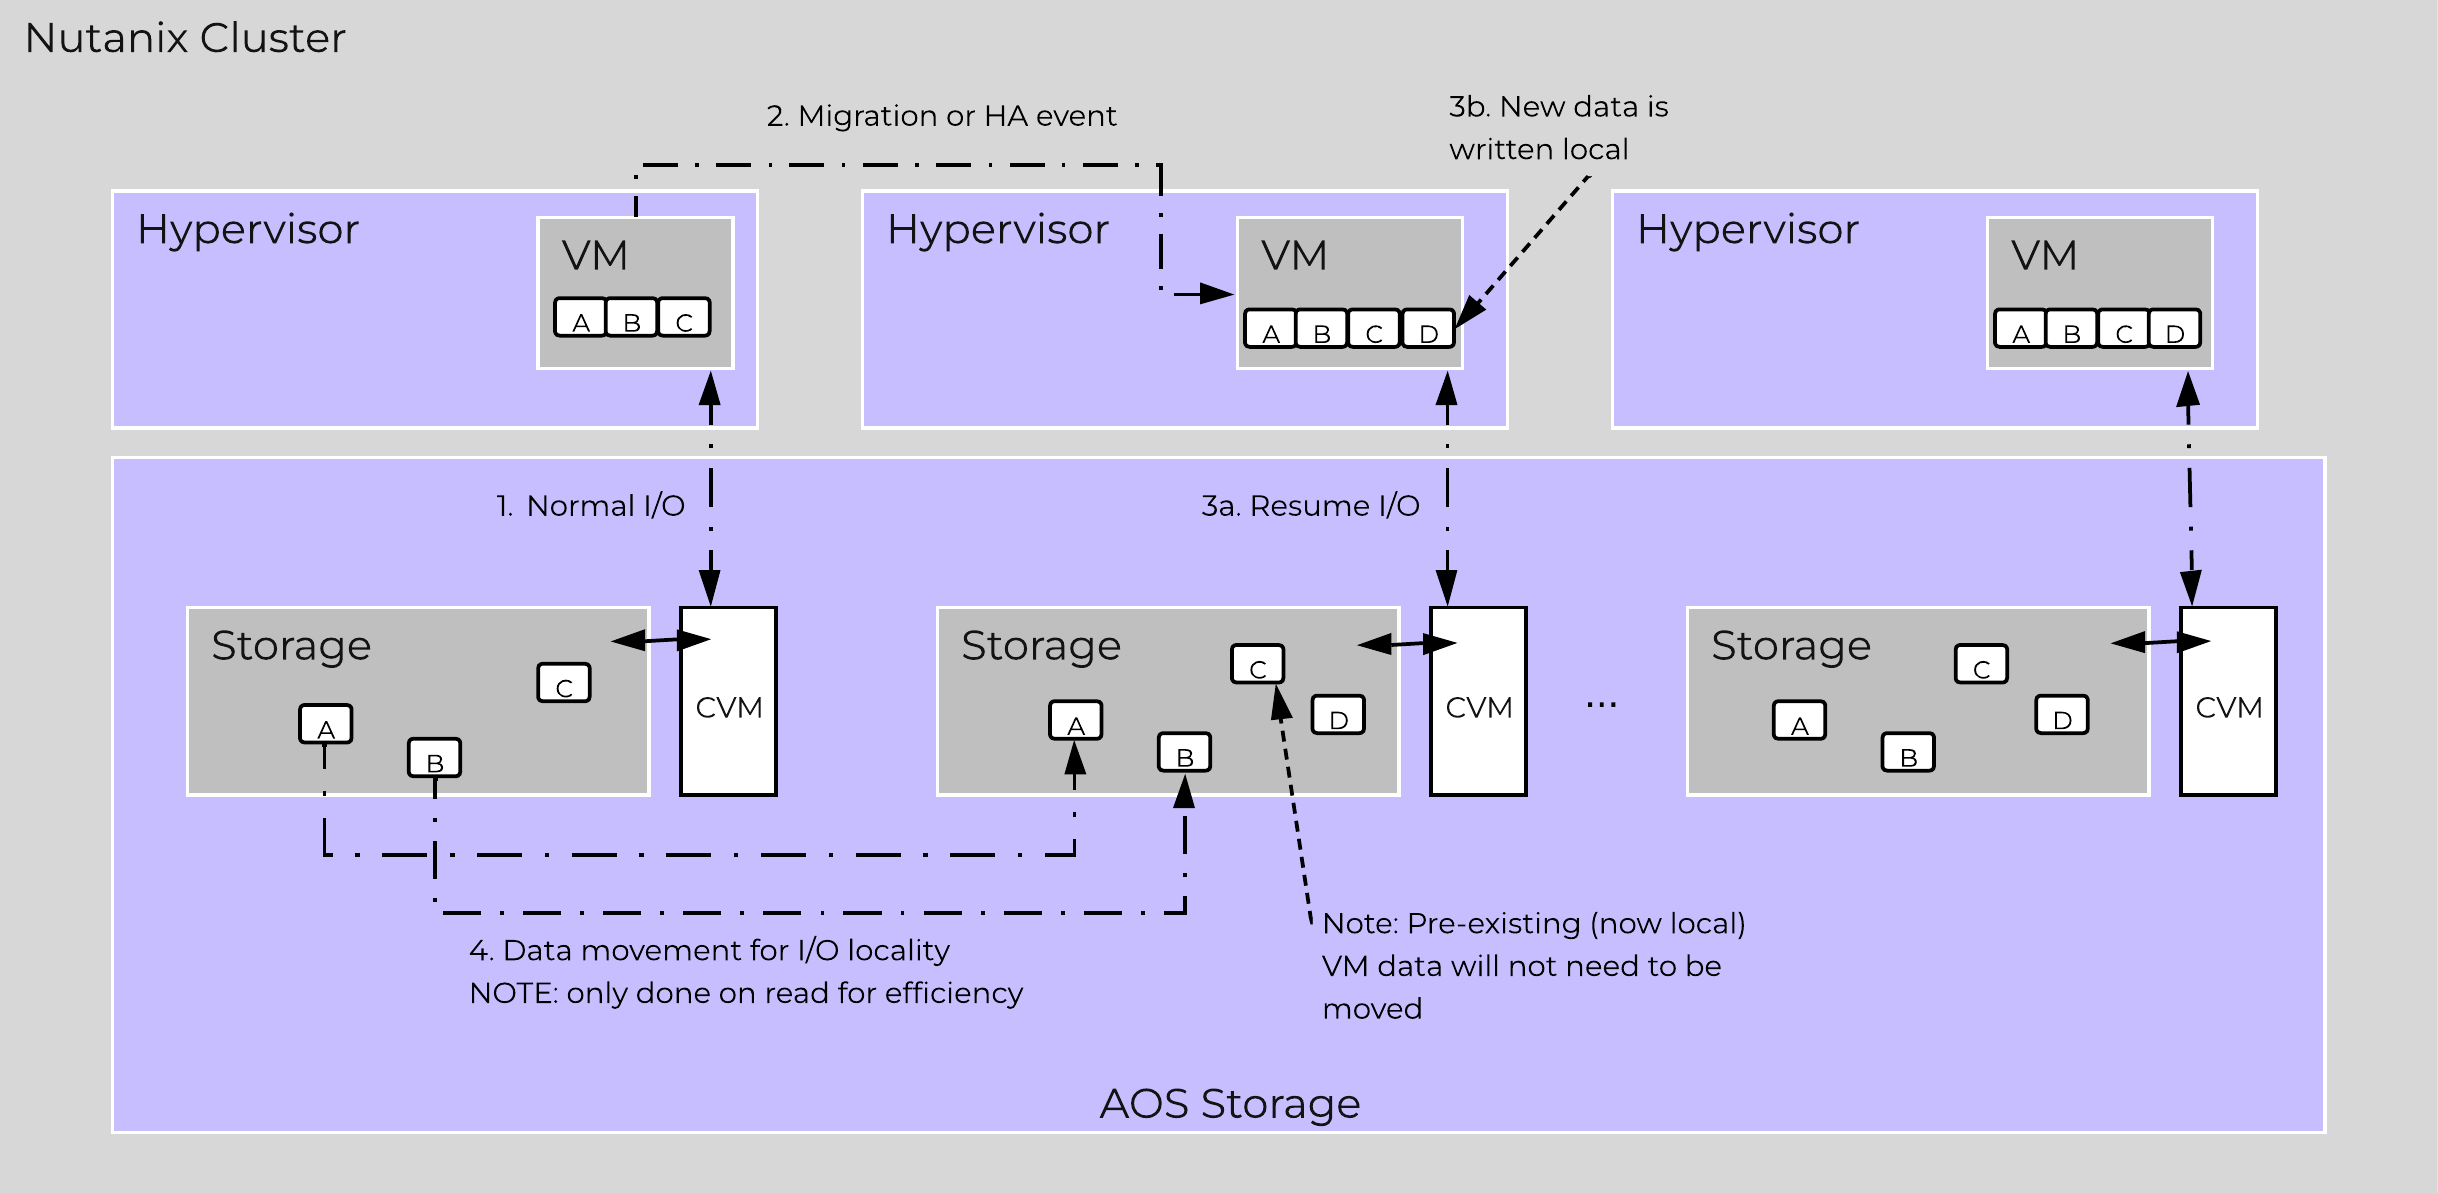 Data Locality
Note
Thresholds for Data Migration
Cache locality occurs in real time and will be determined based upon vDisk ownership. When a vDisk / VM moves from one node to another the "ownership" of those vDisk(s) will transfer to the now local CVM. Once the ownership has transferred the data can be cached locally in the Unified Cache. In the interim the cache will be wherever the ownership is held (the now remote host). The previously hosting Stargate will relinquish the vDisk token when it sees remote I/Os for 300+ seconds at which it will then be taken by the local Stargate. Cache coherence is enforced as ownership is required to cache the vDisk data.
Egroup locality is a sampled operation and an extent group will be migrated when the following occurs: "3 touches for random or 10 touches for sequential within a 10 minute window where multiple reads every 10 second sampling count as a single touch".
Shadow Clones
AOS Storage has a feature called ‘Shadow Clones’, which allows for distributed caching of particular vDisks or VM data which is in a ‘multi-reader’ scenario. A great example of this is during a VDI deployment many ‘linked clones’ will be forwarding read requests to a central master or ‘Base VM’. In the case of Omnissa Horizon (formerly Horizon View), this is called the replica disk and is read by all linked clones, and in XenDesktop, this is called the MCS Master VM. This will also work in any scenario which may be a multi-reader scenario (e.g., deployment servers, repositories, etc.). Data or I/O locality is critical for the highest possible VM performance and a key struct of AOS.
With Shadow Clones, AOS will monitor vDisk access trends similar to what it does for data locality. However, in the case there are requests occurring from more than two remote CVMs (as well as the local CVM), and all of the requests are read I/O, the vDisk will be marked as immutable. Once the disk has been marked as immutable, the vDisk can then be cached locally by each CVM making read requests to it (aka Shadow Clones of the base vDisk). This will allow VMs on each node to read the Base VM’s vDisk locally. In the case of VDI, this means the replica disk can be cached by each node and all read requests for the base will be served locally. NOTE: The data will only be migrated on a read as to not flood the network and allow for efficient cache utilization. In the case where the Base VM is modified, the Shadow Clones will be dropped and the process will start over. Shadow clones are enabled by default and can be enabled/disabled using the following NCLI command: ncli cluster edit-params enable-shadow-clones=<true/false>.
The following figure shows an example of how Shadow Clones work and allow for distributed caching:
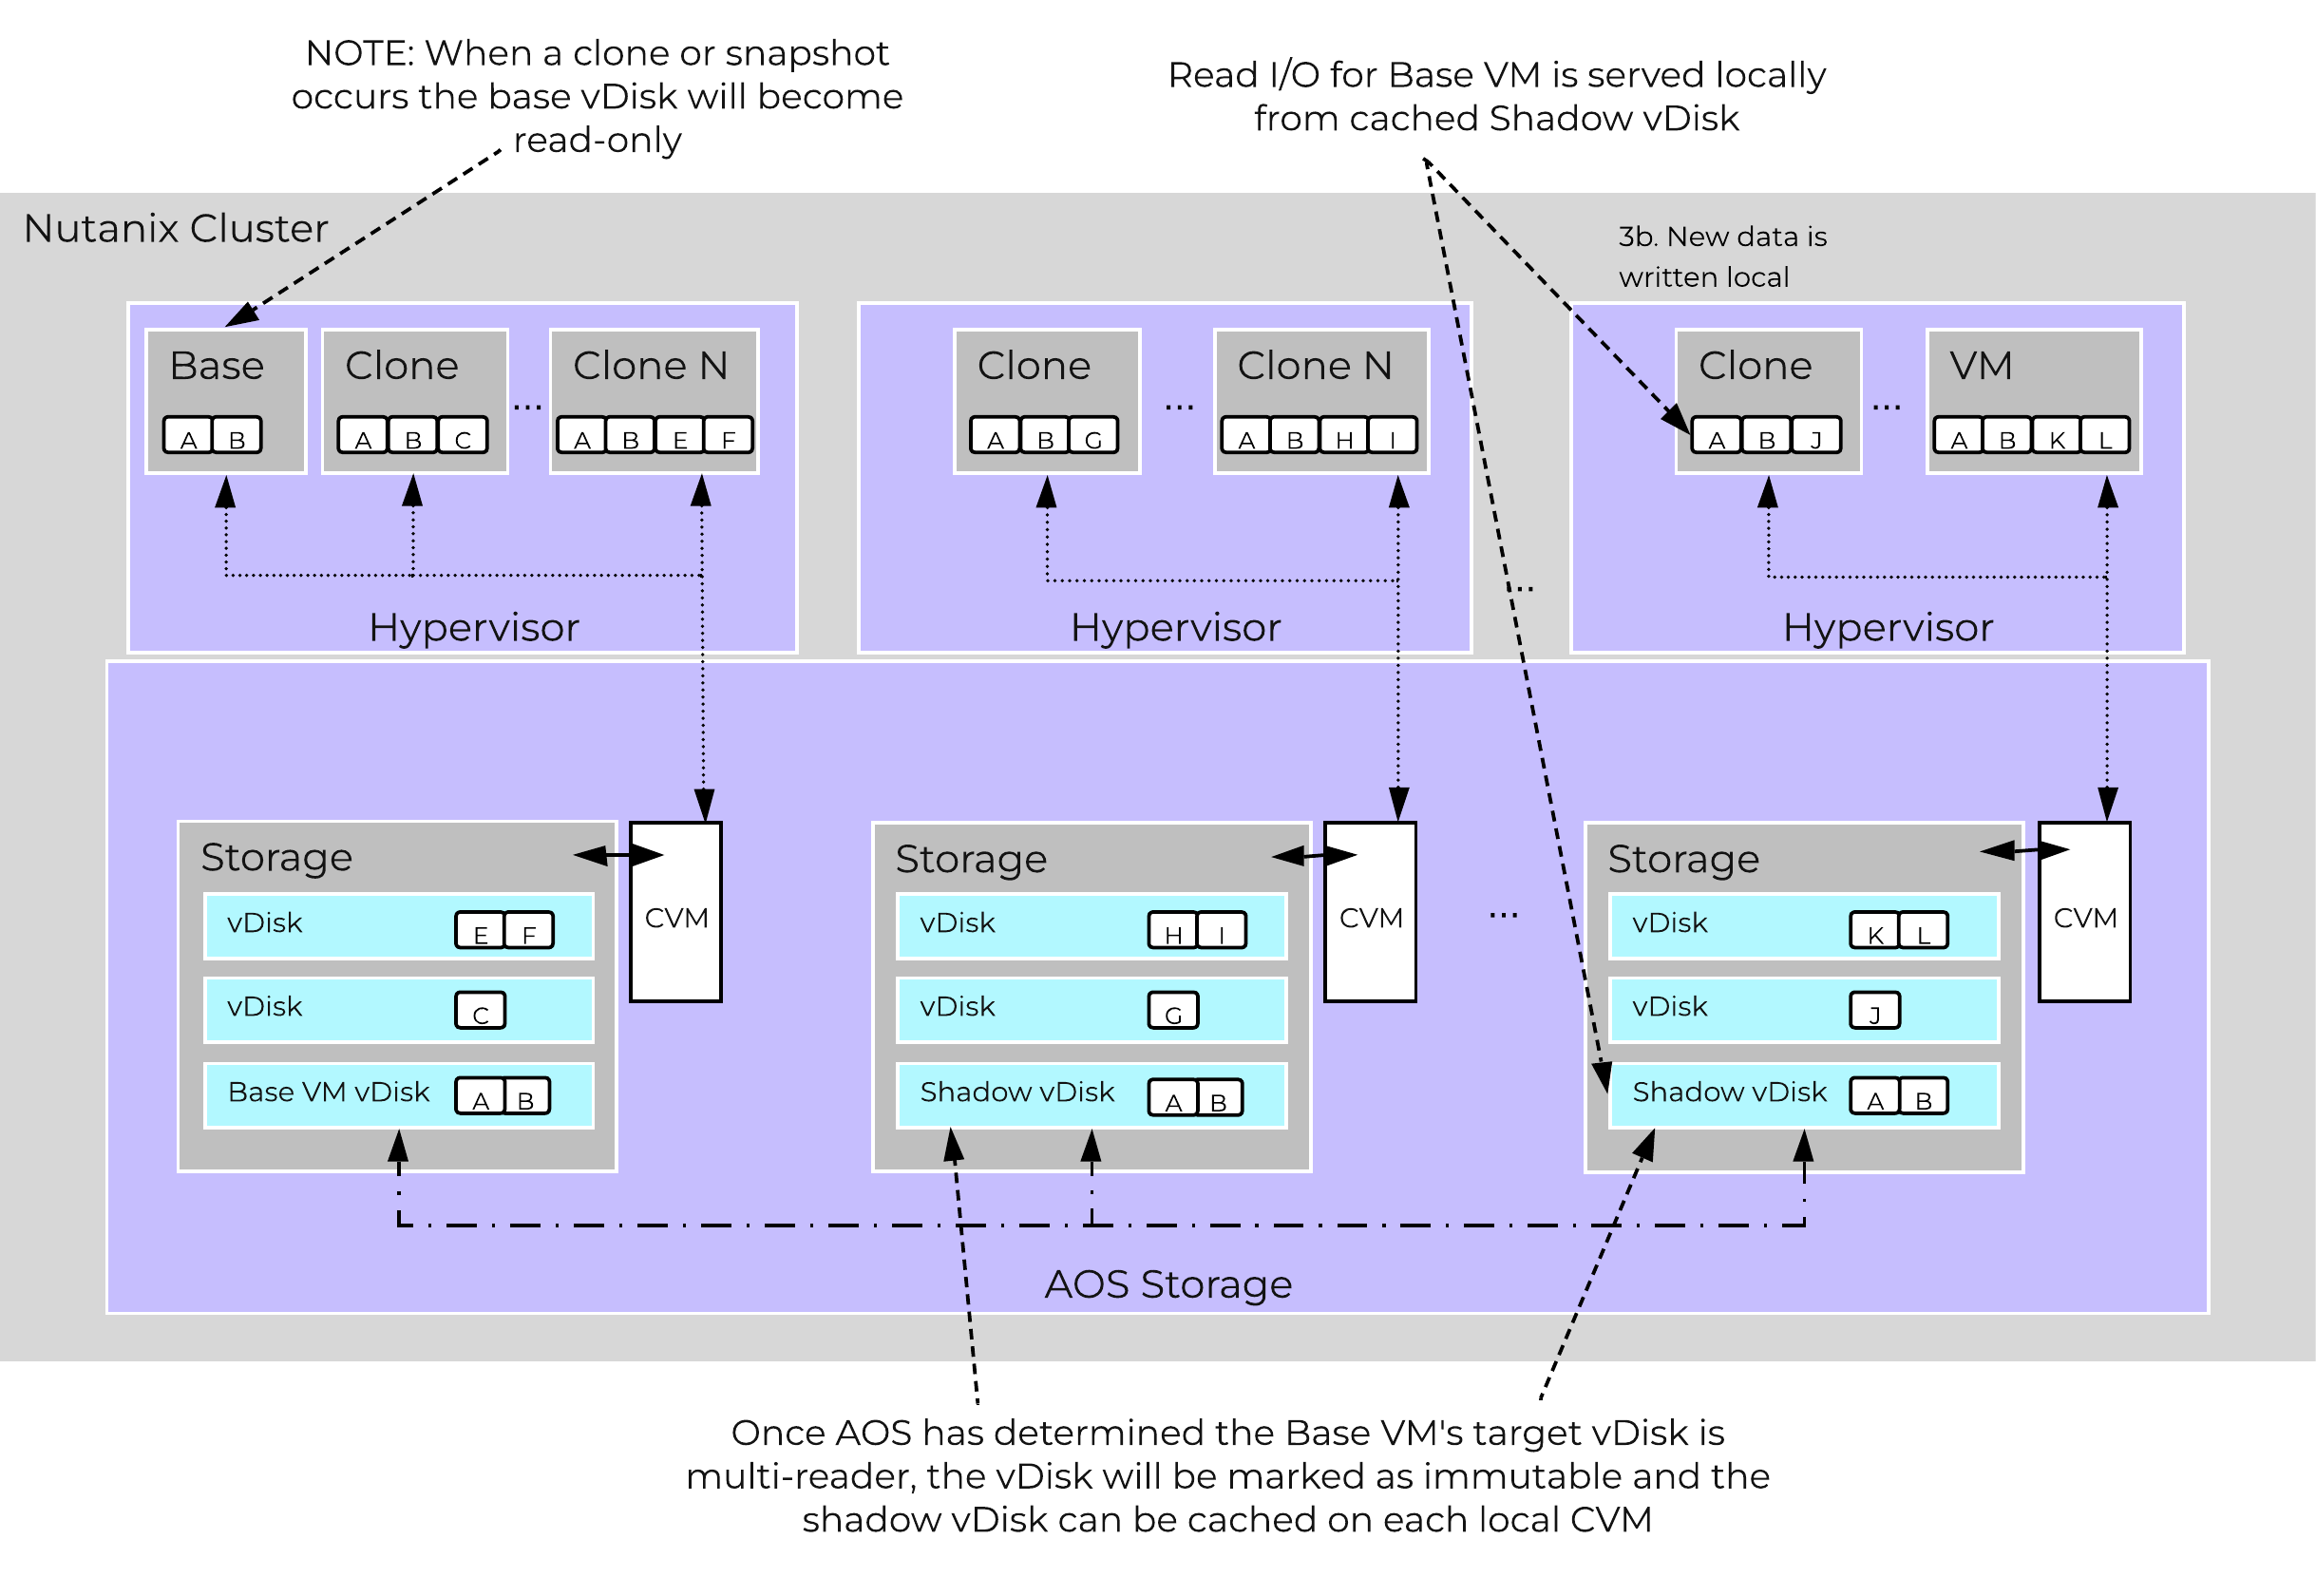 Shadow Clones
Storage Layers and Monitoring
The Nutanix platform monitors storage at multiple layers throughout the stack, ranging from the VM/Guest OS all the way down to the physical disk devices. Knowing the various tiers and how these relate is important whenever monitoring the solution and allows you to get full visibility of how the ops relate. The following figure shows the various layers of where operations are monitored and the relative granularity which are explained below:
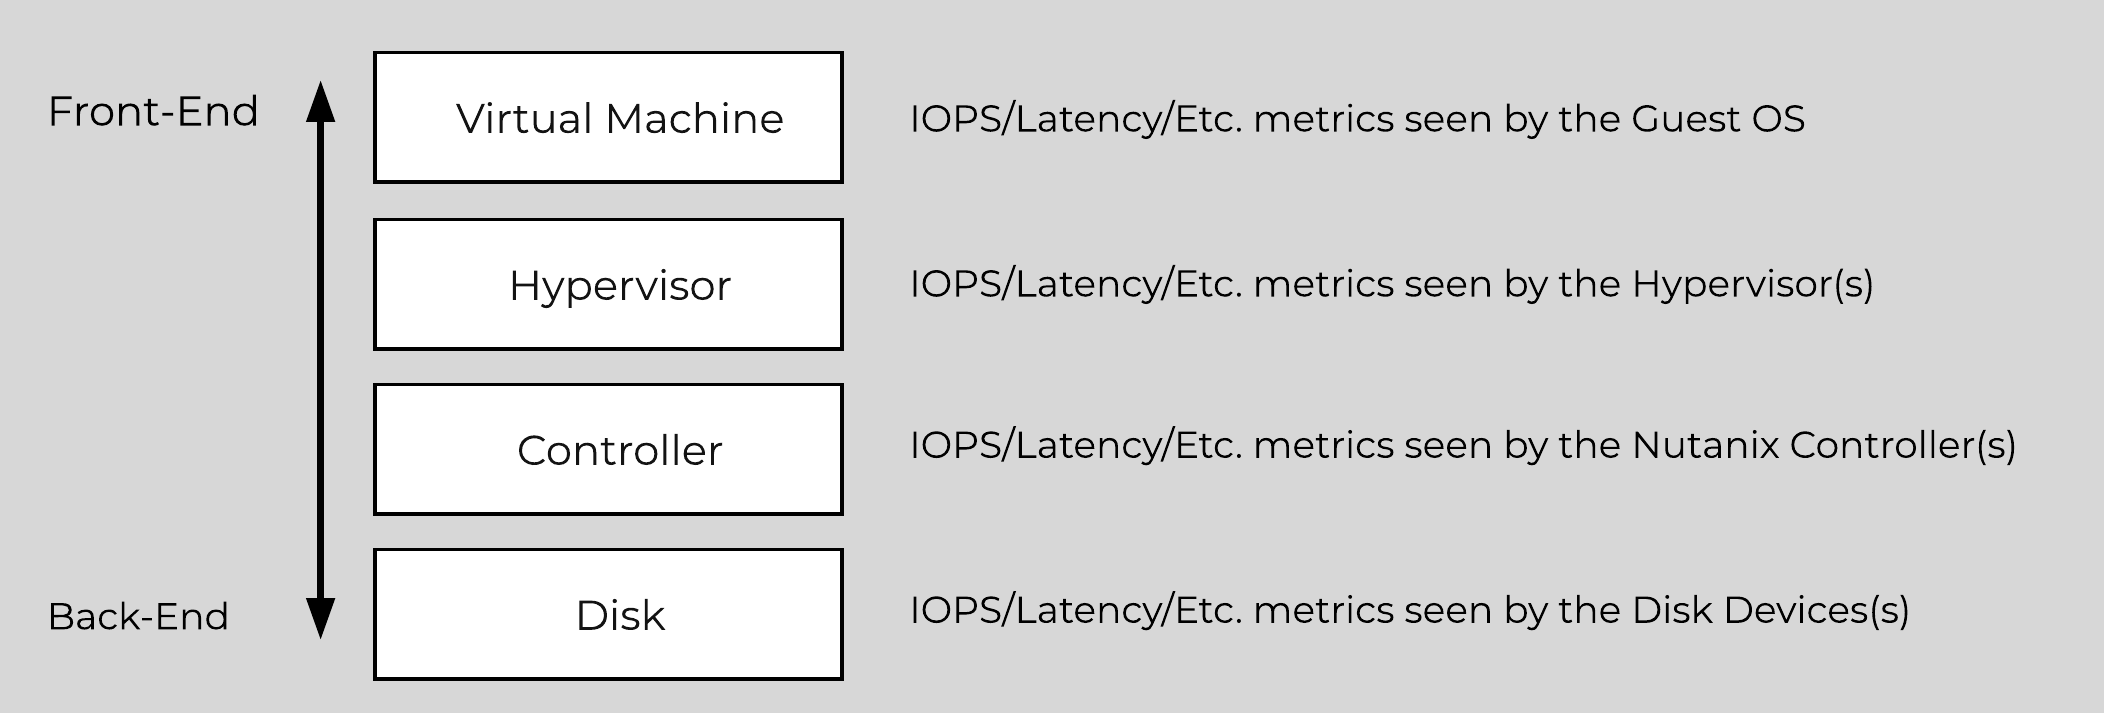 Storage Layers
Virtual Machine Layer
- Key Role: Metrics reported by the hypervisor for the VM
- Description: Virtual Machine or guest level metrics are pulled directly from the hypervisor and represent the performance the VM is seeing and is indicative of the I/O performance the application is seeing.
- When to use: When troubleshooting or looking for VM level detail
Hypervisor Layer
- Key Role: Metrics reported by the Hypervisor(s)
- Description: Hypervisor level metrics are pulled directly from the hypervisor and represent the most accurate metrics the hypervisor(s) are seeing. This data can be viewed for one of more hypervisor node(s) or the aggregate cluster. This layer will provide the most accurate data in terms of what performance the platform is seeing and should be leveraged in most cases. In certain scenarios the hypervisor may combine or split operations coming from VMs which can show the difference in metrics reported by the VM and hypervisor. These numbers will also include cache hits served by the Nutanix CVMs.
- When to use: Most common cases as this will provide the most detailed and valuable metrics.
Controller Layer
- Key Role: Metrics reported by the Nutanix Controller(s)
- Description: Controller level metrics are pulled directly from the Nutanix Controller VMs (e.g., Stargate 2009 page) and represent what the Nutanix front-end is seeing from NFS/SMB/iSCSI or any back-end operations (e.g., ILM, disk balancing, etc.). This data can be viewed for one of more Controller VM(s) or the aggregate cluster. The metrics seen by the Controller Layer should normally match those seen by the hypervisor layer, however will include any backend operations (e.g., ILM, disk balancing). These numbers will also include cache hits served by memory. In certain cases, metrics like (IOPS), might not match as the NFS / SMB / iSCSI client might split a large IO into multiple smaller IOPS. However, metrics like bandwidth should match.
- When to use: Similar to the hypervisor layer, can be used to show how much backend operation is taking place.
Disk Layer
- Key Role: Metrics reported by the Disk Device(s)
- Description: Disk level metrics are pulled directly from the physical disk devices (via the CVM) and represent what the back-end is seeing. This includes data hitting the OpLog or Extent Store where an I/O is performed on the disk. This data can be viewed for one of more disk(s), the disk(s) for a particular node, or the aggregate disks in the cluster. In common cases, it is expected that the disk ops should match the number of incoming writes as well as reads not served from the memory portion of the cache. Any reads being served by the memory portion of the cache will not be counted here as the op is not hitting the disk device.
- When to use: When looking to see how many ops are served from cache or hitting the disks.
Note
Metric and Stat Retention
Metrics and time series data is stored locally for 90 days in Prism Element. For Prism Central and Insights, data can be stored indefinitely (assuming capacity is available).
» Download this section as PDF (opens in a new tab/window)
Nutanix AOS storage is the scale-out storage technology that appears to the hypervisor like any centralized storage array, however all of the I/Os are handled locally to provide the highest performance. More detail on how these nodes form a distributed system can be found in the next section.
Data Structure
Nutanix AOS storage is composed of the following high-level structure:
Storage Pool
- Key Role: Group of physical devices
- Description: A storage pool is a group of physical storage devices including PCIe SSD, SSD, and HDD devices for the cluster. The storage pool can span multiple Nutanix nodes and is expanded as the cluster scales. In most configurations, only a single storage pool is leveraged.
Container
- Key Role: Group of VMs/files
- Description: A container is a logical segmentation of the Storage Pool and contains a group of VM or files (vDisks). Some configuration options (e.g., RF) are configured at the container level, however are applied at the individual VM/file level. Containers typically have a 1 to 1 mapping with a datastore (in the case of NFS/SMB).
vDisk
- Key Role: vDisk
- Description: A vDisk is any file over 512KB on AOS including .vmdks and VM hard disks. vDisks are logically composed of vBlocks which make up the ‘block map.’
The following figure shows how these map between AOS and the hypervisor:
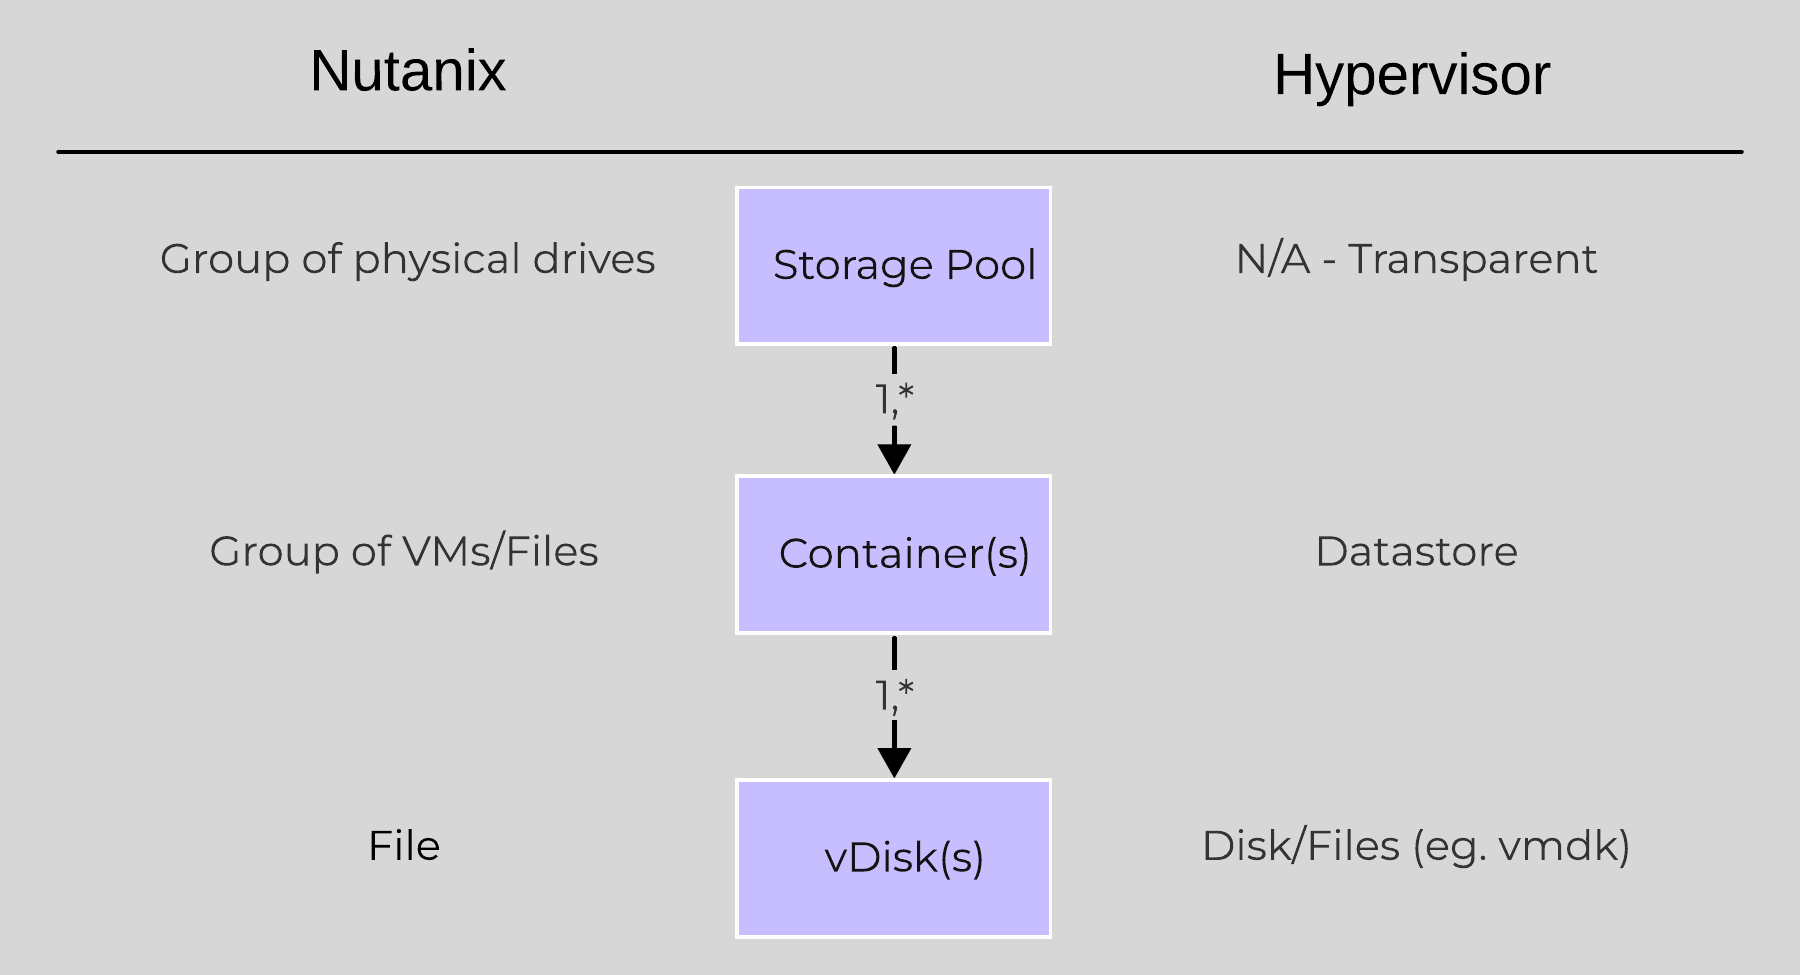 High-level Filesystem Breakdown
vBlock
- Key Role: 1MB chunk of vDisk address space
- Description: A vBlock is a 1MB chunk of virtual address space composing a vDisk. For example, a vDisk of 100MB will have 100 x 1MB vBlocks, vBlock 0 would be for 0-1MB, vBlock 1 would be from 1-2MB, and so forth. These vBlocks map to extents which are stored as files on disk as extent groups.
Extent
- Key Role: Logically contiguous data
- Description: An extent is a 1MB piece of logically contiguous data which consists of n number of contiguous blocks (varies depending on guest OS block size). Extents are written/read/modified on a sub-extent basis (aka slice) for granularity and efficiency. An extent’s slice may be trimmed when moving into the cache depending on the amount of data being read/cached.
Extent Group
- Key Role: Physically contiguous stored data
- Description: An extent group is a 1MB or 4MB piece of physically contiguous stored data. This data is stored as a file on the storage device owned by the CVM. Extents are dynamically distributed among extent groups to provide data striping across nodes/disks to improve performance. NOTE: Extent groups can now be either 1MB or 4MB depending on deduplication.
The following figure shows how these structs relate between the various file systems:
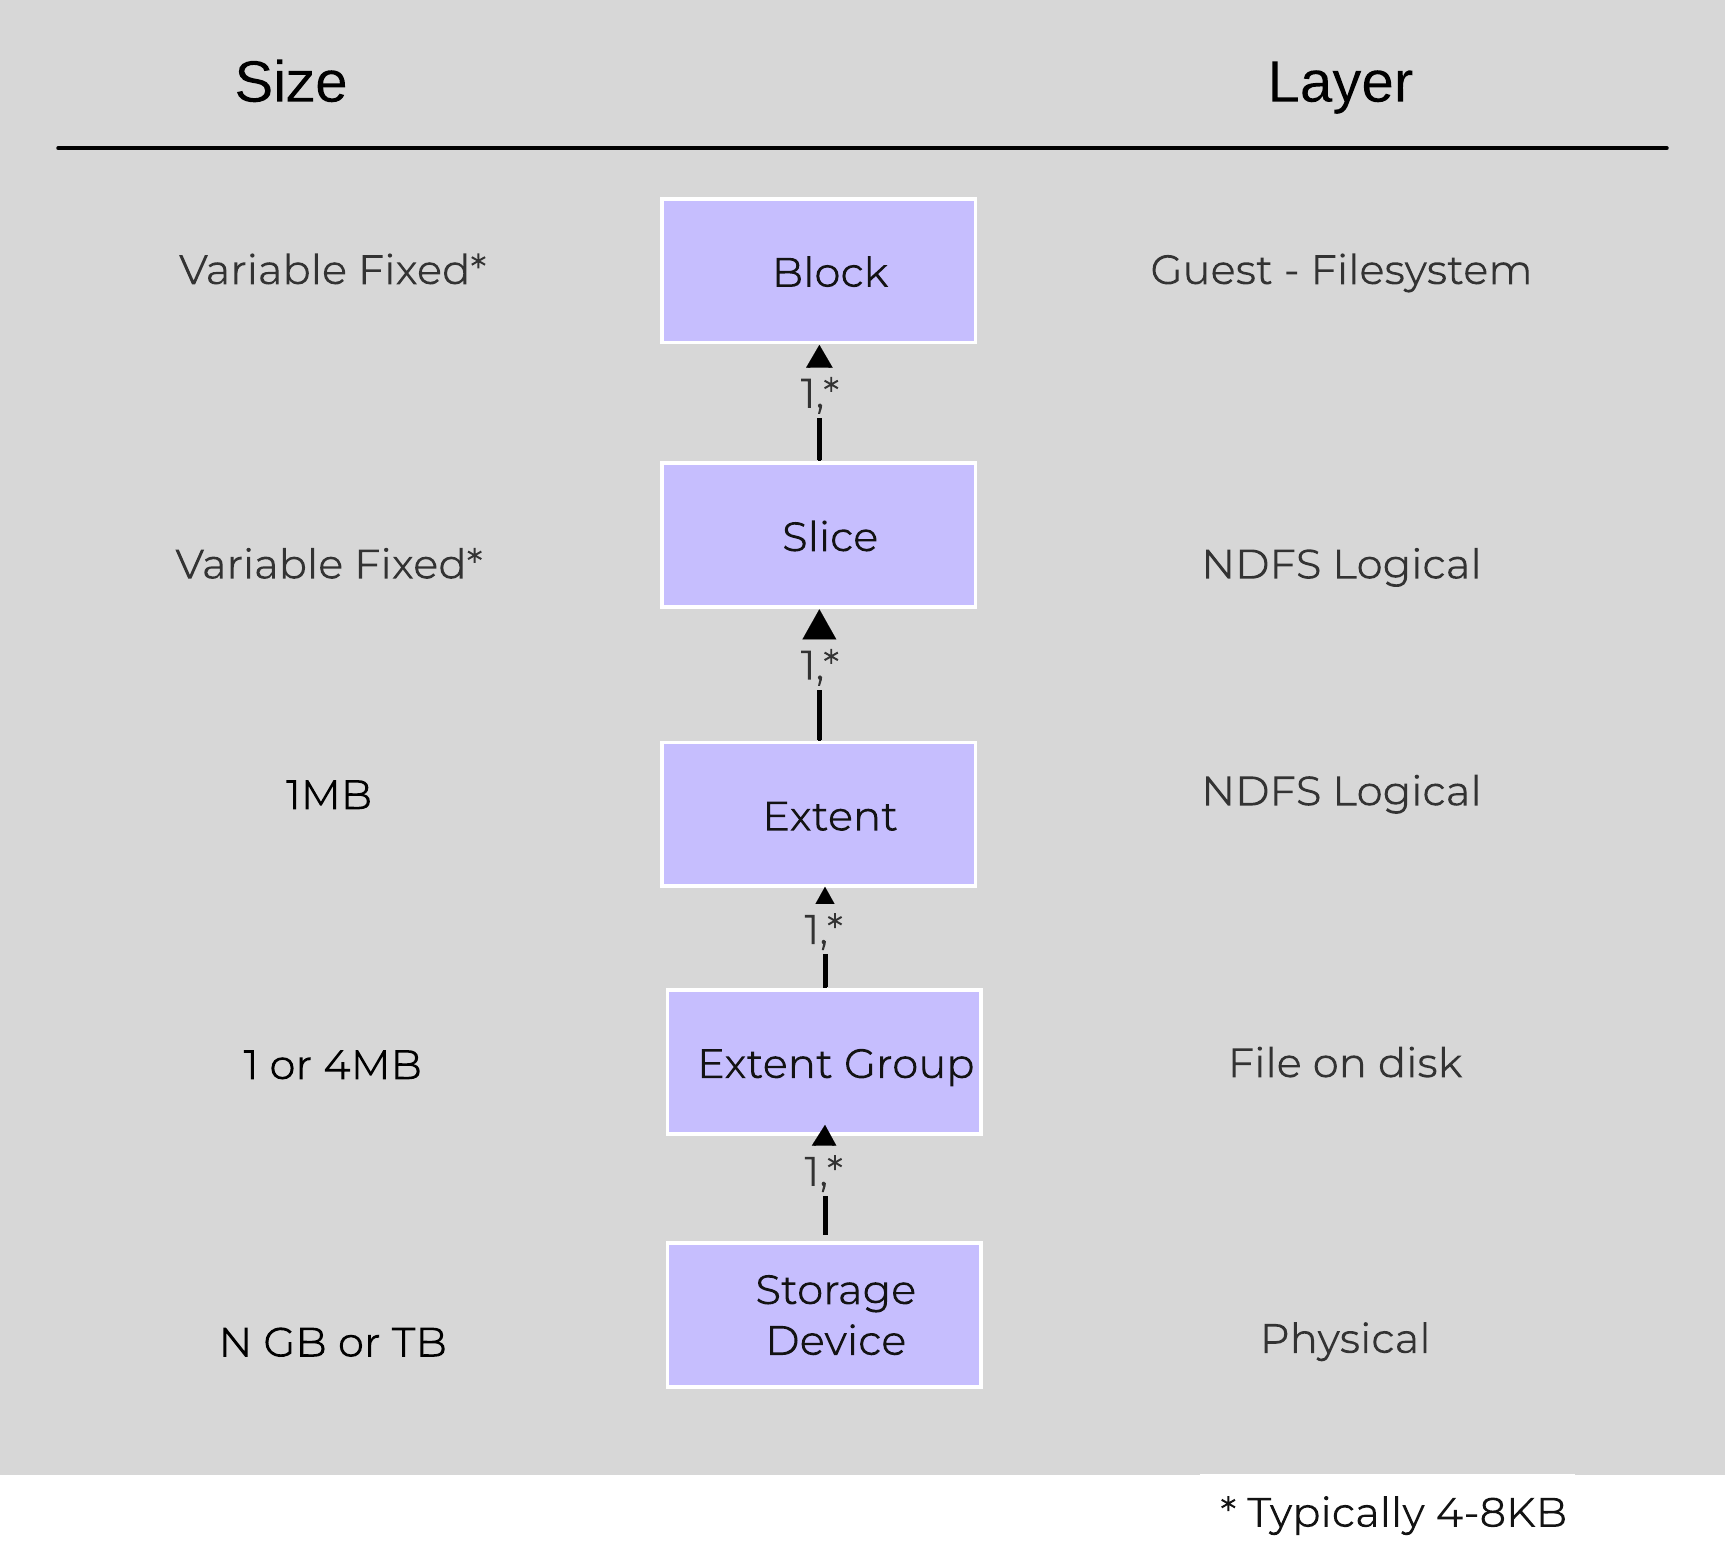 Low-level Filesystem Breakdown
Here is another graphical representation of how these units are related:
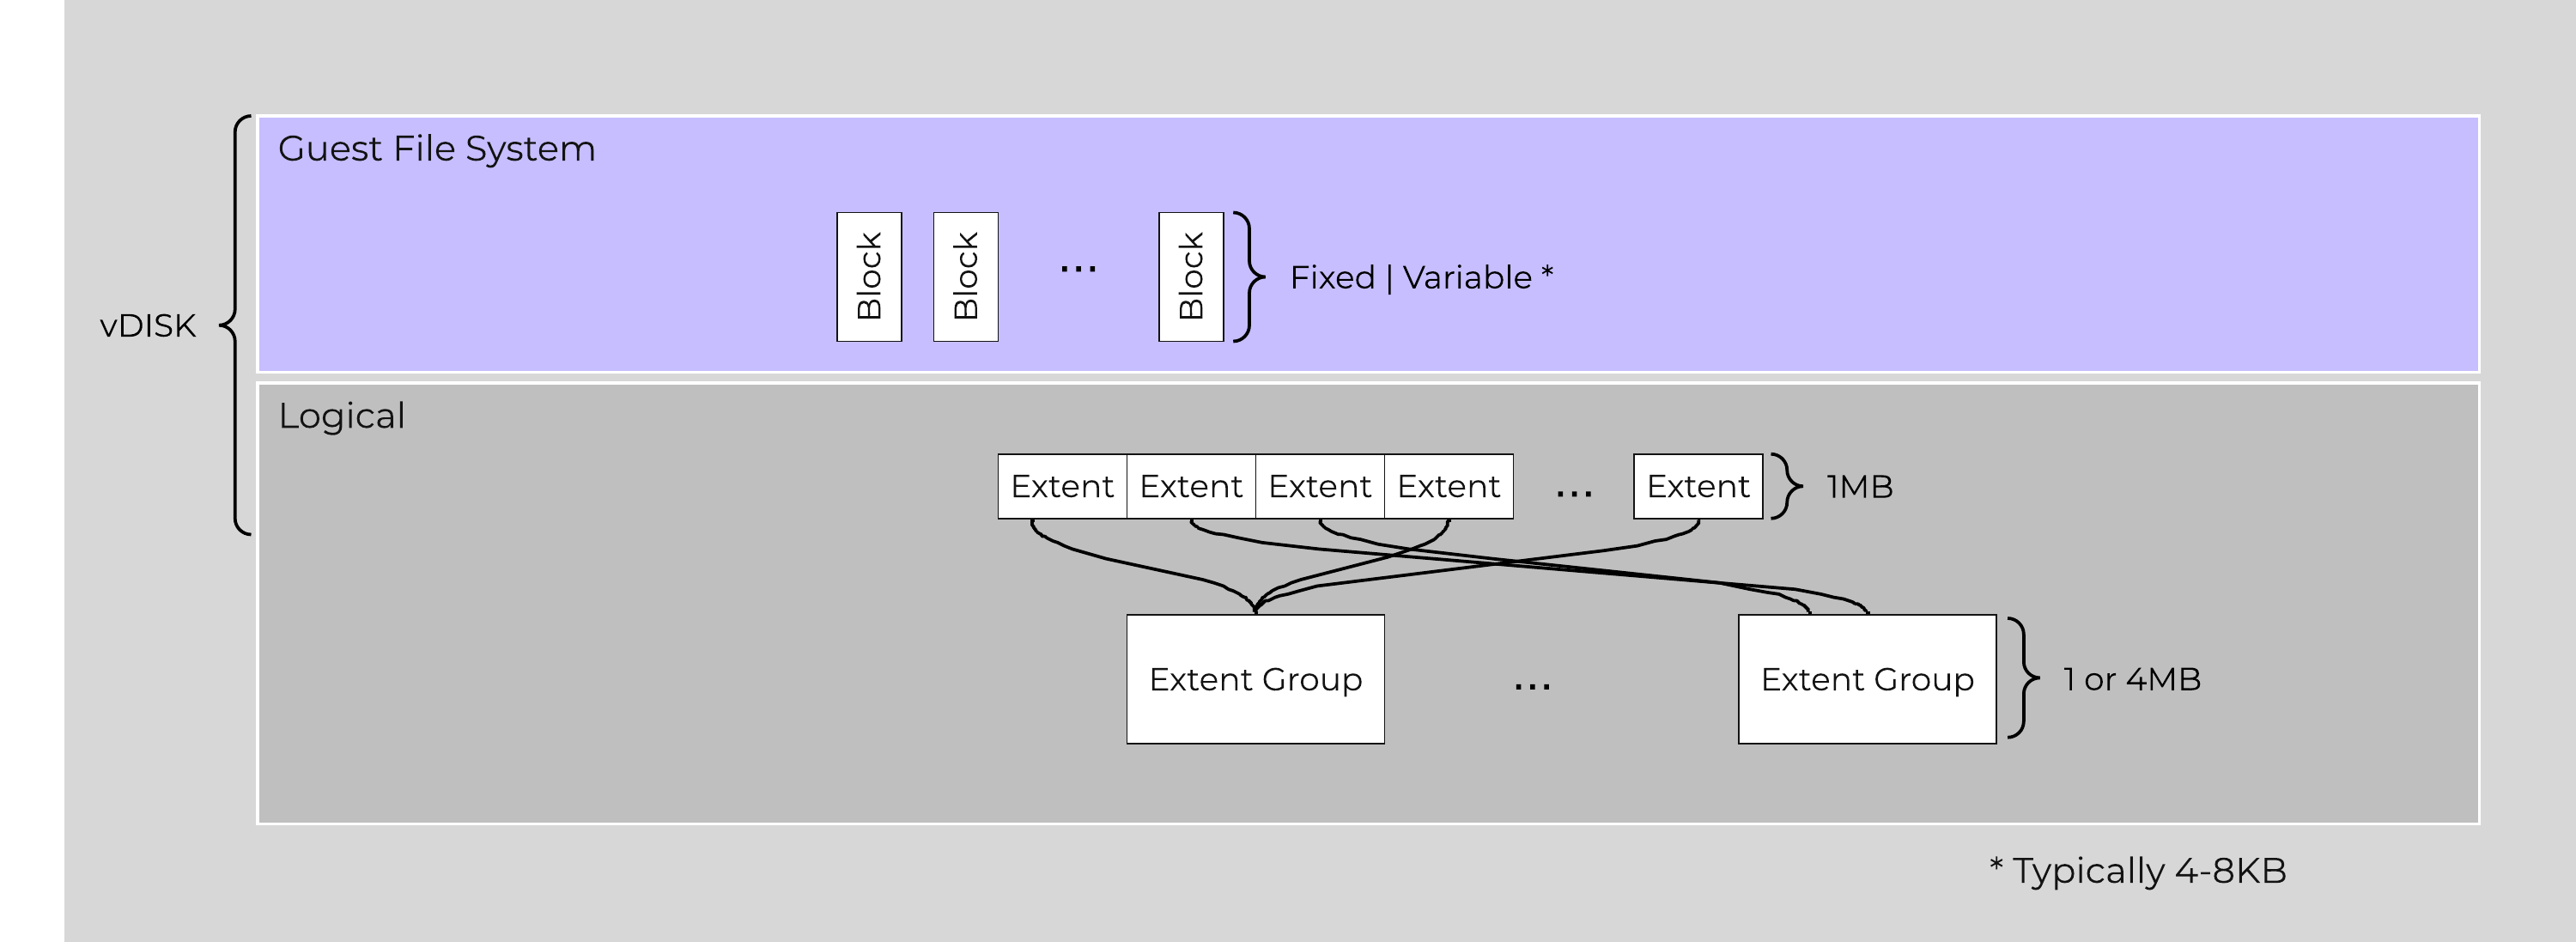 Graphical Filesystem Breakdown
I/O Path and Cache
For a visual explanation, you can watch the following video: LINK
The typical hyperconverged storage I/O path can be characterized into the following core layers:
- Guest OS (UVM) to virtual disk(s)
- This remains unchanged with Nutanix. Depending on the hypervisor the guest OS will use a device driver to talk to a virtual disk device. Depending on the hypervisor this could be virtio-scsi (AHV), pv-scsi (ESXi), etc. The virtual disks will also vary based upon the hypervisor (e.g. vmdk, vhd, etc.)
- Hypervisor to AOS (via CVM)
- Communication between the hypervisor and Nutanix occurs via standard storage protocols (e.g. iSCSI, NFS, SMBv3) over the local interface of the CVM and hypervisor. At this point all communication has been local to the host (there are scenarios where I/O will be remote (e.g. local CVM down, etc.).
- Nutanix I/O path
- This is all transparent to the hypervisor and UVMs and it native to the Nutanix platform.
The following image shows a high-level overview of these layers:
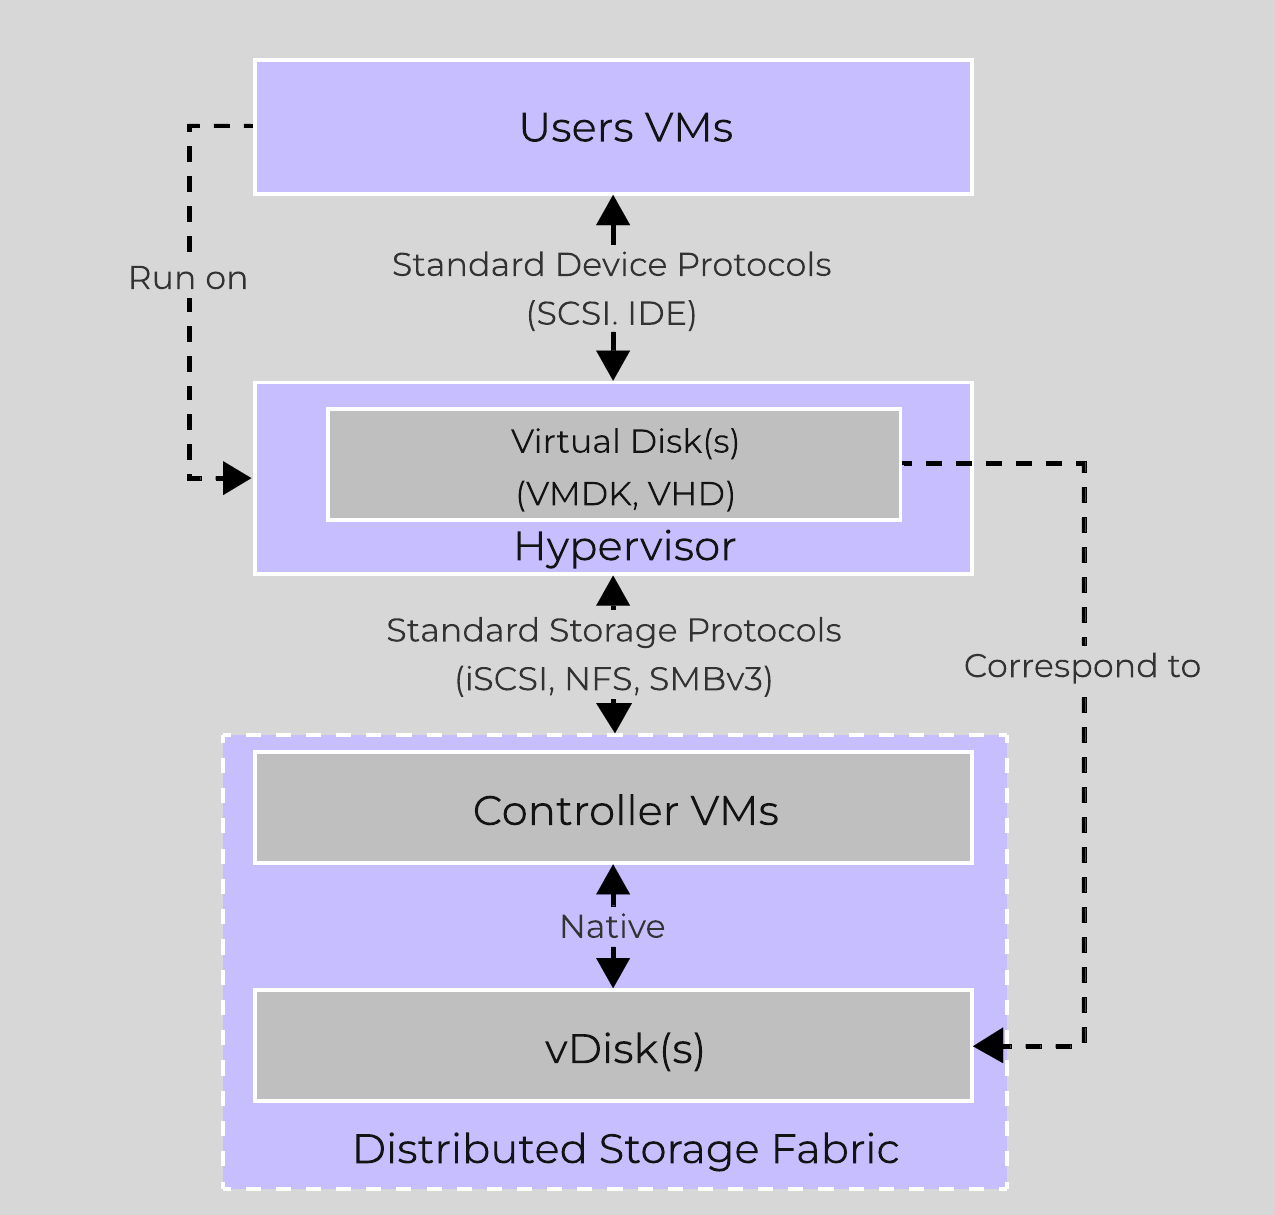 High-level I/O Path - Traditional
Communication and I/O
Within the CVM the Stargate process is responsible for handling all storage I/O requests and interaction with other CVMs / physical devices. Storage device controllers are passed through directly to the CVM so all storage I/O bypasses the hypervisor.
The following image shows a high-level overview of the traditional I/O path:
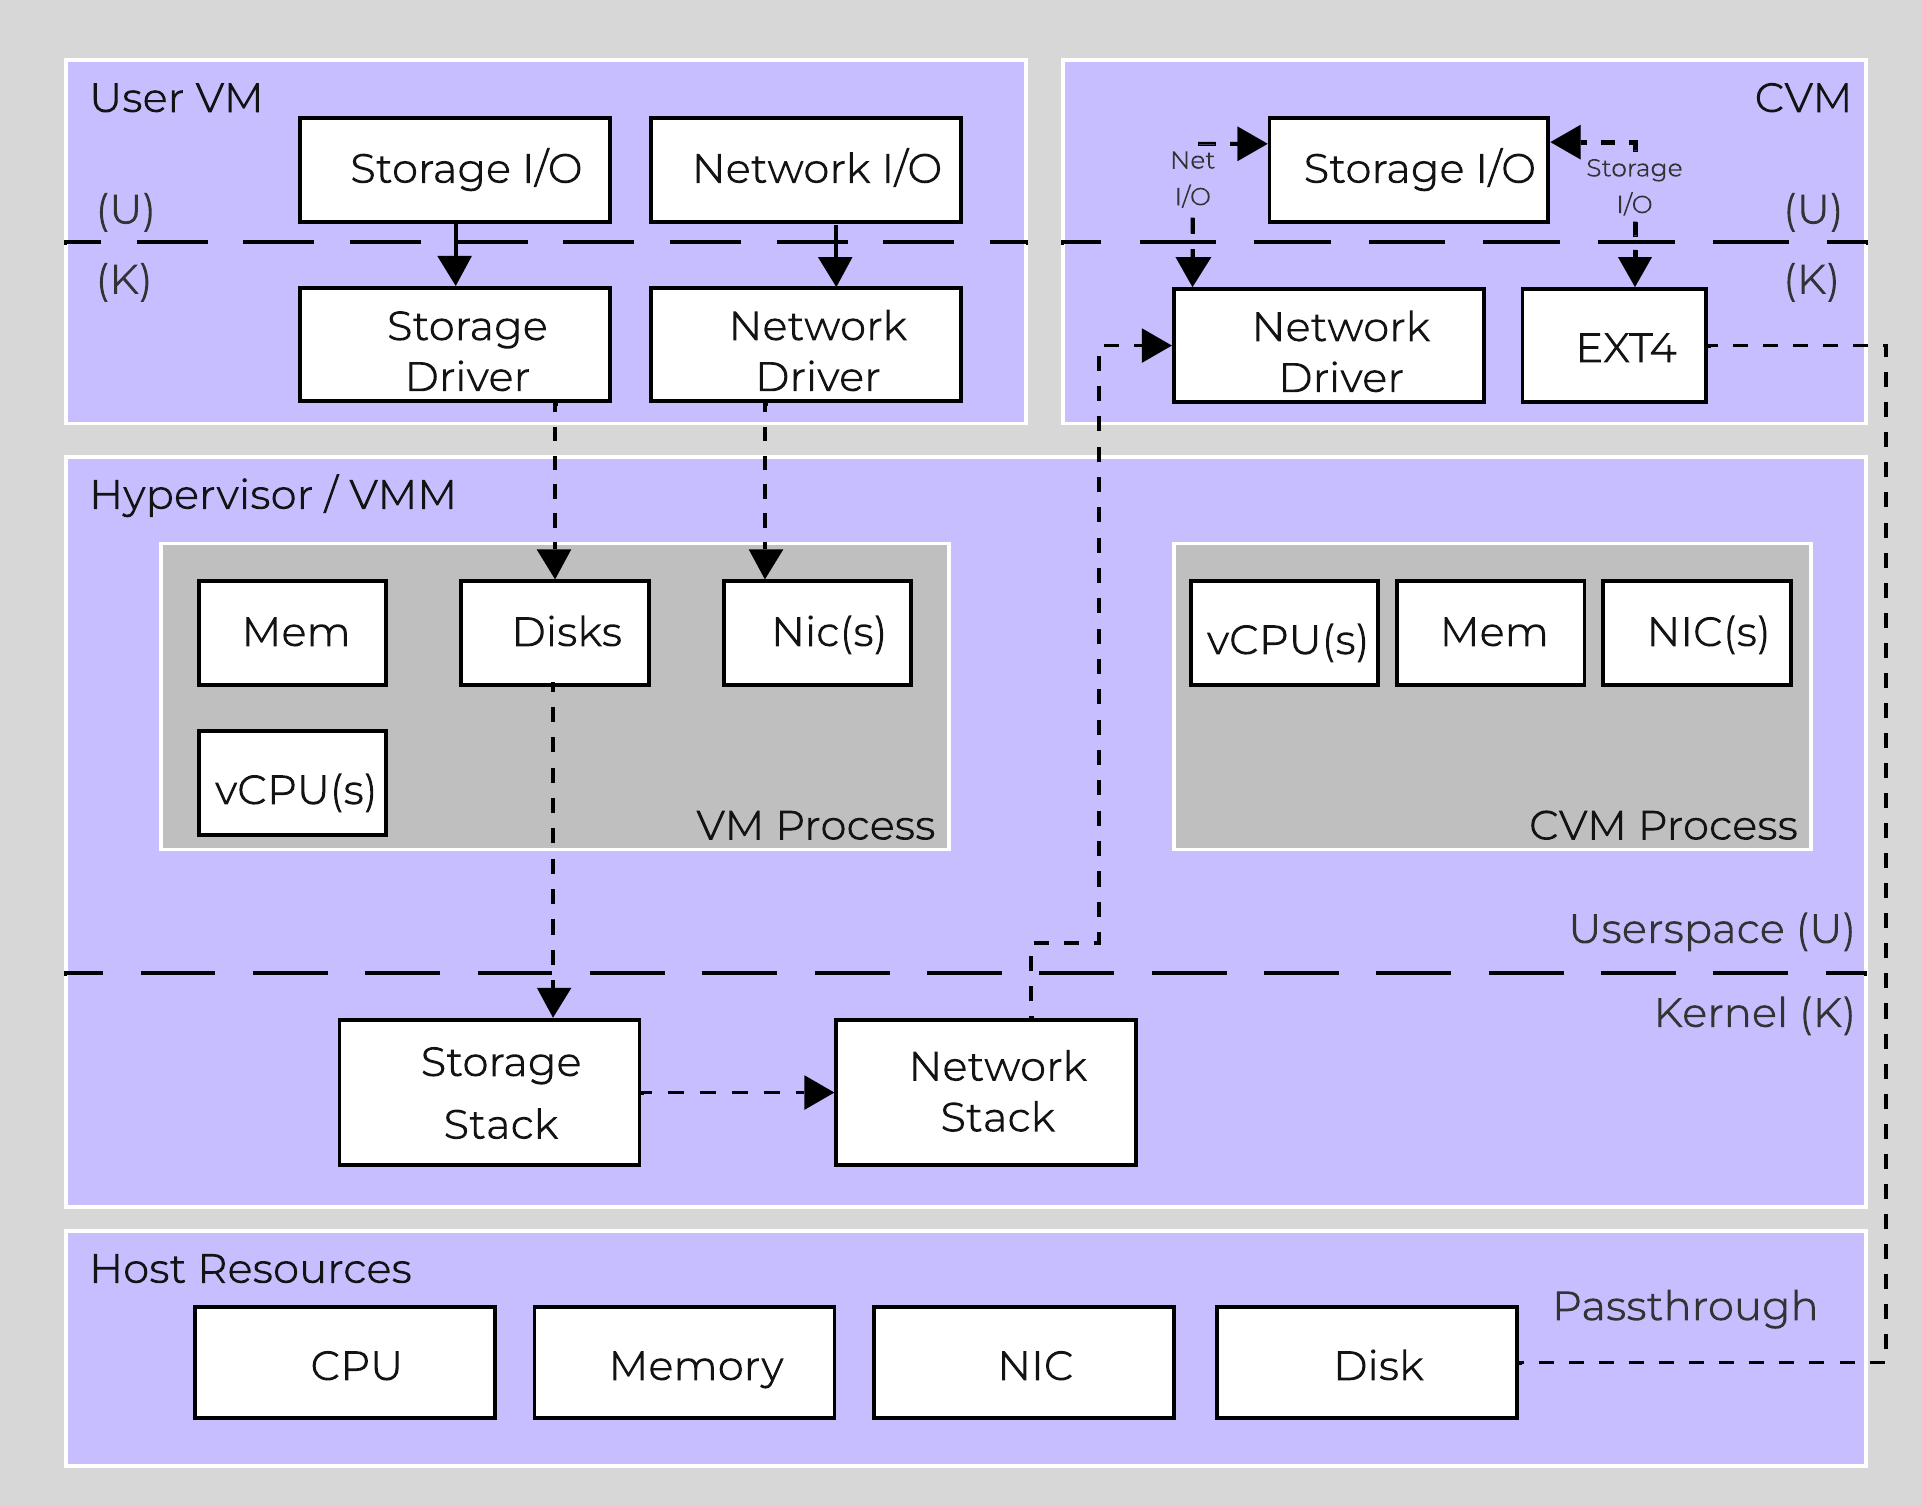 High-level I/O Path
Nutanix BlockStore is an AOS capability which creates an extensible filesystem and block management layer all handled in user space. This eliminates the filesystem from the devices and removes the invoking of any filesystem kernel driver. The introduction of newer storage media (e.g. NVMe), devices now come with user space libraries to handle device I/O directly (e.g. SPDK) eliminating the need to make any system calls (context switches). With the combination of BlockStore + SPDK all Stargate device interaction has moved into user space eliminating any context switching or kernel driver invocation.
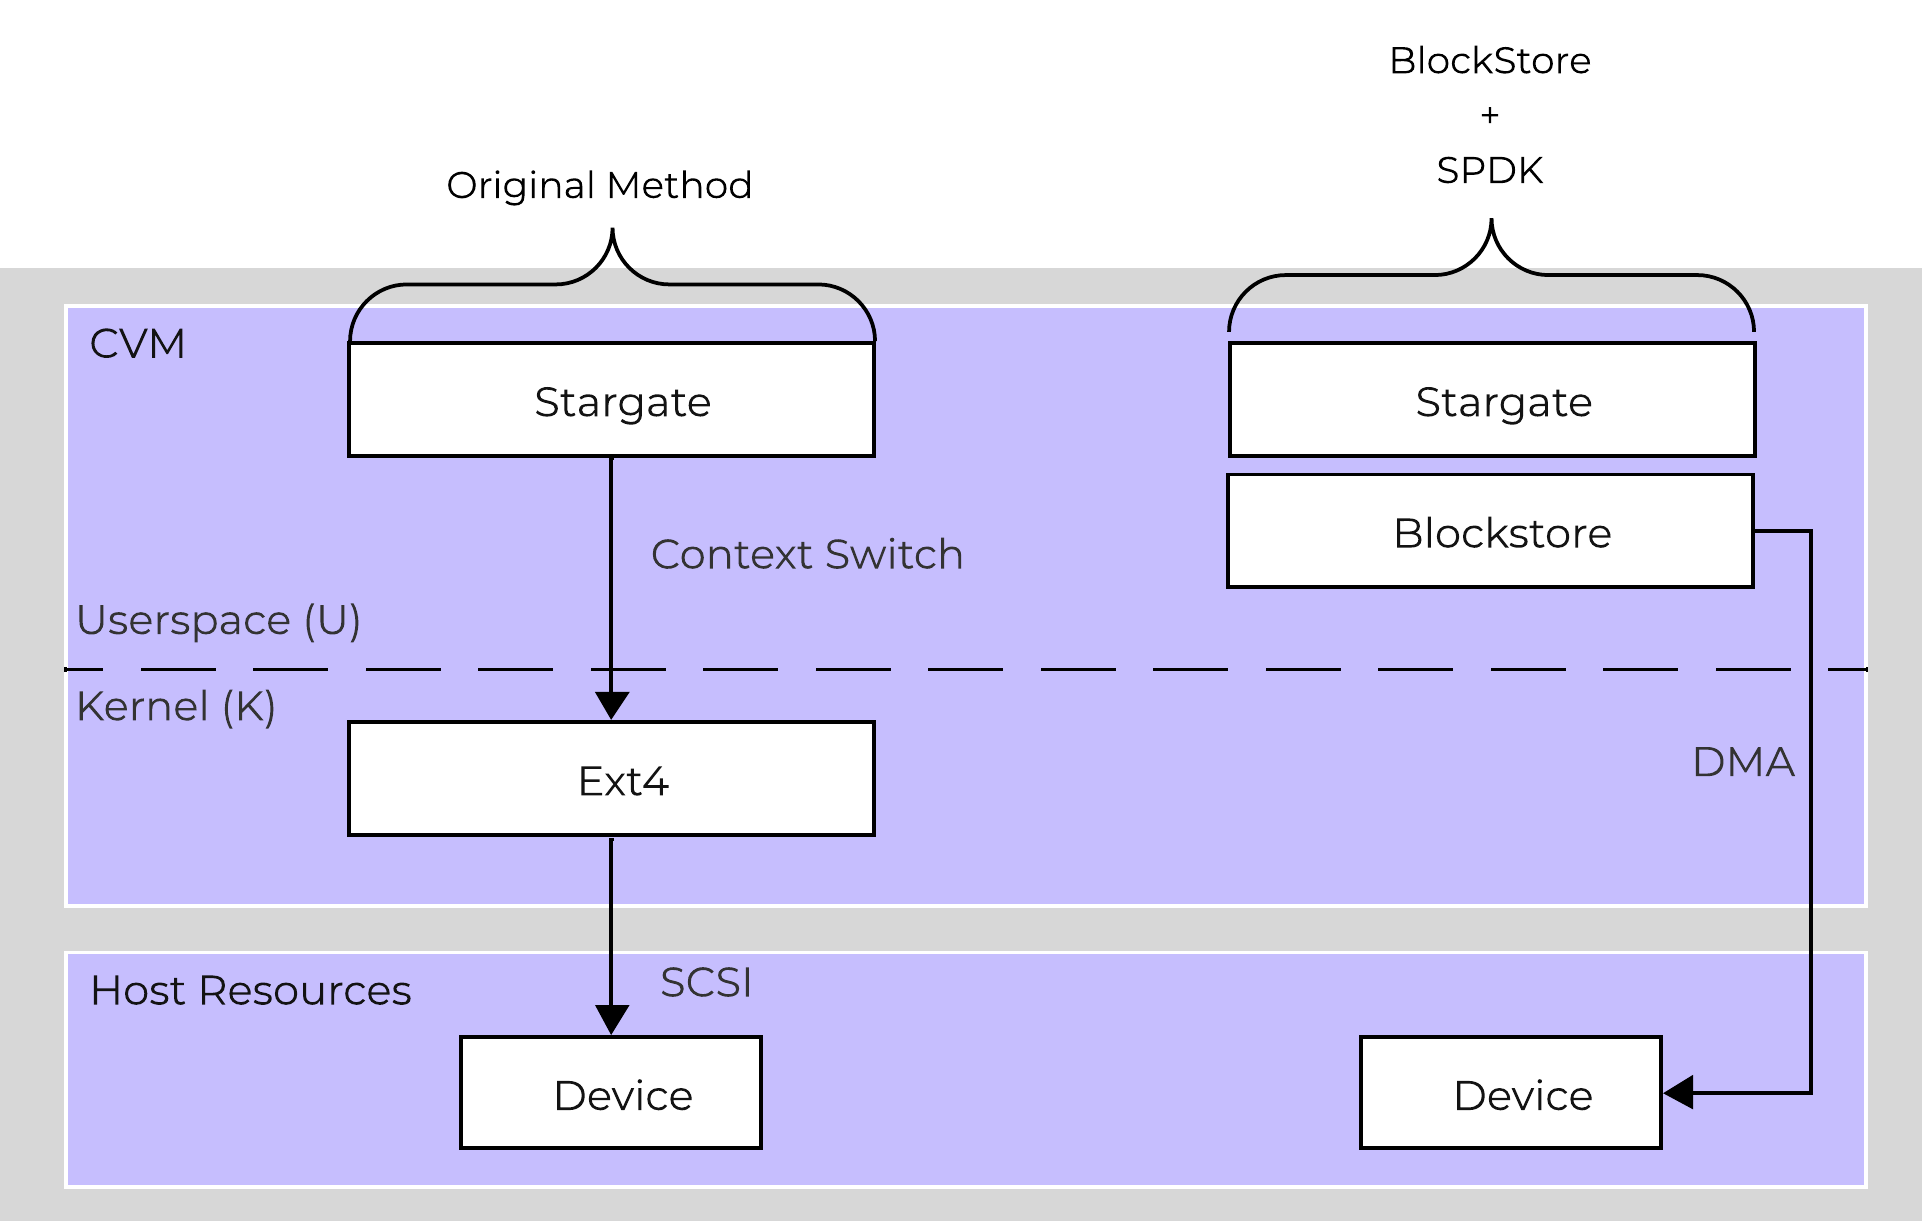 Stargate - Device I/O Path
The following image shows a high-level overview of the updated I/O path with BlockStore + SPDK:
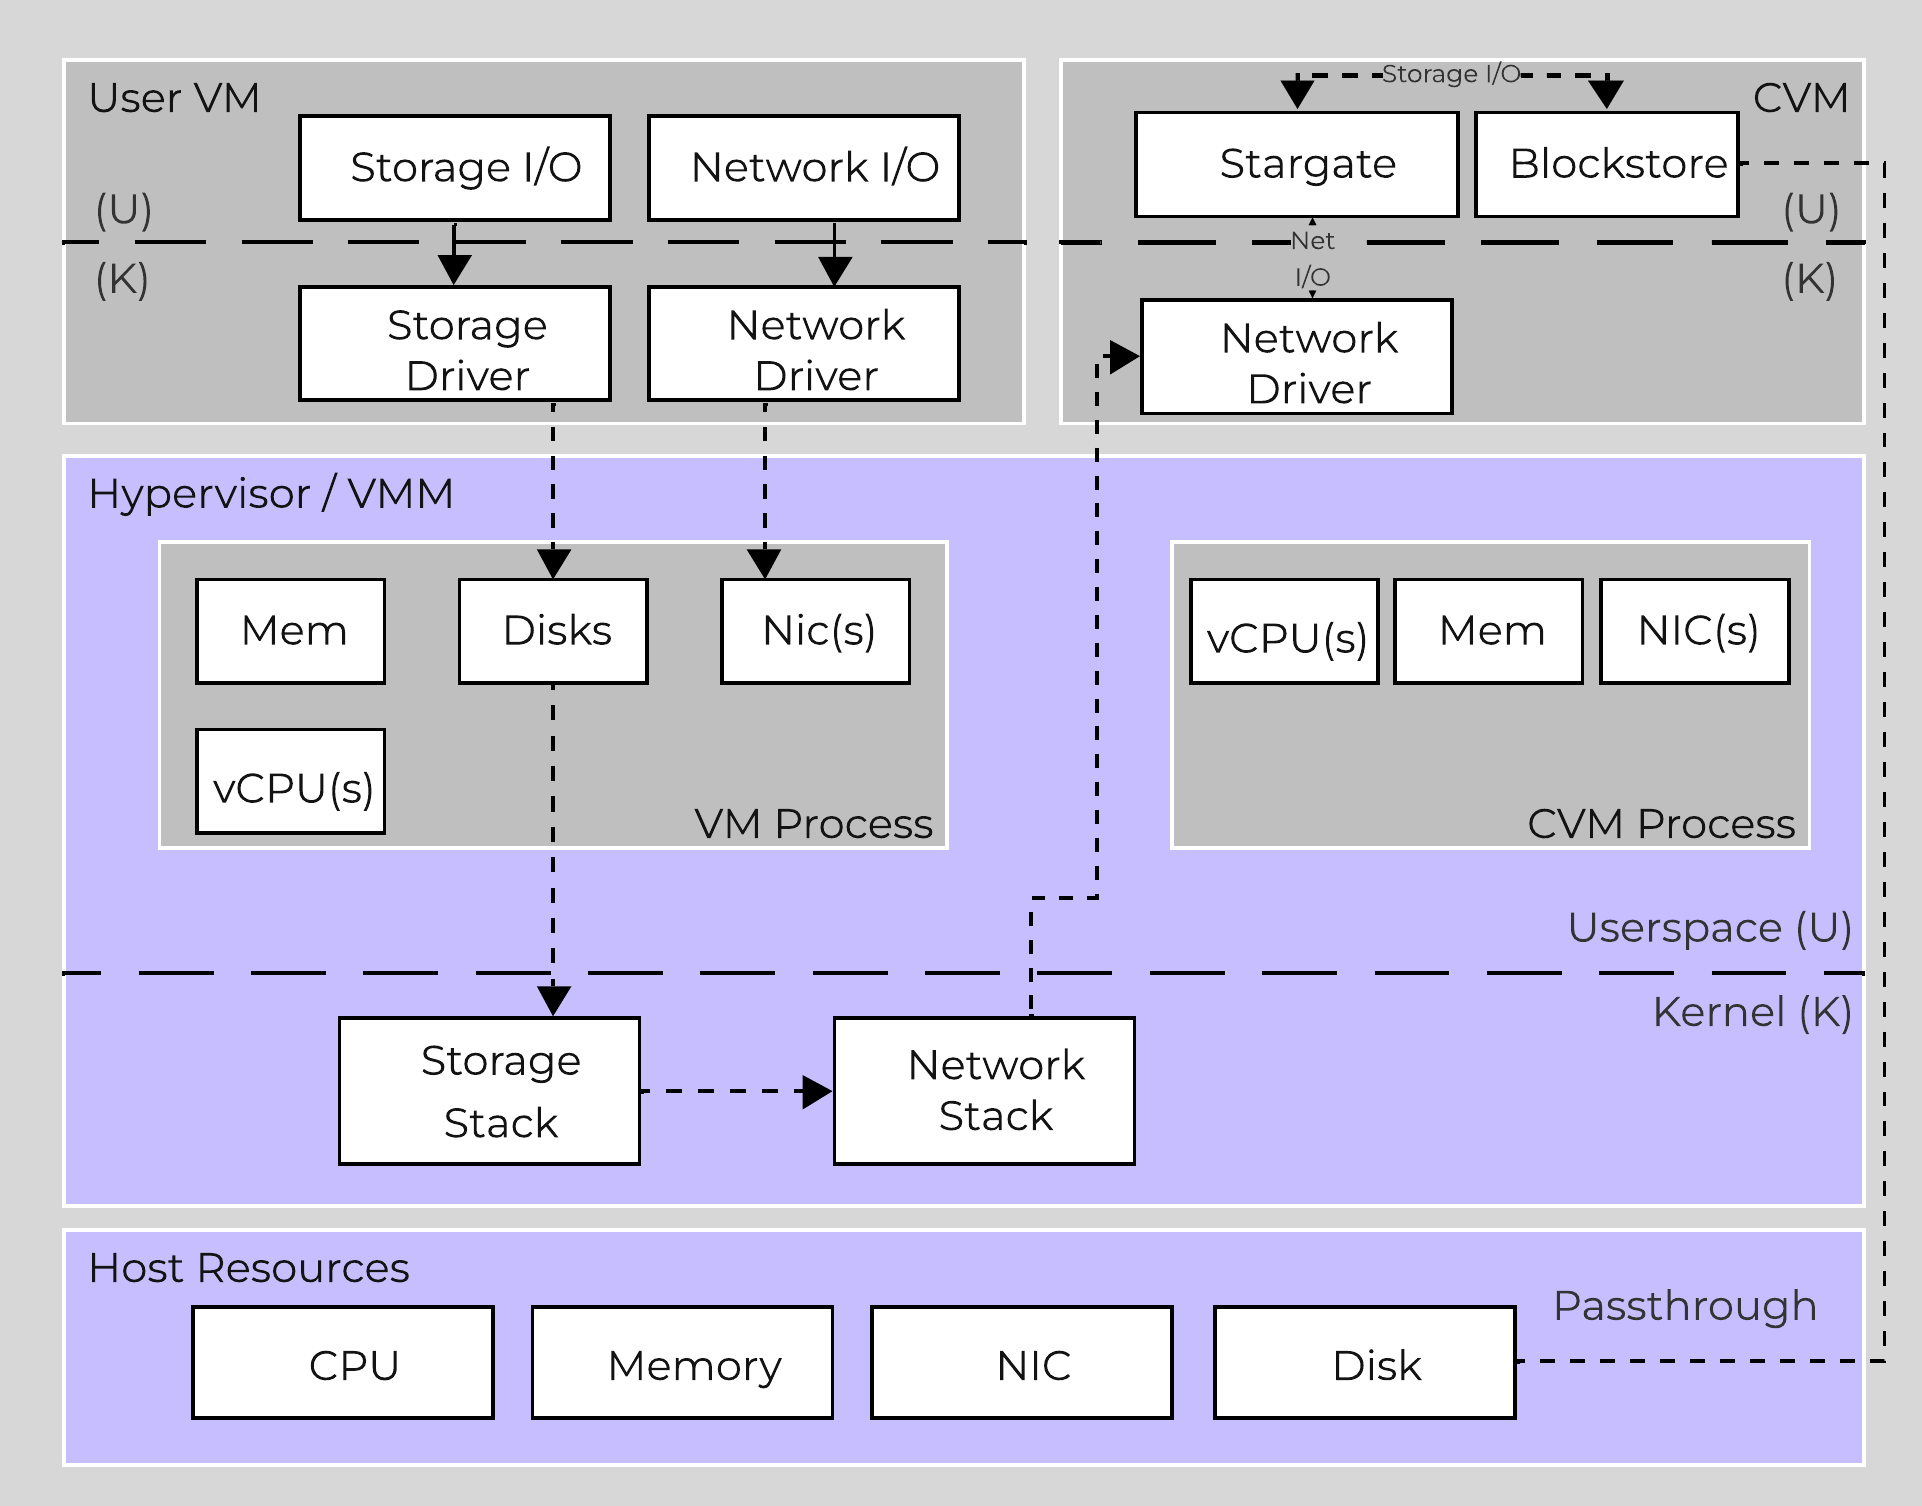 High-level I/O Path - BlockStore
To perform data replication the CVMs communicate over the network. With the default stack this will invoke kernel level drivers to do so.
However, with RDMA these NICs are passed through to the CVM, bypassing the hypervisor and reducing interrupts. Also, within the CVM all network traffic using RDMA only uses a kernel level driver for the control path, then all actual data I/O is done in user-space without any context switches.
The following image shows a high-level overview of the I/O path with RDMA:
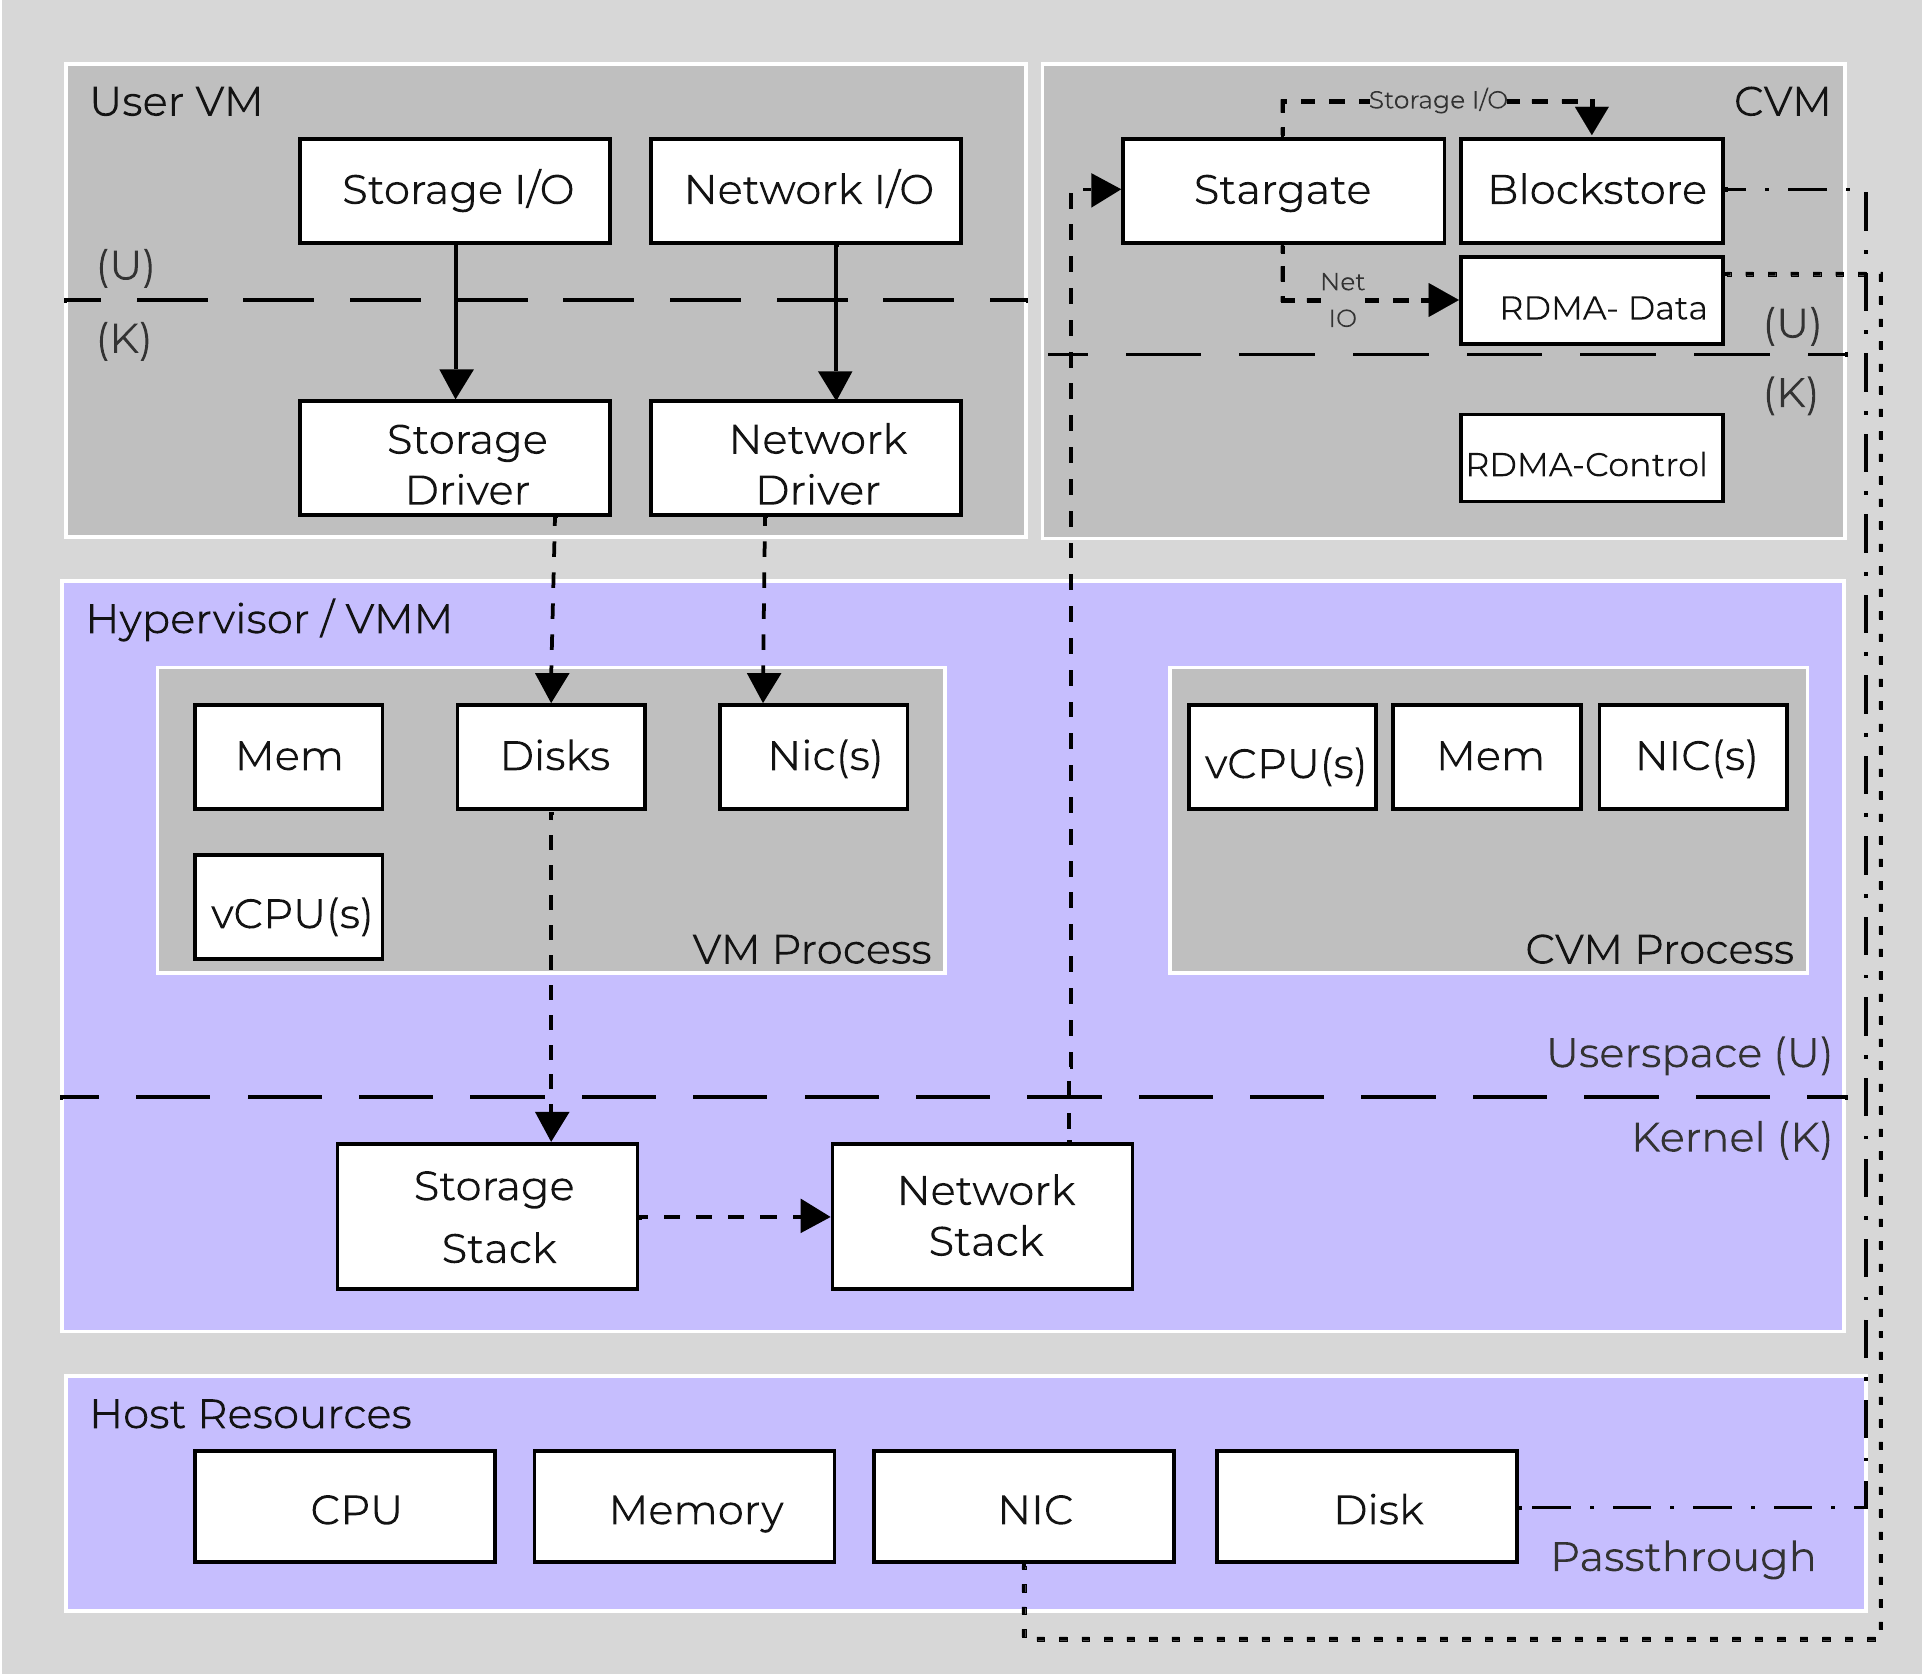 High-level I/O Path - RDMA
To summarize, the following enhancements optimize with the following:
- PCI passthrough bypasses the hypervisor for device I/O
- SPDK + Blockstore eliminates kernel storage driver interactions and moves them to user-space
- RDMA bypasses the hypervisor and all data transfer is done in CVM user-space
N
Stargate I/O Logic
Within the CVM the Stargate process is responsible for handling all I/O coming from user VMs (UVMs) and persistence (RF, etc.). When a write request comes to Stargate, there is a write characterizer which will determine if the write gets persisted to the OpLog for bursty random writes, or to Extent Store for sustained random and sequential writes. Read requests are satisfied from Oplog or Extent Store depending on where the data is residing when it is requested.
The Nutanix I/O path is composed of the following high-level components:
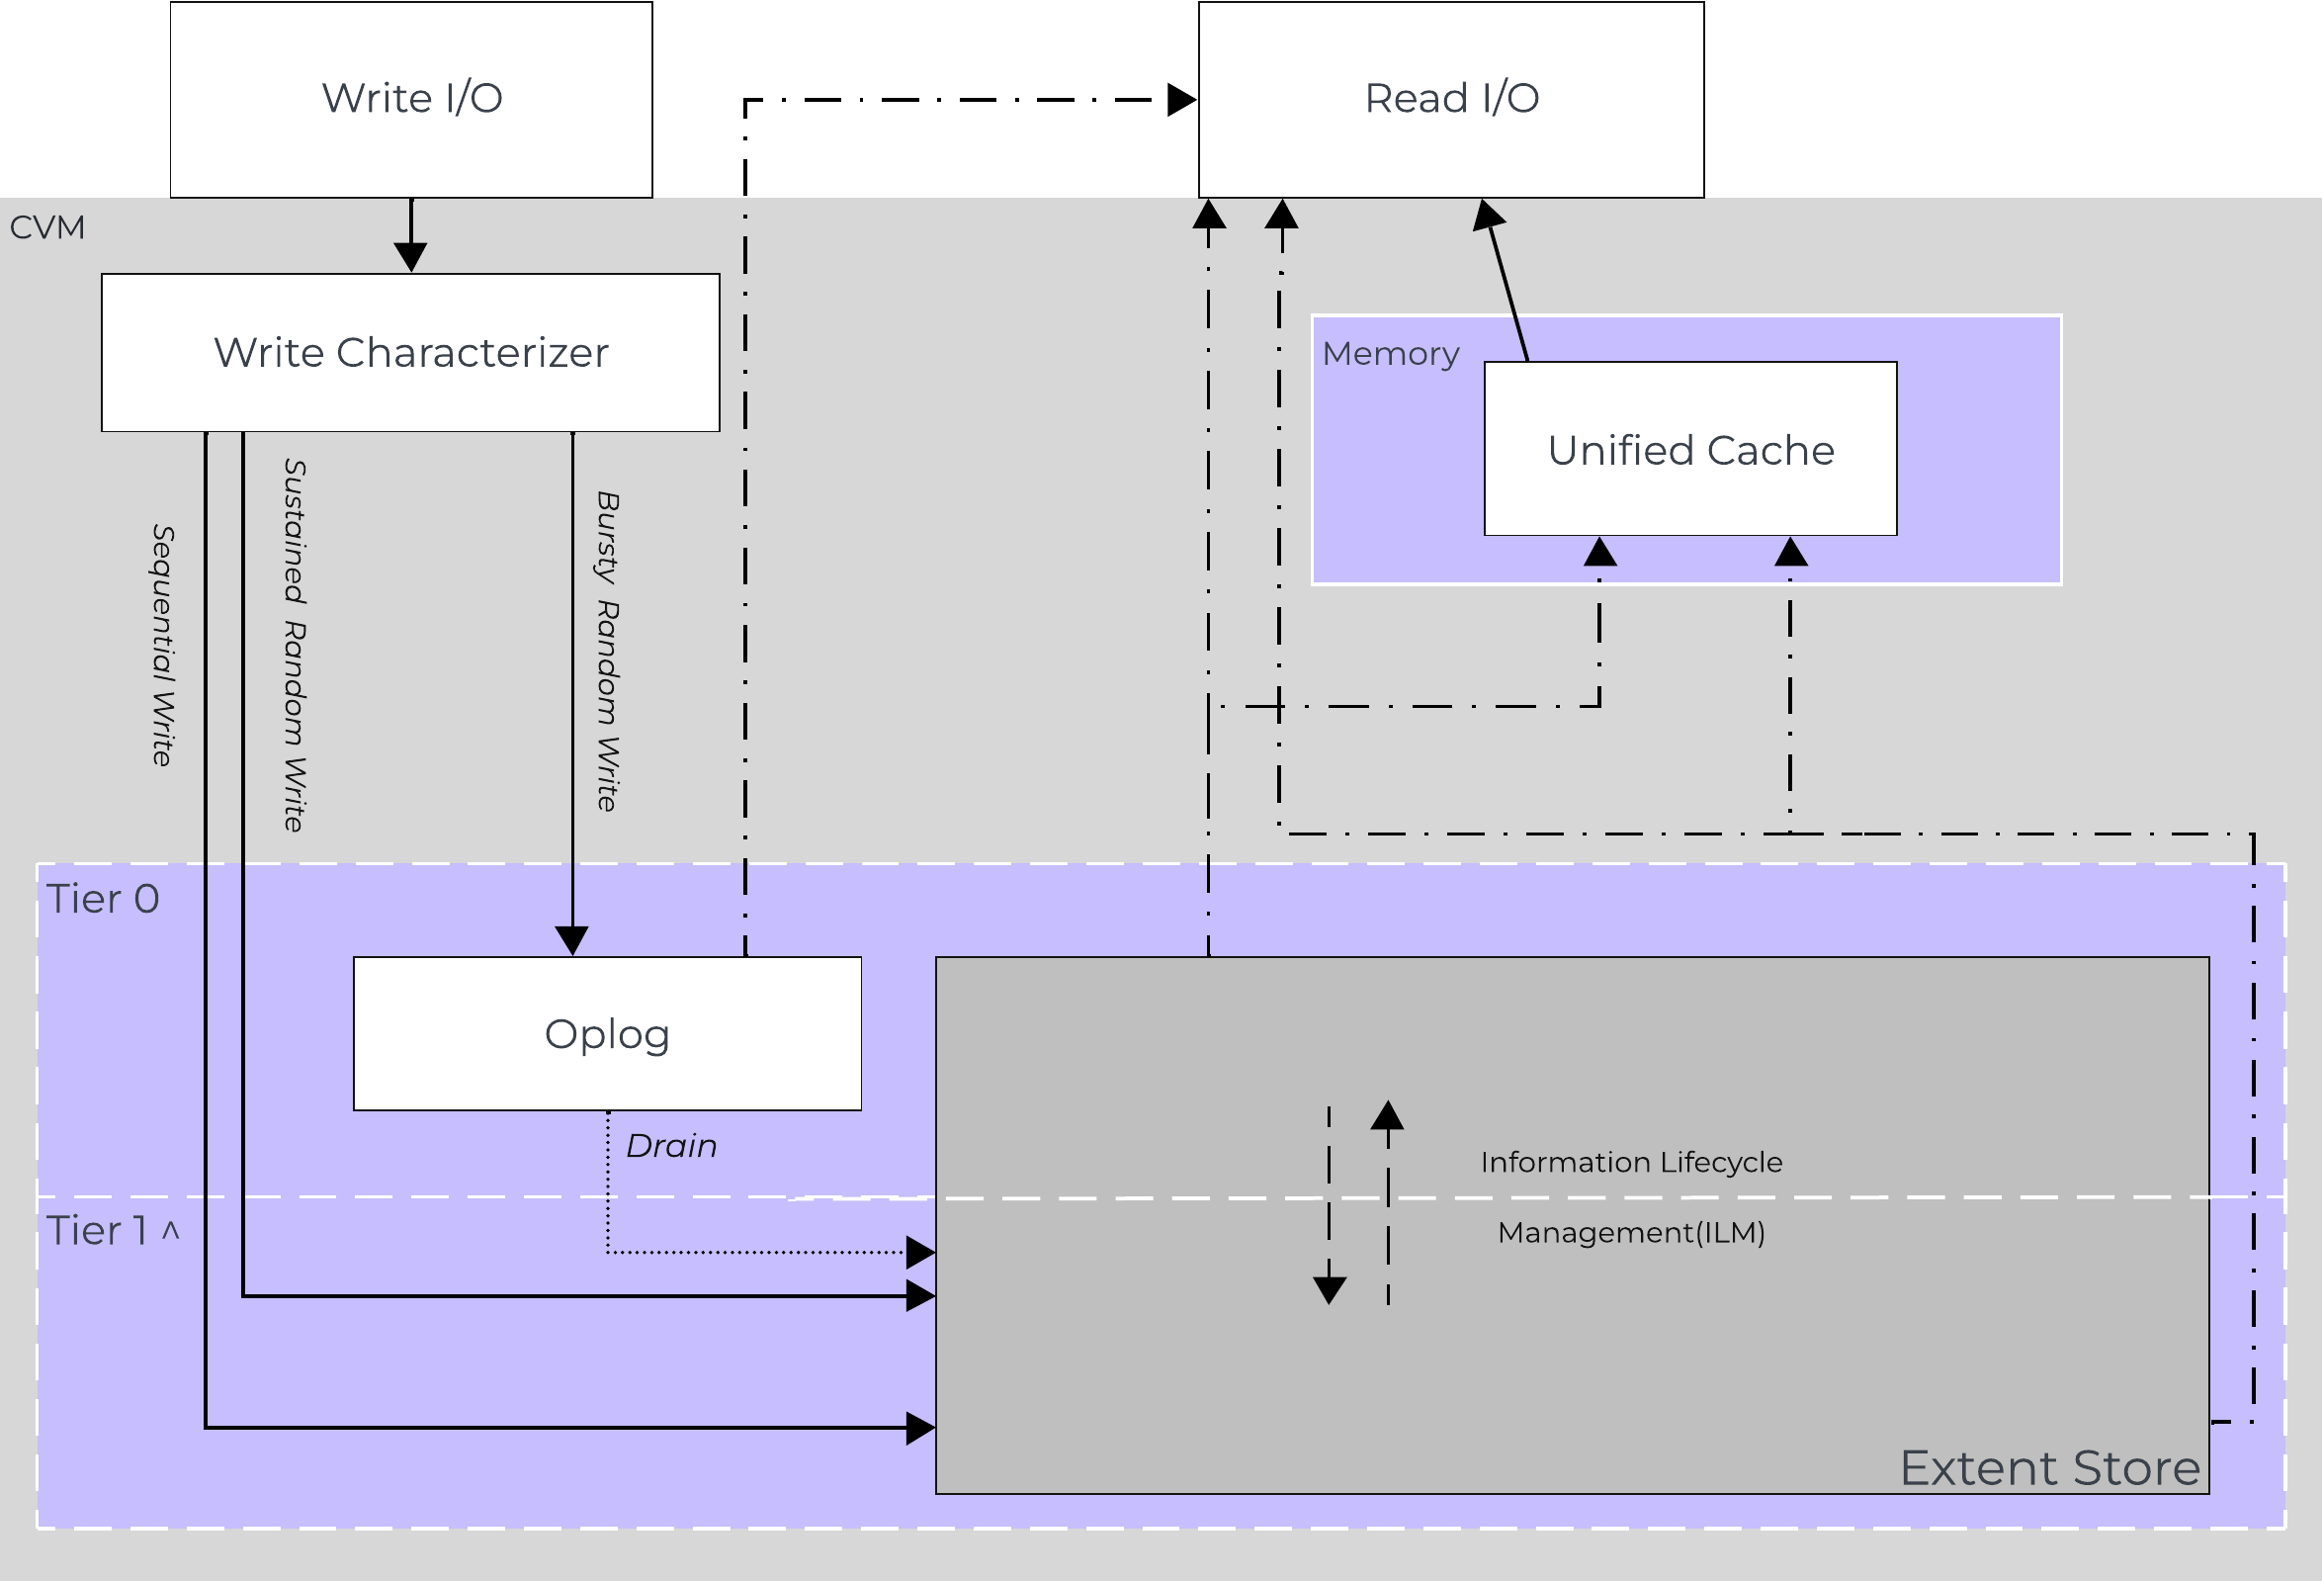 AOS I/O Path
^:
- In all-flash node configurations (All NVMe SSD, All SATA/SAS SSD, NVMe+SATA/SAS SSD) the Extent Store will only consist of SSD devices and no tier ILM will occur as only a single flash tier exists.
- In cases where Optane is used (e.g. Intel Optane + NVMe/SATA SSD) the highest performance media will be Tier 0 and the lower performance media will be Tier 1.
- For hybrid scenarios with flash and HDD, the flash would be Tier 0 with HDD being Tier 1.
- OpLog is always on SSDs in Hybrid Clusters and on both Optane and NVMe SSDs in Optane+NVMe clusters.
- Data is moved between tiers by Intelligent Lifecycle Management (ILM) based on access patterns.
OpLog
- Key Role: Persistent write buffer
- Description: The OpLog is similar to a filesystem journal and is built as a staging area to handle bursts of random writes, coalesce them, and then sequentially drain the data to the extent store. Upon a write, the OpLog is synchronously replicated to another n number of CVM’s OpLog before the write is acknowledged for data availability purposes. All CVM OpLogs partake in the replication and are dynamically chosen based upon load. The OpLog is stored on the SSD tier on the CVM to provide extremely fast write I/O performance, especially for random I/O workloads. All SSD devices participate and handle a portion of OpLog storage. For sequential workloads, the OpLog is bypassed and the writes go directly to the extent store. If data is currently sitting in the OpLog and has not been drained, all read requests will be directly fulfilled from the OpLog until they have been drained, where they would then be served by the extent store/unified cache. For containers where fingerprinting (aka Dedupe) has been enabled, all write I/Os will be fingerprinted using a hashing scheme allowing them to be deduplicated based upon fingerprint in the unified cache.
Extent Store
- Key Role: Persistent data storage
- Description: The Extent Store is the persistent bulk storage of AOS and spans all device tiers (NVME, PCIe SSD, SATA SSD, HDD) and is extensible to facilitate additional devices/tiers. Data entering the extent store is either being A) drained from the OpLog or B) is sequential/sustained in nature and has bypassed the OpLog directly. Nutanix ILM will determine tier placement dynamically based upon I/O patterns, number of accesses of data and weight given to individual tiers and will move data between tiers.
Note
Sequential Write Characterization
Write IO is deemed as sequential when there is more than 1.5MB of outstanding write IO to a vDisk. IOs meeting this will bypass the OpLog and go directly to the Extent Store since they are already large chunks of aligned data and won't benefit from coalescing.
This is controlled by the following Gflag: vdisk_distributed_oplog_skip_min_outstanding_write_bytes.
All other IOs, including those which can be large (e.g. >64K) will still be handled by the OpLog.
Autonomous Extent Store (AES)
- Key Role: Persistent data storage
-
Description: The Autonomous Extent Store (AES) is a method for writing / storing data in the Extent Store. It leverages a mix of primarily local + global metadata (more detail in the ‘Scalable Metadata’ section following) allowing for much more efficient sustained performance due to metadata locality. For sustained random write workloads, these will bypass the OpLog and be written directly to the Extent Store using AES. For bursty random workloads these will take the typical OpLog I/O path then drain to the Extent Store using AES where possible.
In AOS 6.8, an enhancement to AES was introduced called AES Optimized Metadata to improve performance and maximize resource utlization for all-flash and NVMe clusters. It was built to reduce CPU usage and drive the performance for sustained random writes going to the Extent Store. With AES Optimized Metadata, writes are batched into fewer transaction updates. This helps in reducing the number of disk operations needed to persist sustained random writes to the extent store. This translates to more optimized CPU usage through fewer cycles consumed and drives higher sustained random write performance on all-flash and NVME clusters.
Unified Cache
- Key Role: Dynamic read cache
- Description: The Unified Cache is a read cache which is used for data, metadata and deduplication and stored in the CVM’s memory. Upon a read request of data not in the cache (or based upon a particular fingerprint), the data will be read from the extent store and will also be placed into the single-touch pool of the Unified Cache which completely sits in memory, where it will use LRU (least recently used) until it is evicted from the cache. Any subsequent read request will “move” (no data is actually moved, just cache metadata) the data into the multi-touch pool. Any read request for data in the multi-touch pool will cause the data to go to the peak of the multi-touch pool where it will be given a new LRU counter. Cache size can be calculated using the following formula: ((CVM Memory - 12 GB) * 0.45). For example a 32GB CVM would have the following cache size: ((32 - 12)*0.45) == 9GB.
The following figure shows a high-level overview of the Unified Cache:
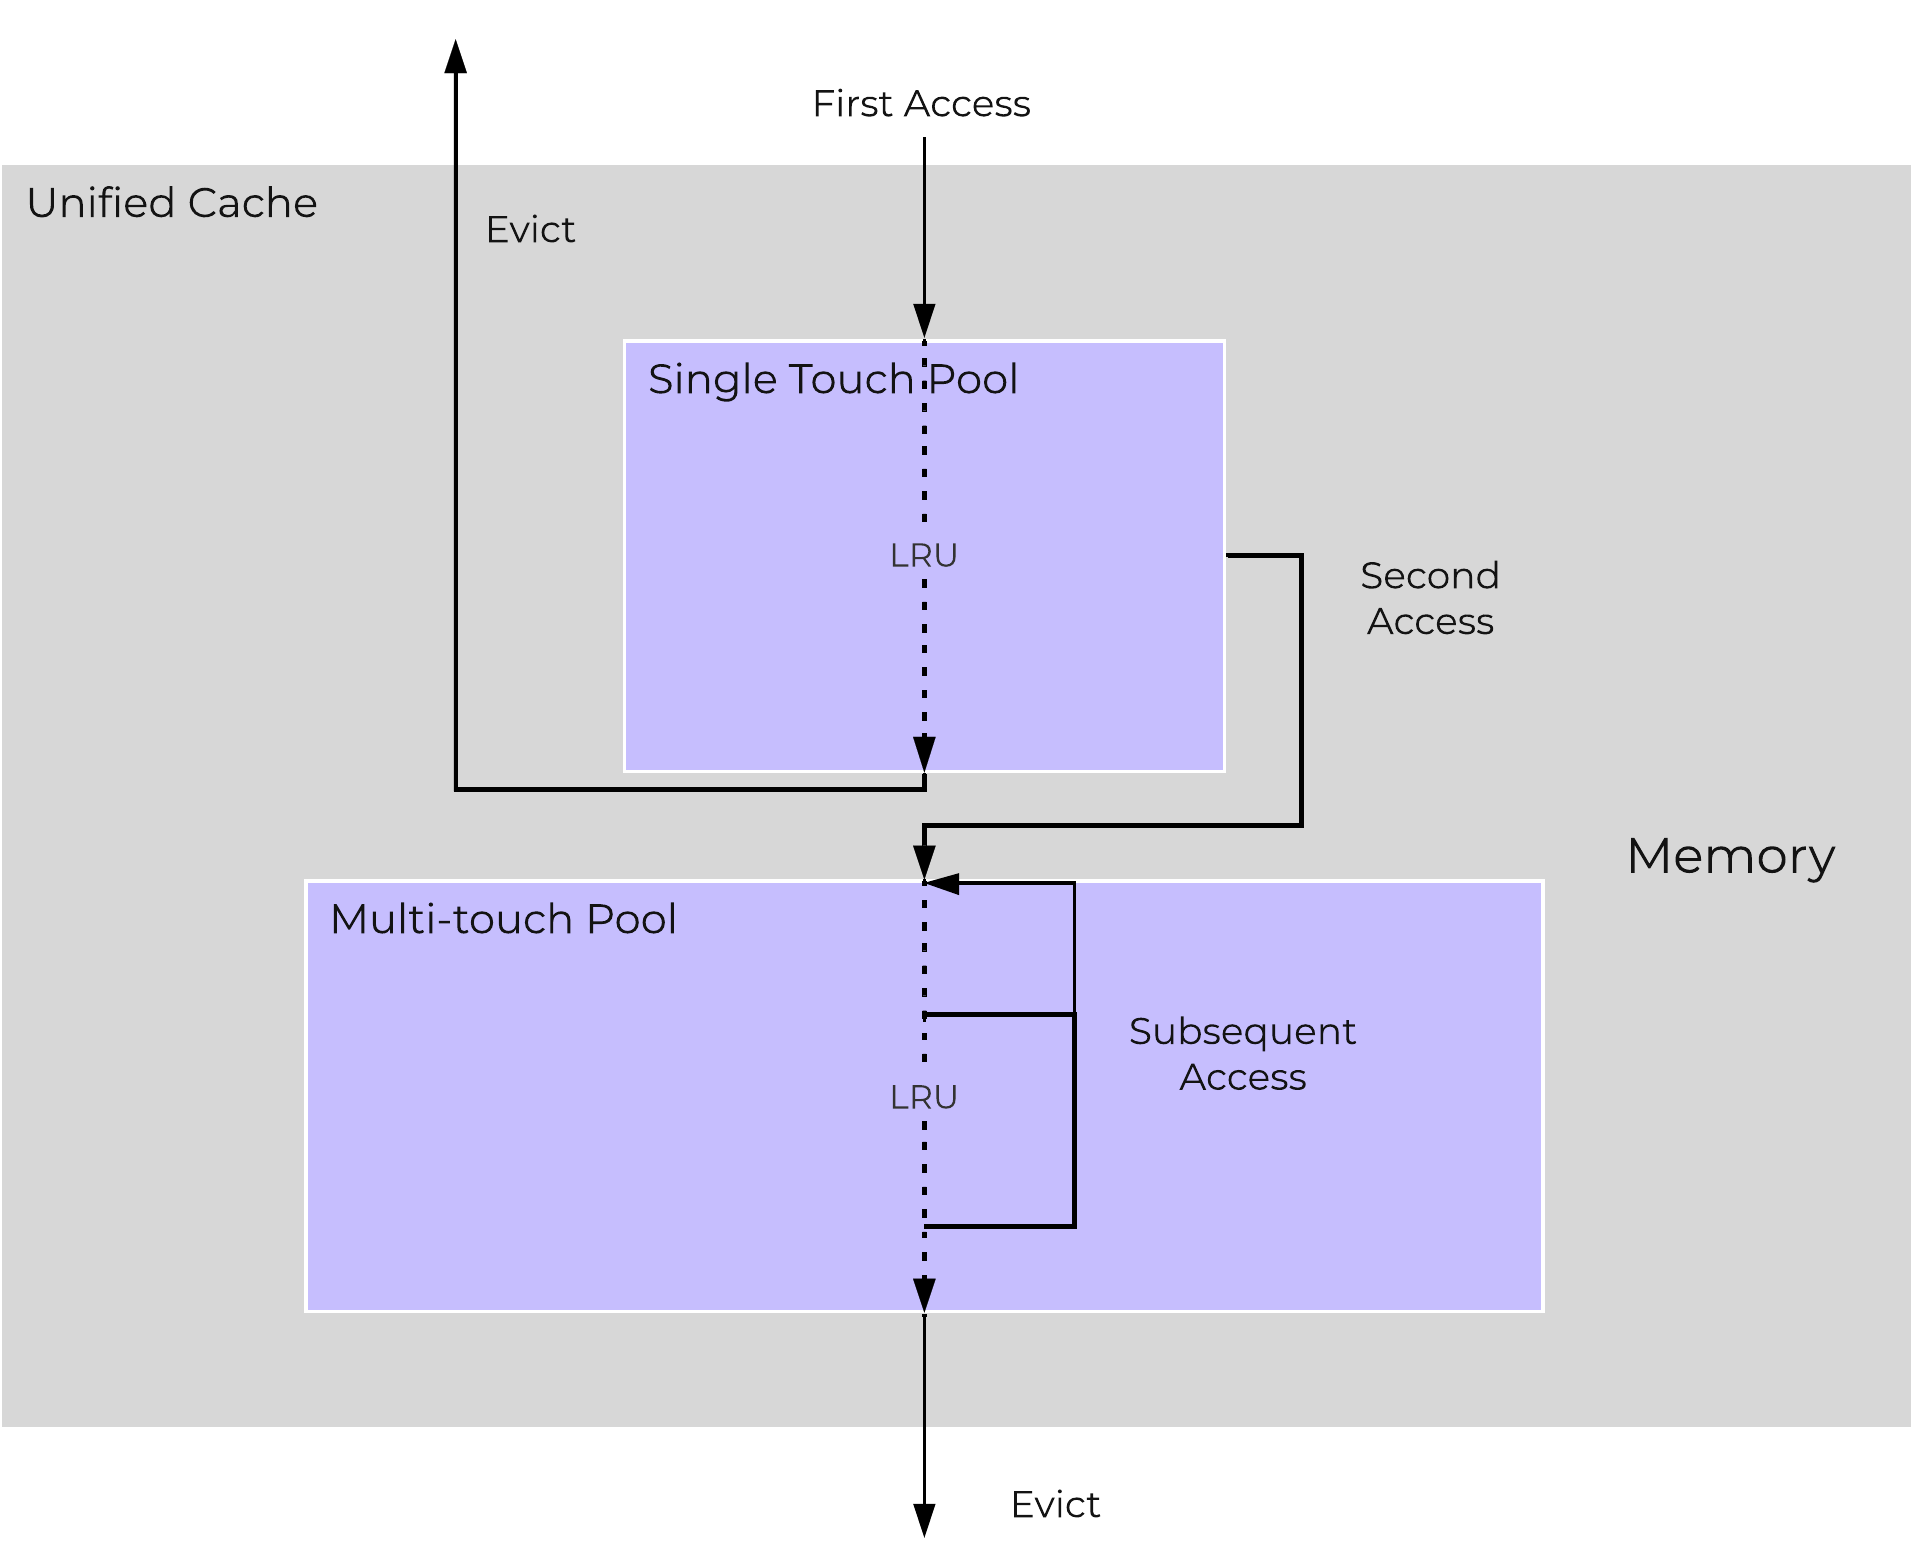 AOS Unified Cache
Note
Cache Granularity and Logic
Data is brought into the cache at a 4K granularity and all caching is done real-time (e.g. no delay or batch process data to pull data into the cache).
Each CVM has its own local cache that it manages for the vDisk(s) it is hosting (e.g. VM(s) running on the same node). When a vDisk is cloned (e.g. new clones, snapshots, etc.) each new vDisk has its own block map and the original vDisk is marked as immutable. This allows us to ensure that each CVM can have it's own cached copy of the base vDisk with cache coherency.
In the event of an overwrite, that will be re-directed to a new extent in the VM's own block map. This ensures that there will not be any cache corruption.
Single vDisk Sharding
AOS was designed and architected to deliver performance for applications at scale. Inside Stargate, I/O is processed by threads for every vdisk created by something called vdisk controller. Every vdisk gets its own vdisk controller inside Stargate responsible for I/O for that vdisk. The expectation was that workloads and applications would have multiple vdisks each having its own vdisk controller thread capable of driving high performance the system is capable of delivering.
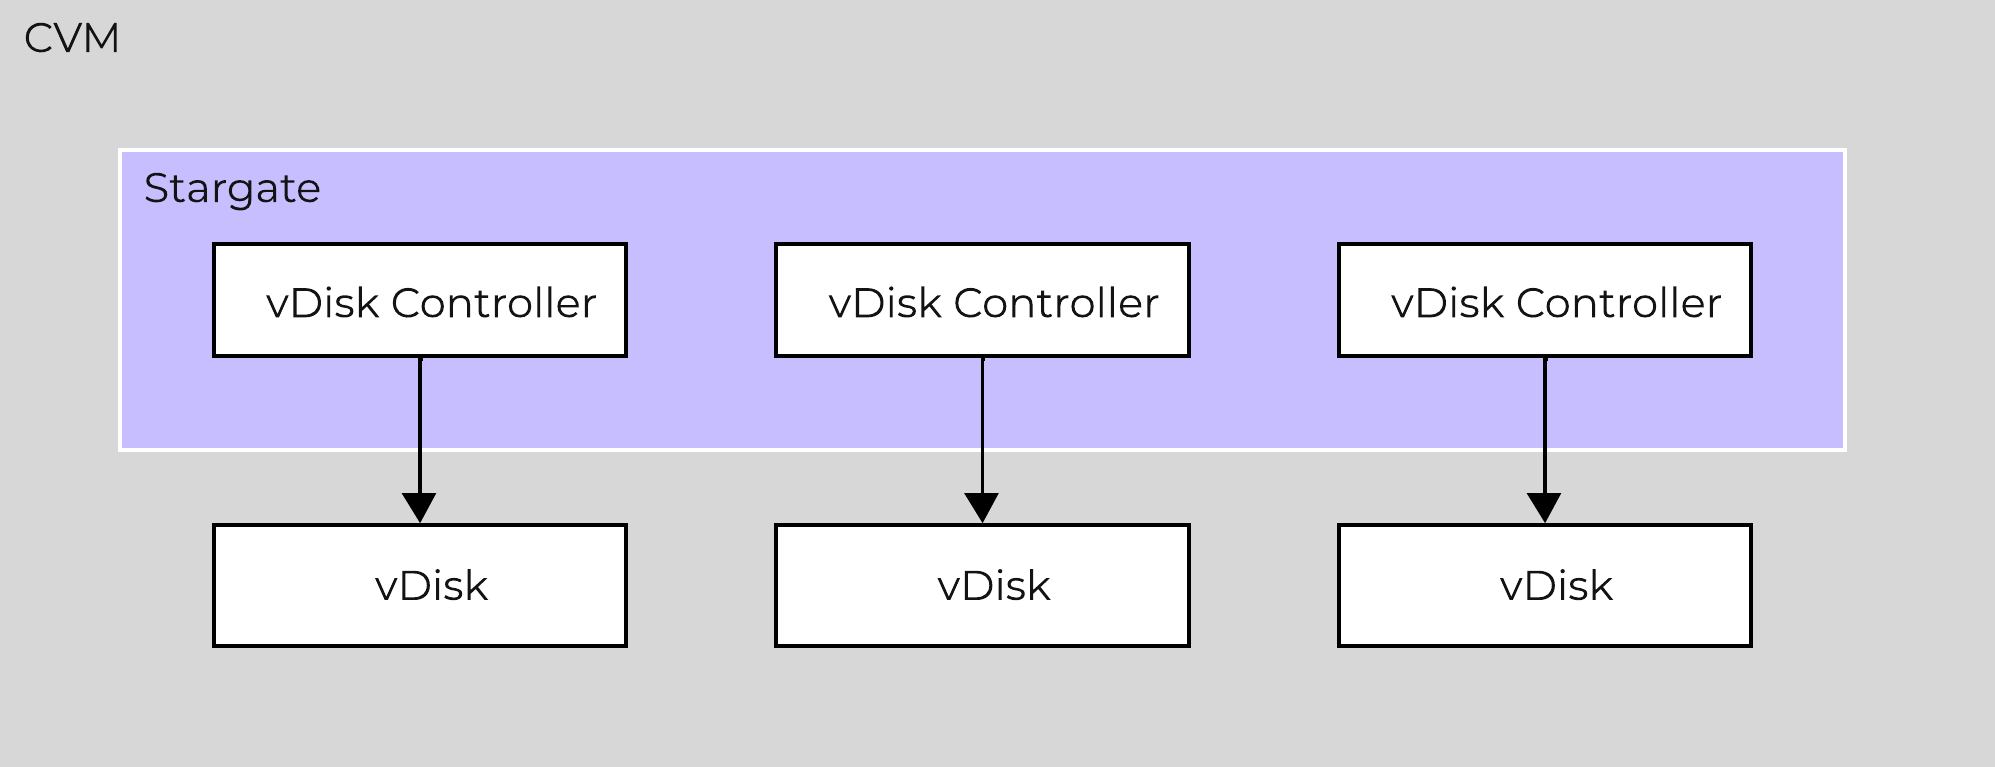
This architecture works well except in cases of traditional applications and workloads that had VMs with single large vdisk. These VMs were not able to leverage the capabilities of AOS to its fullest. So we enhanced our architecture such that the vdisk controller requests to a single vdisk are now distributed to multiple vdisk controllers. This is accomplished by creating shards of the controller, each having its own thread. I/O distribution to multiple controllers is done by a primary controller so for external interaction this still looks like a single vdisk. This results in effectively sharding the single vdisk making it multi-threaded. This enhancement alongwith other technologies talked above like Blockstore, AES allows AOS to deliver consistent high performance at scale even for traditional applications that use a single vdisk.
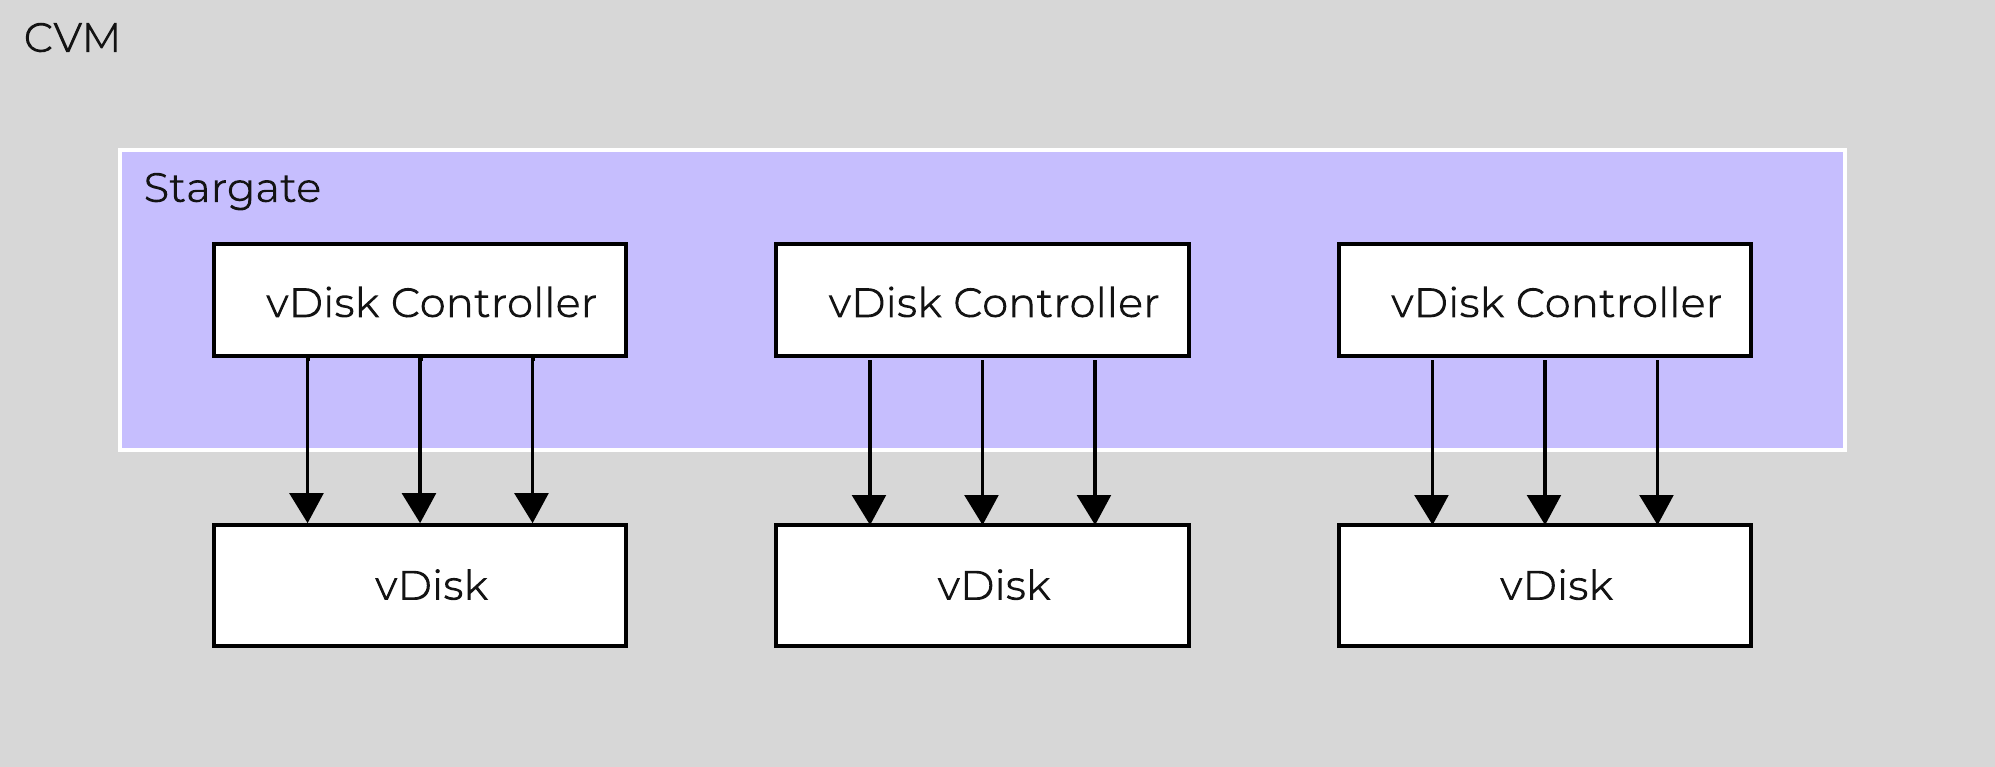
Scalable Metadata
For a visual explanation, you can watch the following YouTube video: Tech TopX by Nutanix University: Scalable Metadata
Metadata is at the core of any intelligent system and is even more critical for any filesystem or storage array. For those unsure about the term ‘metadata’; essentially metadata is ‘data about data’. In terms of AOS, there are a few key principles that are critical for its success:
- Must be right 100% of the time (known as “strictly consistent”)
- Must be ACID compliant
- Must have unlimited scalability
- Must not have any bottlenecks at any scale (must be linearly scalable)
As of AOS 5.10 metadata is broken into two areas: global vs. local metadata (prior all metadata was global). The motivation for this is to optimize for “metadata locality” and limit the network traffic on the system for metadata lookups.
The basis for this change is that not all data needs to be global. For example, every CVM doesn’t need to know which physical disk a particular extent sits on, they just need to know which node holds that data, and only that node needs to know which disk has the data.
By doing this we can limit the amount of metadata stored by the system (eliminate metadata RF for local only data), and optimize for “metadata locality.”
The following image shows the differentiation between global vs. local metadata:
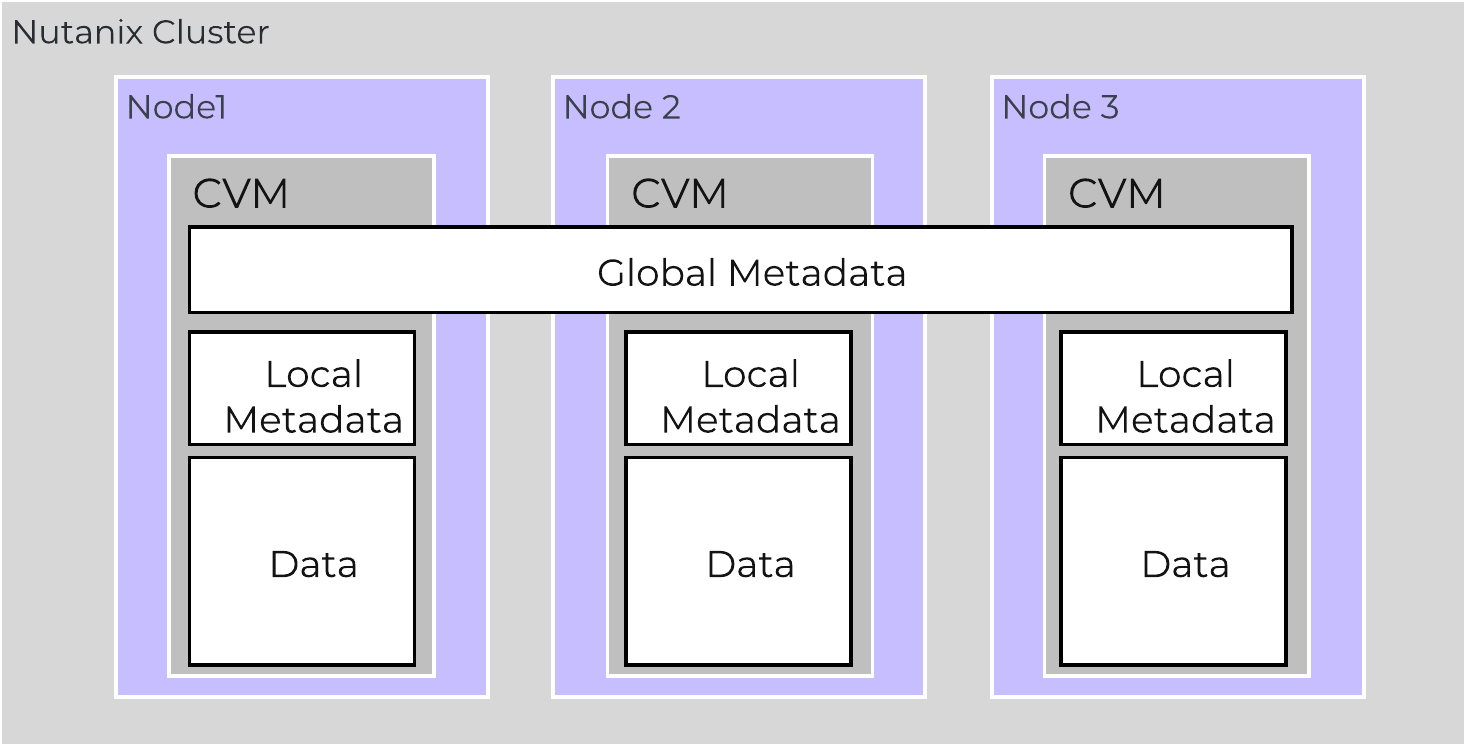 Global vs. Local Metadata
Local Metadata
- Description:
- Local metadata store per CVM containing information only needed by the local node. This is leveraged by the Autonomous Extent Store (AES) introduced in 5.10.
- Storage Mechanism:
- AES DB (based on Rocksdb)
- AES Optimized Metadata (based on B-Trees)
- Types of data stored:
- Physical extent / extent group placement (e.g. egroup to disk mappings), etc.
Global Metadata
- Description:
- Metadata that is globally available to any CVM and sharded across CVMs in the cluster. All metadata prior to 5.10.
- Storage Mechanism:
- Medusa Store (based on Cassandra)
- Types of data stored:
- vDisk block maps, extent to node mappings, time series stats, configurations, etc.
The section below covers how global metadata is managed:
As mentioned in the architecture section above, AOS utilizes a “ring-like” structure as a key-value store which stores essential global metadata as well as other platform data (e.g., stats, etc.). In order to ensure global metadata availability and redundancy a replication factor (RF) is utilized among an odd amount of nodes (e.g., 3, 5, etc.). Upon a global metadata write or update, the row is written to a node in the ring that owns that key and then replicated to n number of peers (where n is dependent on cluster size). A majority of nodes must agree before anything is committed, which is enforced using the Paxos algorithm. This ensures strict consistency for all data and global metadata stored as part of the platform.
The following figure shows an example of a global metadata insert/update for a 4 node cluster:
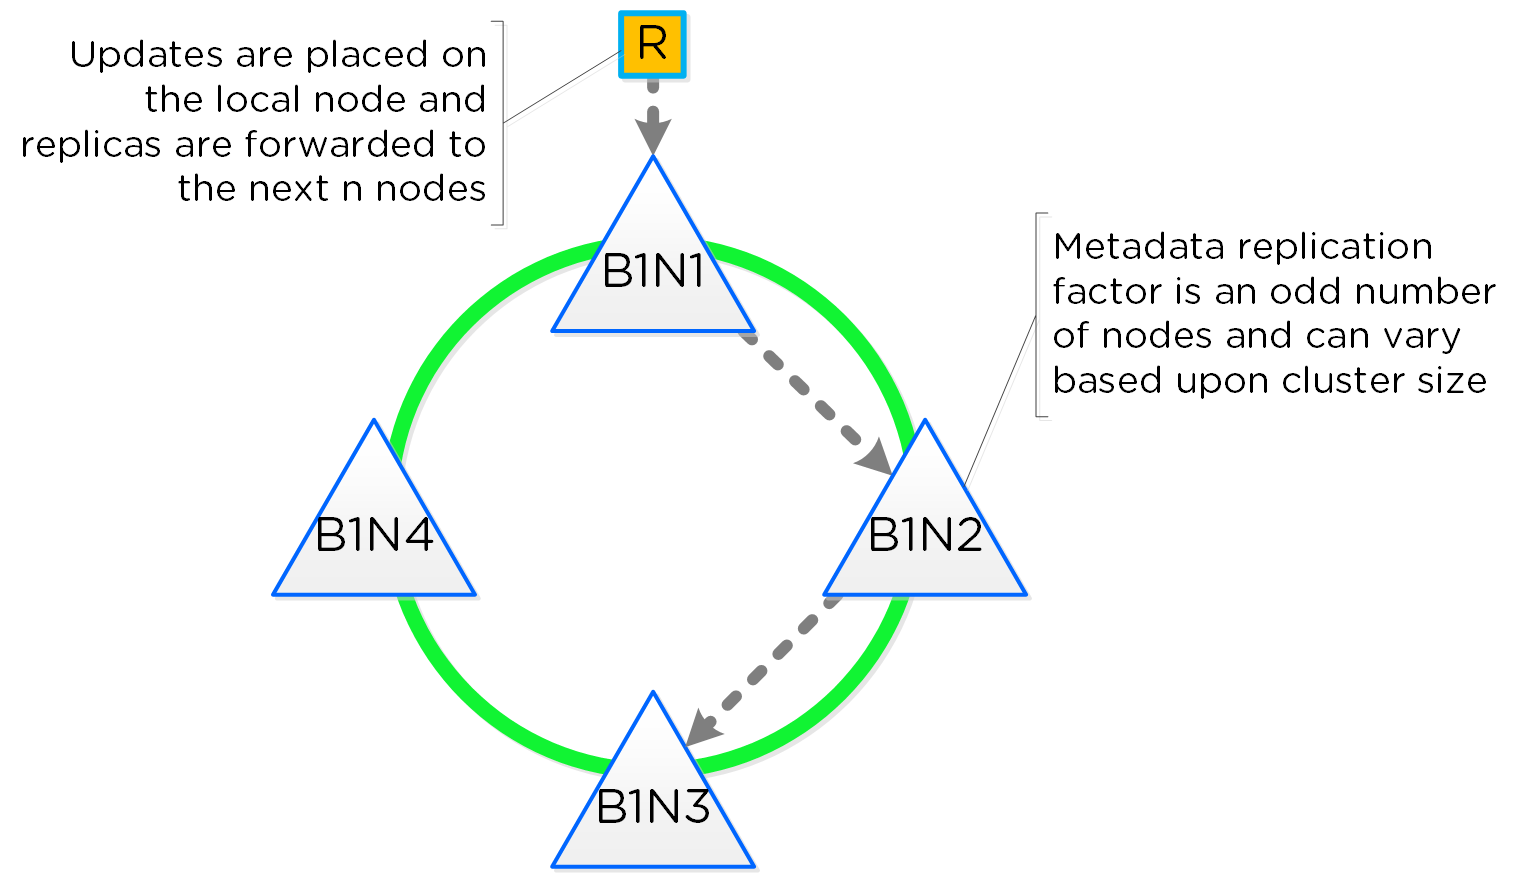 Cassandra Ring Structure
Performance at scale is also another important struct for AOS global metadata. Contrary to traditional dual-controller or “leader/worker” models, each Nutanix node is responsible for a subset of the overall platform’s metadata. This eliminates the traditional bottlenecks by allowing global metadata to be served and manipulated by all nodes in the cluster. A consistent hashing scheme is utilized for key partitioning to minimize the redistribution of keys during cluster size modifications (also known as “add/remove node”). When the cluster scales (e.g., from 4 to 8 nodes), the nodes are inserted throughout the ring between nodes for “block awareness” and reliability.
The following figure shows an example of the global metadata “ring” and how it scales:
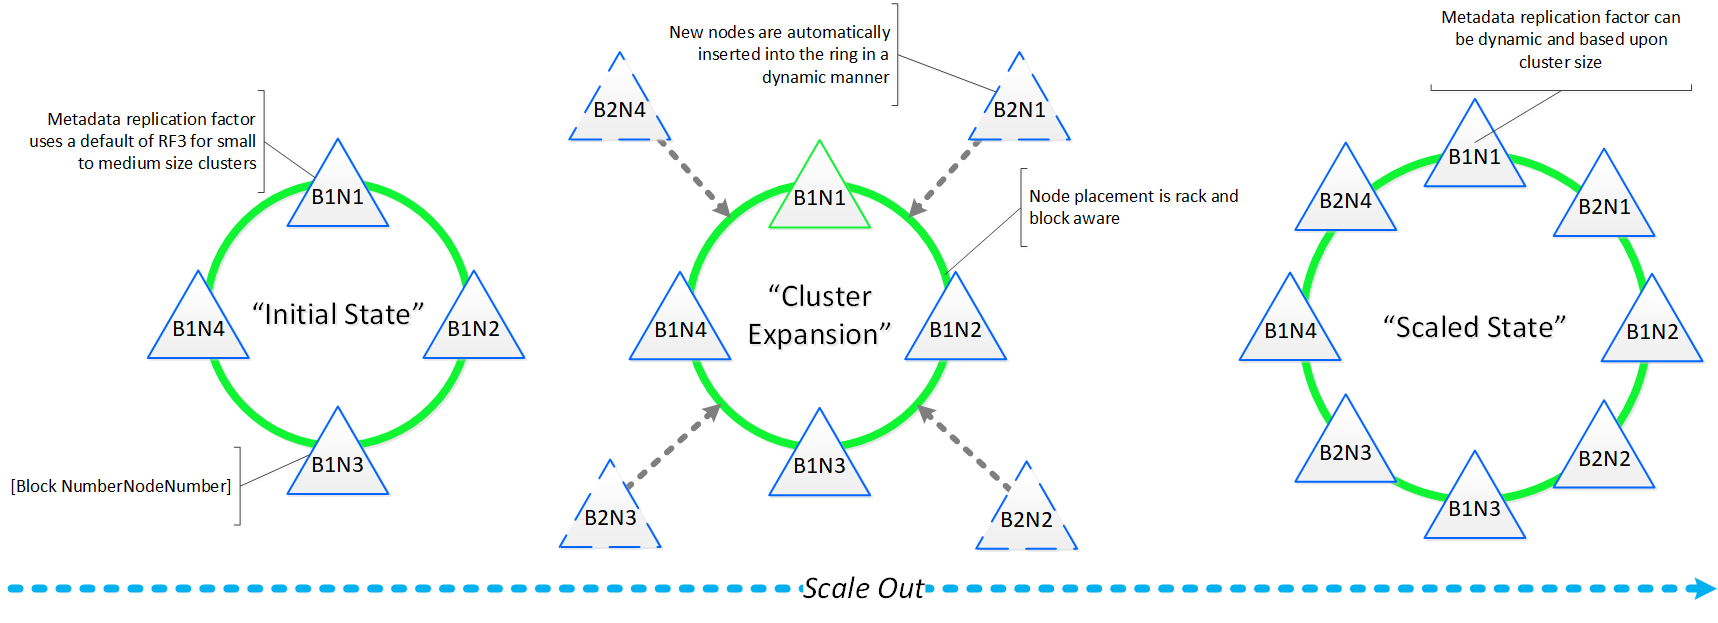 Cassandra Scale Out
» Download this section as PDF (opens in a new tab/window)
Capacity Optimization
The Nutanix platform incorporates a wide range of storage optimization technologies that work in concert to make efficient use of available capacity for any workload. These technologies are intelligent and adaptive to workload characteristics, eliminating the need for manual configuration and fine-tuning.
The following optimizations are leveraged:
- Erasure Coding (EC-X)
- Compression
- Deduplication
More detail on how each of these features can be found in the following sections.
The table describes which optimizations are applicable to workloads at a high-level:
| Data Transform | Best suited Application(s) | Comments |
|---|---|---|
| Erasure Coding (EC-X) | Most, Ideal for Nutanix Files/Objects | Provides higher availability with reduced overheads than traditional RF. No impact to normal write or read I/O performance. Does have some read overhead in the case of a disk / node / block failure where data must be decoded. Not suitable for workloads that are write or overwrite intensive, such as VDI |
| Inline Compression |
All | No impact to random I/O, helps increase storage tier utilization. Benefits large or sequential I/O performance by reducing data to replicate and read from disk. |
| Offline Compression |
None | Given inline compression will compress only large or sequential writes inline and do random or small I/Os post-process, that should be used instead. |
| Dedupe | Full Clones in VDI, Persistent Desktops, P2V/V2V, Hyper-V (ODX) | Greater overall efficiency for data which wasn't cloned or created using efficient AOS clones |
Erasure Coding
The Nutanix platform leverages a replication factor (RF) for data protection and availability. This method provides the highest degree of availability because it does not require reading from more than one storage location or data re-computation on failure. However, this does come at the cost of storage resources as full copies are required.
To provide a balance between availability while reducing the amount of storage required, AOS provides the ability to encode data using erasure codes (EC).
Similar to the concept of RAID (levels 4, 5, 6, etc.) where parity is calculated, EC encodes a strip of data blocks on different nodes and calculates parity. In the event of a host and/or disk failure, the parity can be leveraged to calculate any missing data blocks (decoding). In the case of AOS, the data block is an extent group. Based upon the read nature of the data (read cold vs. read hot), the system will determine placement of the blocks in the strip.
For data that is read cold, we will prefer to distribute the data blocks from the same vDisk across nodes to form the strip (same-vDisk strip). This simplifies garbage collection (GC) as the full strip can be removed in the event the vDisk is deleted. For read hot data we will prefer to keep the vDisk data blocks local to the node and compose the strip with data from different vDisks (cross-vDisk strip). This minimizes remote reads as the local vDisk’s data blocks can be local and other VMs/vDisks can compose the other data blocks in the strip. In the event a read cold strip becomes hot, AOS will try to recompute the strip and localize the data blocks.
The number of data and parity blocks in a strip is configurable based upon the desired failures to tolerate. The configuration is commonly referred to as the number of <number of data blocks>/<number of parity blocks>.
For example, “RF2 like” availability (N+1) could consist of 3 or 4 data blocks and 1 parity block in a strip (3/1 or 4/1). “RF3 like” availability (N+2) could consist of 3 or 4 data blocks and 2 parity blocks in a strip (3/2 or 4/2). The default strip sizes are 4/1 for RF2 like availability and 4/2 for RF3 like availability. These can be overriden using nCLI is desired.
ncli container [create/edit] ... erasure-code=<N>/<K>
where N is number of data blocks and K is number of parity blocks
Note
EC + Block Awareness
EC can place data and parity blocks in a block aware manner. If there are enough blocks (strip size (k+n) + 1) available in the cluster AOS will look to build block aware EC strips.
The expected overhead can be calculated as <# parity blocks> / <# data blocks>. For example, a 4/1 strip has a 25% overhead or 1.25X compared to the 2X of RF2. A 4/2 strip has a 50% overhead or 1.5X compared to the 3X of RF3.
The following table characterizes the encoded strip sizes and example overheads:
| FT1 (RF2 equiv.) | FT2 (RF3 equiv.) | |||
|---|---|---|---|---|
| Cluster Size (nodes) |
EC Strip Size (data/parity blocks) |
EC Overhead (vs. 2X of RF2) |
EC Strip Size (data/parity) |
EC Overhead (vs. 3X of RF3) |
| 4 | 2/1 | 1.5X | N/A | N/A |
| 5 | 3/1 | 1.33X | N/A | N/A |
| 6 | 4/1 | 1.25X | 2/2 | 2X |
| 7 | 4/1 | 1.25X | 3/2 | 1.6X |
| 8+ | 4/1 | 1.25X | 4/2 | 1.5X |
Note
Pro tip
It is always recommended to have a cluster size which has at least 1 more node (or block for block aware data / parity placement) than the combined strip size (data + parity) to allow for rebuilding of the strips in the event of a node or block failure. This eliminates any computation overhead on reads once the strips have been rebuilt (automated via Curator). For example, a 4/1 strip should have at least 6 nodes in the cluster for a node aware EC strip or 6 blocks for a block aware EC strip. The previous table follows this best practice.
The encoding is done post-process and leverages the Curator MapReduce framework for task distribution. Since this is a post-process framework, the traditional write I/O path is unaffected.
A normal environment using RF would look like the following:
 Typical AOS RF Data Layout
In this scenario, we have RF2 data whose primary copies are local and replicas are distributed to other nodes throughout the cluster.
When a Curator full scan runs, it will find eligible extent groups which are available to become encoded. Eligible extent groups must be “write-cold” meaning they haven’t been written to for awhile. This is controlled with the following Curator Gflag: curator_erasure_code_threshold_seconds. After the eligible candidates are found, the encoding tasks will be distributed and throttled via Chronos.
The following figure shows an example 3/1 strip:
 AOS Encoded Strip - Pre-savings
Once the data has been successfully encoded (strips and parity calculation), the replica extent groups are then removed.
The following figure shows the environment after EC has run with the storage savings:
 AOS Encoded Strip - Post-savings
Nutanix also supports inline erasure coding, which can be enabled on containers using nCLI. Inline erasure coding encodes and creates coding strips inline by erasure coding the data without waiting for it to become write-cold. In inline erasure coding, the erasure coded strips are created on the same vDisk data by default. There is also an option to create strips from cross vdisks, preserving data locality if that is desired. Inline erasure coding is only recommended for workloads that do not require data locality or do not perform numerous overwrites. For example, Nutanix Objects is a workload typically well suited for inline erasure coding and has inline EC-X turned on by default. Because the Objects architecture treats overwrites as new writes, it aligns naturally with inline erasure coding data at ingest.
Note that when inline erasure coding is enabled, a post-process policy is available as a fallback. This provides optionality so that if the data ingest or frontend data operations are too high, it can fall back to post-process.
Note
EC and Nutanix Unified Storage
Nutanix is a platform of enterprise services, one such service is Nutanix Unified Storage (NUS) supporting our File and Object services. Starting in AOS 7.3 and later to support the growing storage demands of File and Object deployments on Nutanix, erasure coding can now support up to 12/2 strip sizes. This is only available on dedicated clusters running NUS. Increasing the strip width allows the platform to store a greater ratio of data to parity blocks, improving efficiency and enabling more optimal distribution across a larger number of nodes. This increased strip width also results in better capacity utilization, especially in clusters with high density requirements, such as file and object clusters.
Note
Pro tip
Erasure Coding pairs perfectly with inline compression which will add to the storage savings.
Compression
For a visual explanation, you can watch the following video: LINK
The Nutanix Capacity Optimization Engine (COE) is responsible for performing data transformations to increase data efficiency on disk. Currently compression is one of the key features of the COE to perform data optimization. AOS provides both inline and post-process compression to best suit the customer’s needs and type of data. Inline compression is enabled by default when a storage container is created.
Inline compression will compress sequential streams of data or large I/O sizes (>64K) when written to the Extent Store (SSD + HDD). This includes data draining from OpLog as well as sequential data skipping it.
Note
OpLog Compression
The OpLog will compress all incoming writes >4K that show good compression (Gflag: vdisk_distributed_oplog_enable_compression). This will allow for a more efficient utilization of the OpLog capacity and help drive sustained performance.
When drained from OpLog to the Extent Store the data will be decompressed, aligned and then re-compressed at a 32K aligned unit size.
This feature is on by default and no user configuration is necessary.
Offline compression will initially write the data as normal (in an un-compressed state) and then leverage the Curator framework to compress the data cluster wide. When inline compression is enabled but the I/Os are random in nature, the data will be written un-compressed in the OpLog, coalesced, and then compressed in memory before being written to the Extent Store.
Nutanix leverages LZ4 and LZ4HC for data compression. Normal data will be compressed using LZ4, which provides a very good blend between compression and performance. For cold data, LZ4HC will be leveraged to provide an improved compression ratio.
Cold data is characterized into two main categories:
- Regular data: No R/W access for 3 days (Gflag: curator_medium_compress_mutable_data_delay_secs)
- Immutable data (snapshots): No R/W access for 1 day (Gflag: curator_medium_compress_immutable_data_delay_secs)
The following figure shows an example of how inline compression interacts with the AOS write I/O path:
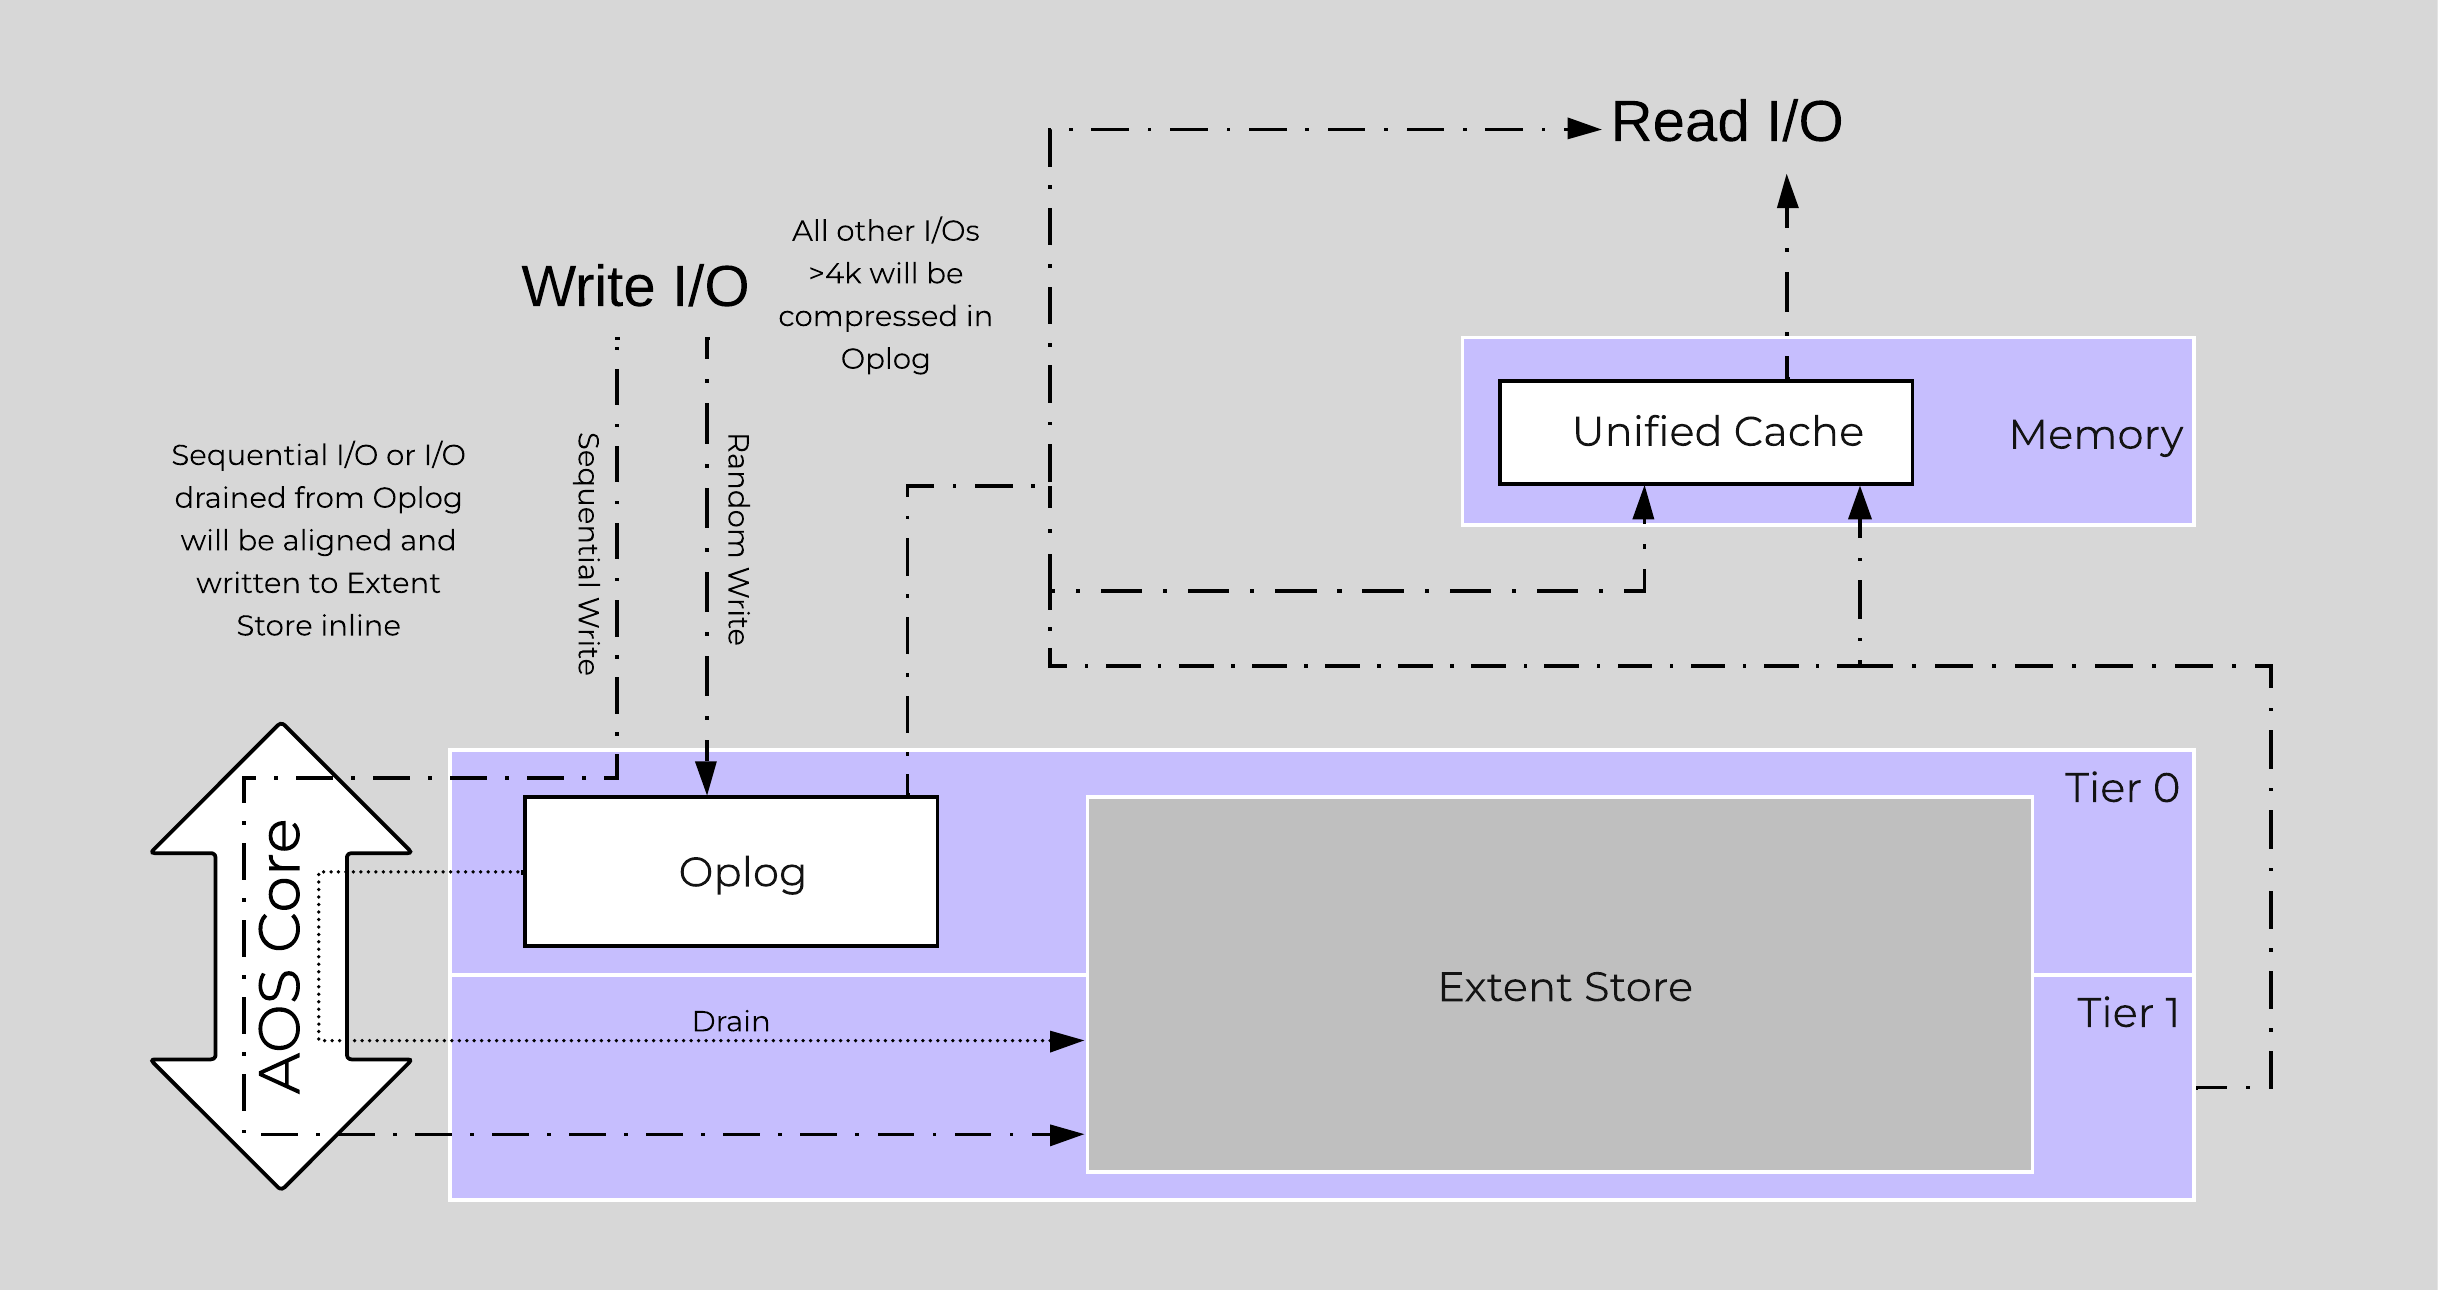 Inline Compression I/O Path
Note
Pro tip
Almost always use inline compression (compression delay = 0) as it will only compress larger / sequential writes and not impact random write performance.
This will also increase the usable size of the SSD tier increasing effective performance and allowing more data to sit in the SSD tier. Also, for larger or sequential data that is written and compressed inline, the replication for RF will be shipping the compressed data, further increasing performance since it is sending less data across the wire.
Inline compression also pairs perfectly with erasure coding.
For offline compression, all new write I/O is written in an un-compressed state and follows the normal AOS I/O path. After the compression delay (configurable) is met, the data is eligible to become compressed. Compression can occur anywhere in the Extent Store. Offline compression uses the Curator MapReduce framework and all nodes will perform compression tasks. Compression tasks will be throttled by Chronos.
The following figure shows an example of how offline compression interacts with the AOS write I/O path:
 Offline Compression I/O Path
For read I/O, the data is first decompressed in memory and then the I/O is served.
You can view the current compression rates via Prism on the Storage > Dashboard page.
Elastic Dedupe Engine
For a visual explanation, you can watch the following video: LINK
The Elastic Dedupe Engine is a software-based feature of AOS which allows for data deduplication in the capacity (Extent Store) tiers. Streams of data are fingerprinted during ingest at a 16KB granularity (Controlled by: stargate_dedup_fingerprint) within a 1MB extent. Prior to AOS 5.11, AOS used only SHA-1 hash to fingerprint and identify candidates for dedupe. AOS now uses logical checksums to select candidates for dedupe. This fingerprint is only done on data ingest and is then stored persistently as part of the written block’s metadata.
Contrary to traditional approaches which utilize background scans requiring the data to be re-read, Nutanix performs the fingerprint inline on ingest. For duplicate data that can be deduplicated in the capacity tier, the data does not need to be scanned or re-read, essentially duplicate copies can be removed.
To make the metadata overhead more efficient, fingerprint refcounts are monitored to track dedupability. Fingerprints with low refcounts will be discarded to minimize the metadata overhead. To minimize fragmentation full extents will be preferred for deduplication.
Note
Pro tip
Use deduplication on your base images (you can manually fingerprint them using vdisk_manipulator) to take advantage of the unified cache.
Fingerprinting is done during data ingest of data with an I/O size of 64K or greater (initial I/O or when draining from OpLog). AOS then looks at hashes/fingerprints of each 16KB chunk within a 1MB extent and if it finds duplicates for more than 40% of chunks, it dedupes the entire extent. That resulted in many dedupe extents with reference count of 1 (no other duplicates) within the 1MB extent from the remaining 60% of extent, that ended up using metadata.
With AOS 6.6, the algorithm was further enhanced such that within a 1MB extent, only chunks that have duplicates will be marked for deduplication instead of entire extent reducing the metadata required. With AOS 6.6, changes were also made with the way dedupe metadata was stored. Before AOS 6.6, dedupe metadata was stored in a top level vdisk block map which resulted in dedupe metadata to be copied when snapshots were taken. This resulted in a metadata bloat. With AOS 6.6, that metadata is now stored in extent group id map which is a level lower than vdisk block map. Now when snapshots are taken of the vdisk, it does not result in copying of dedupe metadata and prevents metadata bloat. Once the fingerprintng is done, a background process will remove the duplicate data using the AOS MapReduce framework (Curator). For data that is being read, the data will be pulled into the AOS Unified Cache which is a multi-tier/pool cache. Any subsequent requests for data having the same fingerprint will be pulled directly from the cache. To learn more about the Unified Cache and pool structure, please refer to the Unified Cache sub-section in the I/O path overview.
The following figure shows an example of how the Elastic Dedupe Engine interacts with the AOS I/O path:
 EDE I/O Path
You can view the current deduplication rates via Prism on the Storage > Dashboard page.
» Download this section as PDF (opens in a new tab/window)
Data Protection
For a visual explanation, you can watch the following video: LINK
The Nutanix platform currently uses a resiliency factor, also known as a replication factor (RF), and checksum to ensure data redundancy and availability in the case of a node or disk failure or corruption. As explained above, the OpLog acts as a staging area to absorb incoming writes onto a low-latency SSD tier. Upon being written to the local OpLog, the data is synchronously replicated to another one or two Nutanix CVM’s OpLog (dependent on RF) before being acknowledged (Ack) as a successful write to the host. This ensures that the data exists in at least two or three independent locations and is fault tolerant. NOTE: For RF3, a minimum of 5 nodes is required since metadata will be RF5.
OpLog peers are chosen for every episode (1GB of vDisk data) and all nodes actively participate. Multiple factors play into which peers are chosen (e.g. response time, business, capacity utilization, etc). This eliminates any fragmentation and ensures every CVM/OpLog can be used concurrently.
Data RF is configured via Prism and is done at the container level. All nodes participate in OpLog replication to eliminate any “hot nodes”, ensuring linear performance at scale. While the data is being written, a checksum is computed and stored as part of its metadata. Data is then asynchronously drained to the extent store where the RF is implicitly maintained. In the case of a node or disk failure, the data is then re-replicated among all nodes in the cluster to maintain the RF. Any time the data is read, the checksum is computed to ensure the data is valid. In the event where the checksum and data don’t match, the replica of the data will be read and will replace the non-valid copy.
Data is also consistently monitored to ensure integrity even when active I/O isn’t occurring. Stargate’s scrubber operation will consistently scan through extent groups and perform checksum validation when disks aren’t heavily utilized. This protects against things like bit rot or corrupted sectors.
The following figure shows an example of what this logically looks like:
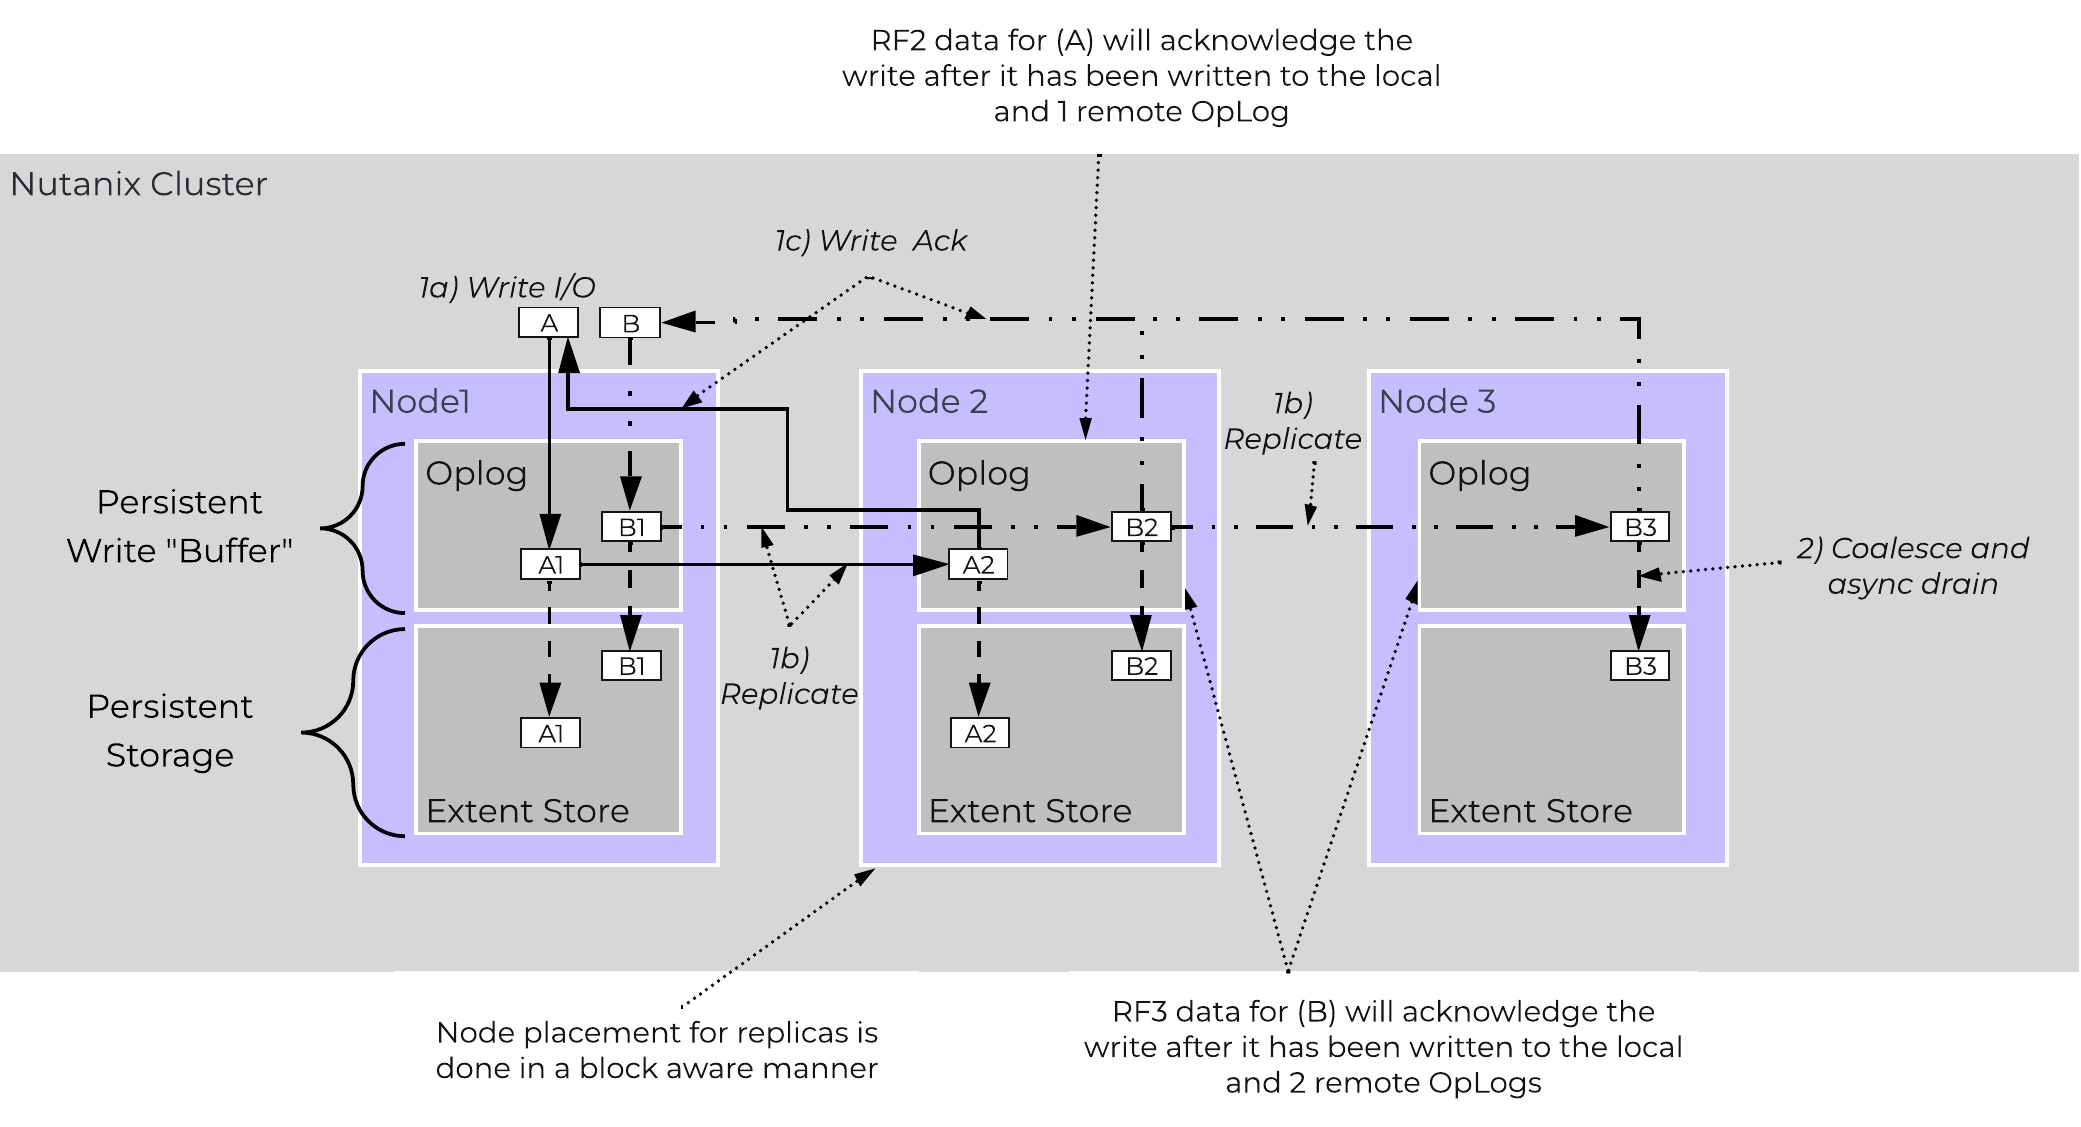 AOS Data Protection
Availability Domains
For a visual explanation, you can watch the following video: LINK
Availability Domains (aka node/block/rack awareness) is a key struct for distributed systems to abide by for determining component and data placement. Nutanix refers to a “block” as the chassis which contains either one, two, or four server “nodes” and a “rack” as a physical unit containing one or more “block”. NOTE: A minimum of 3 blocks must be utilized for block awareness to be activated, otherwise node awareness will be used.
Nutanix currently supports the following levels or awareness:
- Disk (always)
- Node (always)
- Block
- Rack
It is recommended to utilize uniformly populated blocks / racks to ensure the awareness is enabled and no imbalance is possible. Common scenarios and the awareness level utilized can be found at the bottom of this section. The 3-block requirement is due to ensure quorum. For example, a 3450 would be a block which holds 4 nodes. The reason for distributing roles or data across blocks is to ensure if a block fails or needs maintenance the system can continue to run without interruption. NOTE: Within a block, the redundant PSU and fans are the only shared components.
NOTE: Rack awareness requires the administrator to define “racks” in which the blocks are placed.
The following shows how this is configured in Prism:
 Rack Configuration
Awareness can be broken into a few key focus areas:
- Data (The VM data)
- Metadata (Cassandra)
- Configuration Data (Zookeeper)
Data
With AOS, data replicas will be written to other [blocks/racks] in the cluster to ensure that in the case of a [block/rack] failure or planned downtime, the data remains available. This is true for both RF2 and RF3 scenarios, as well as in the case of a [block/rack] failure. An easy comparison would be “node awareness”, where a replica would need to be replicated to another node which will provide protection in the case of a node failure. Block and rack awareness further enhances this by providing data availability assurances in the case of [block/rack] outages.
The following figure shows how the replica placement would work in a 3-block deployment:
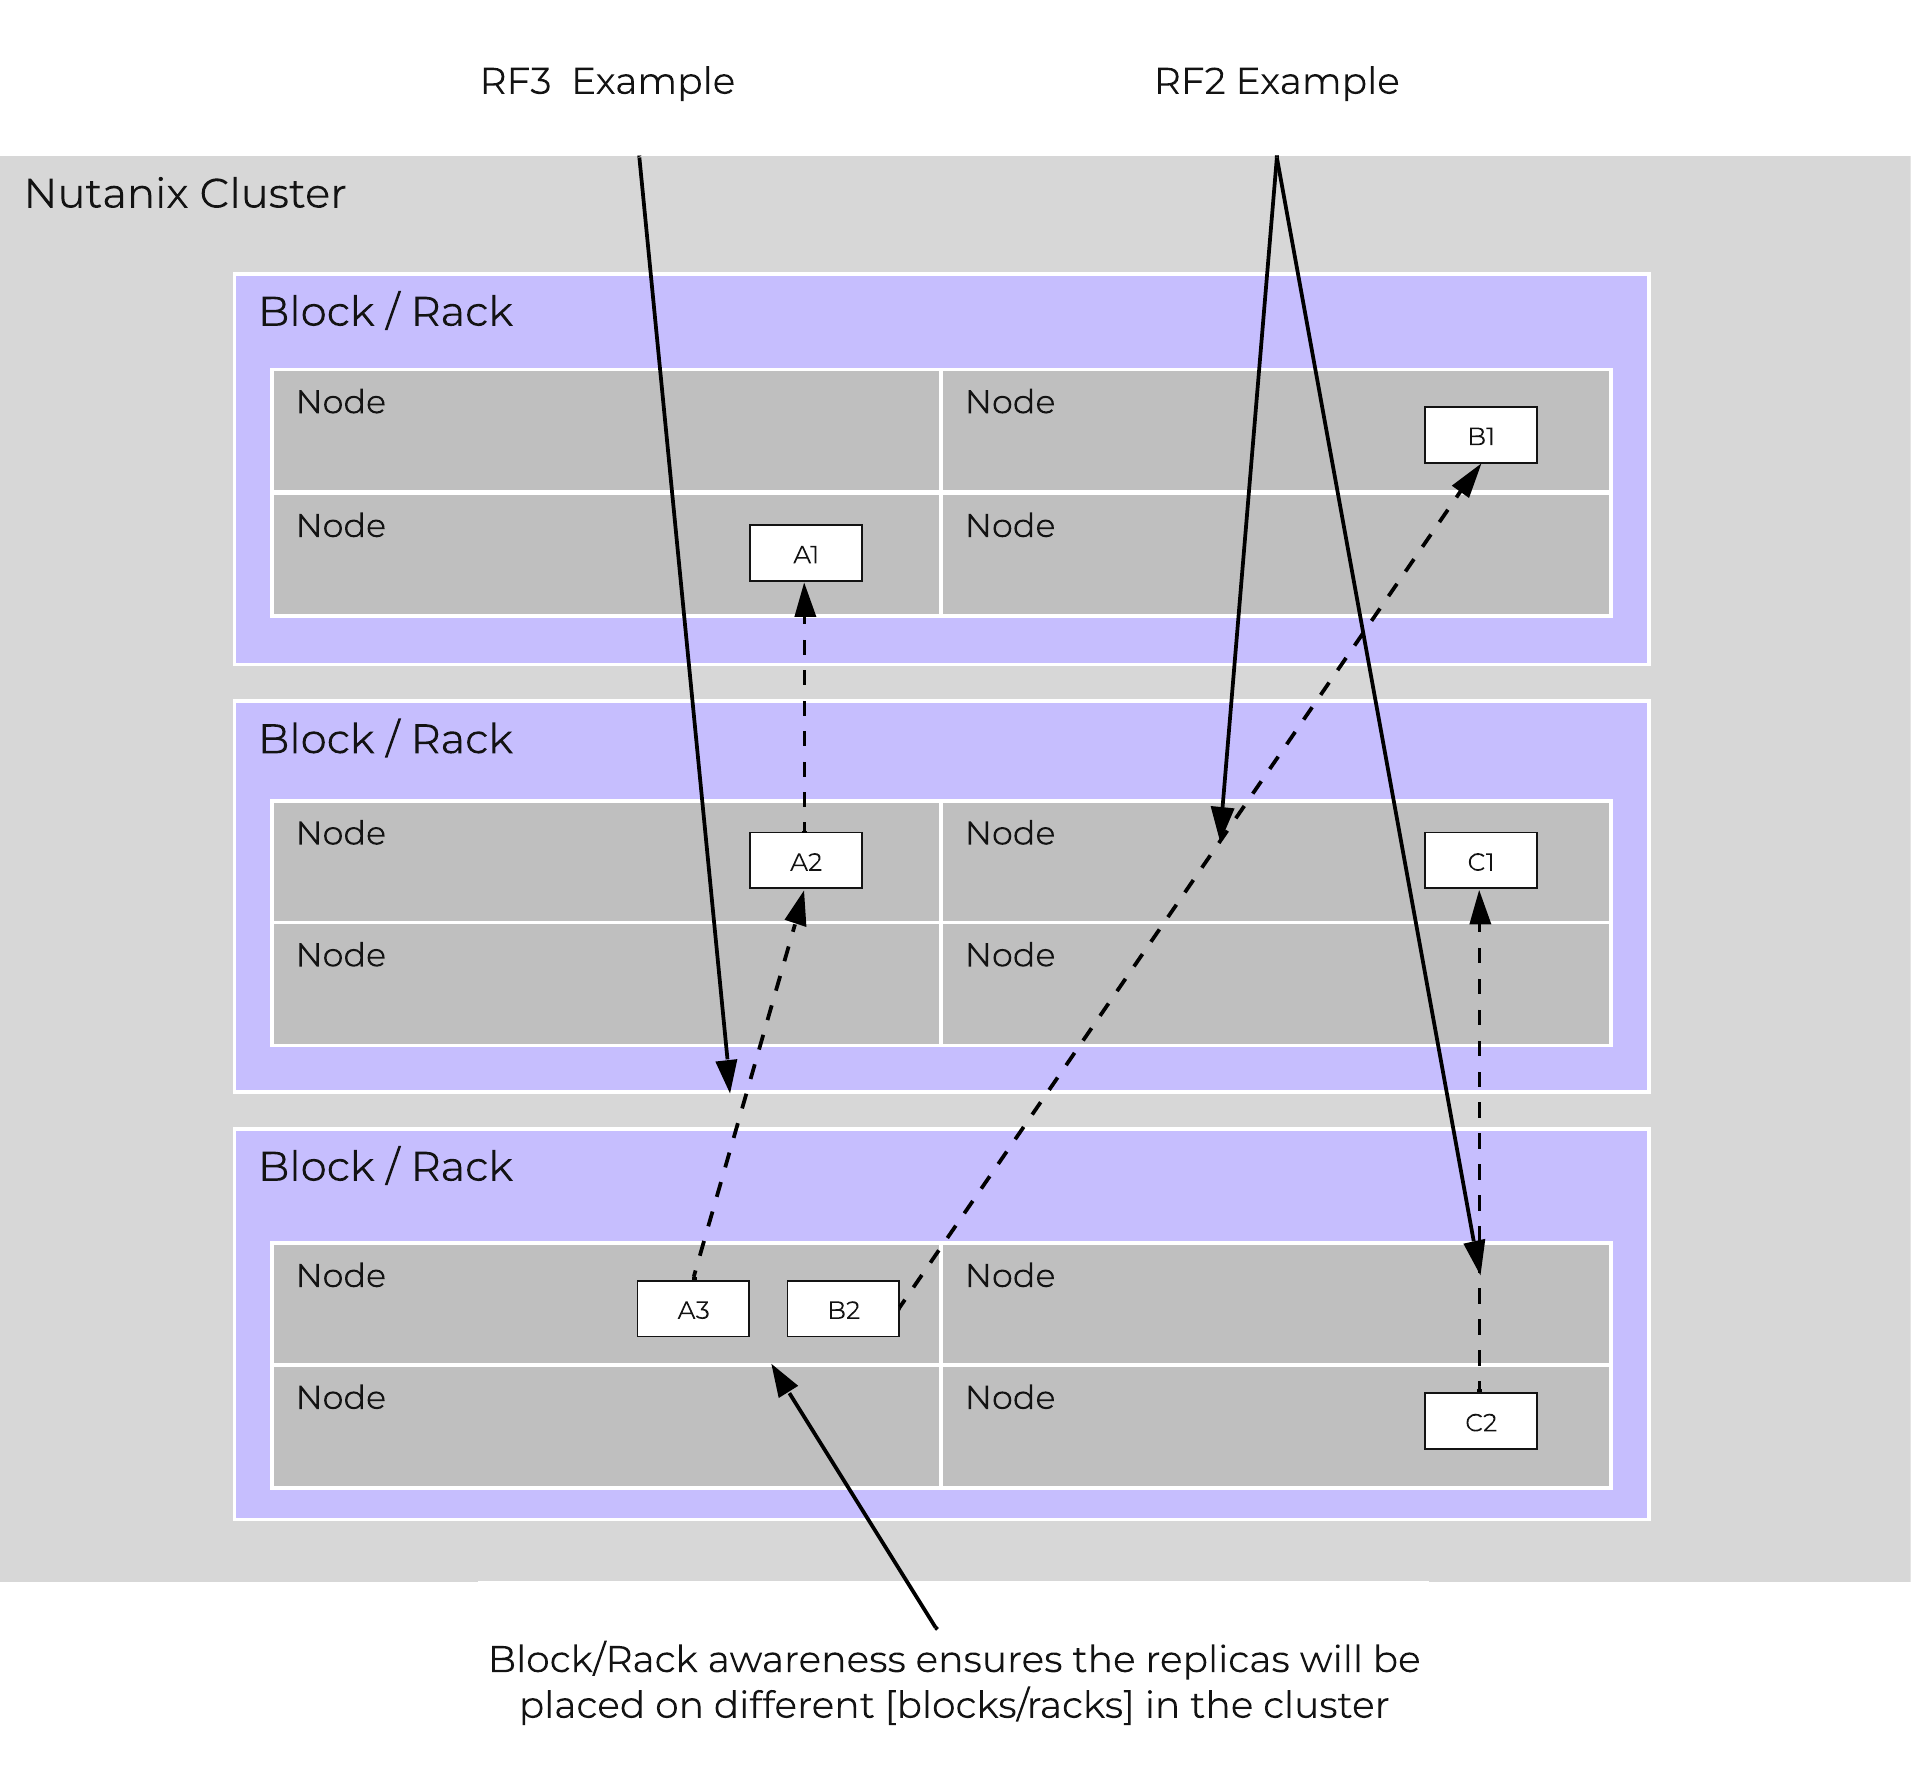 Block/Rack Aware Replica Placement
In the case of a [block/rack] failure, [block/rack] awareness will be maintained (if possible) and the data will be replicated to other [blocks/racks] within the cluster:
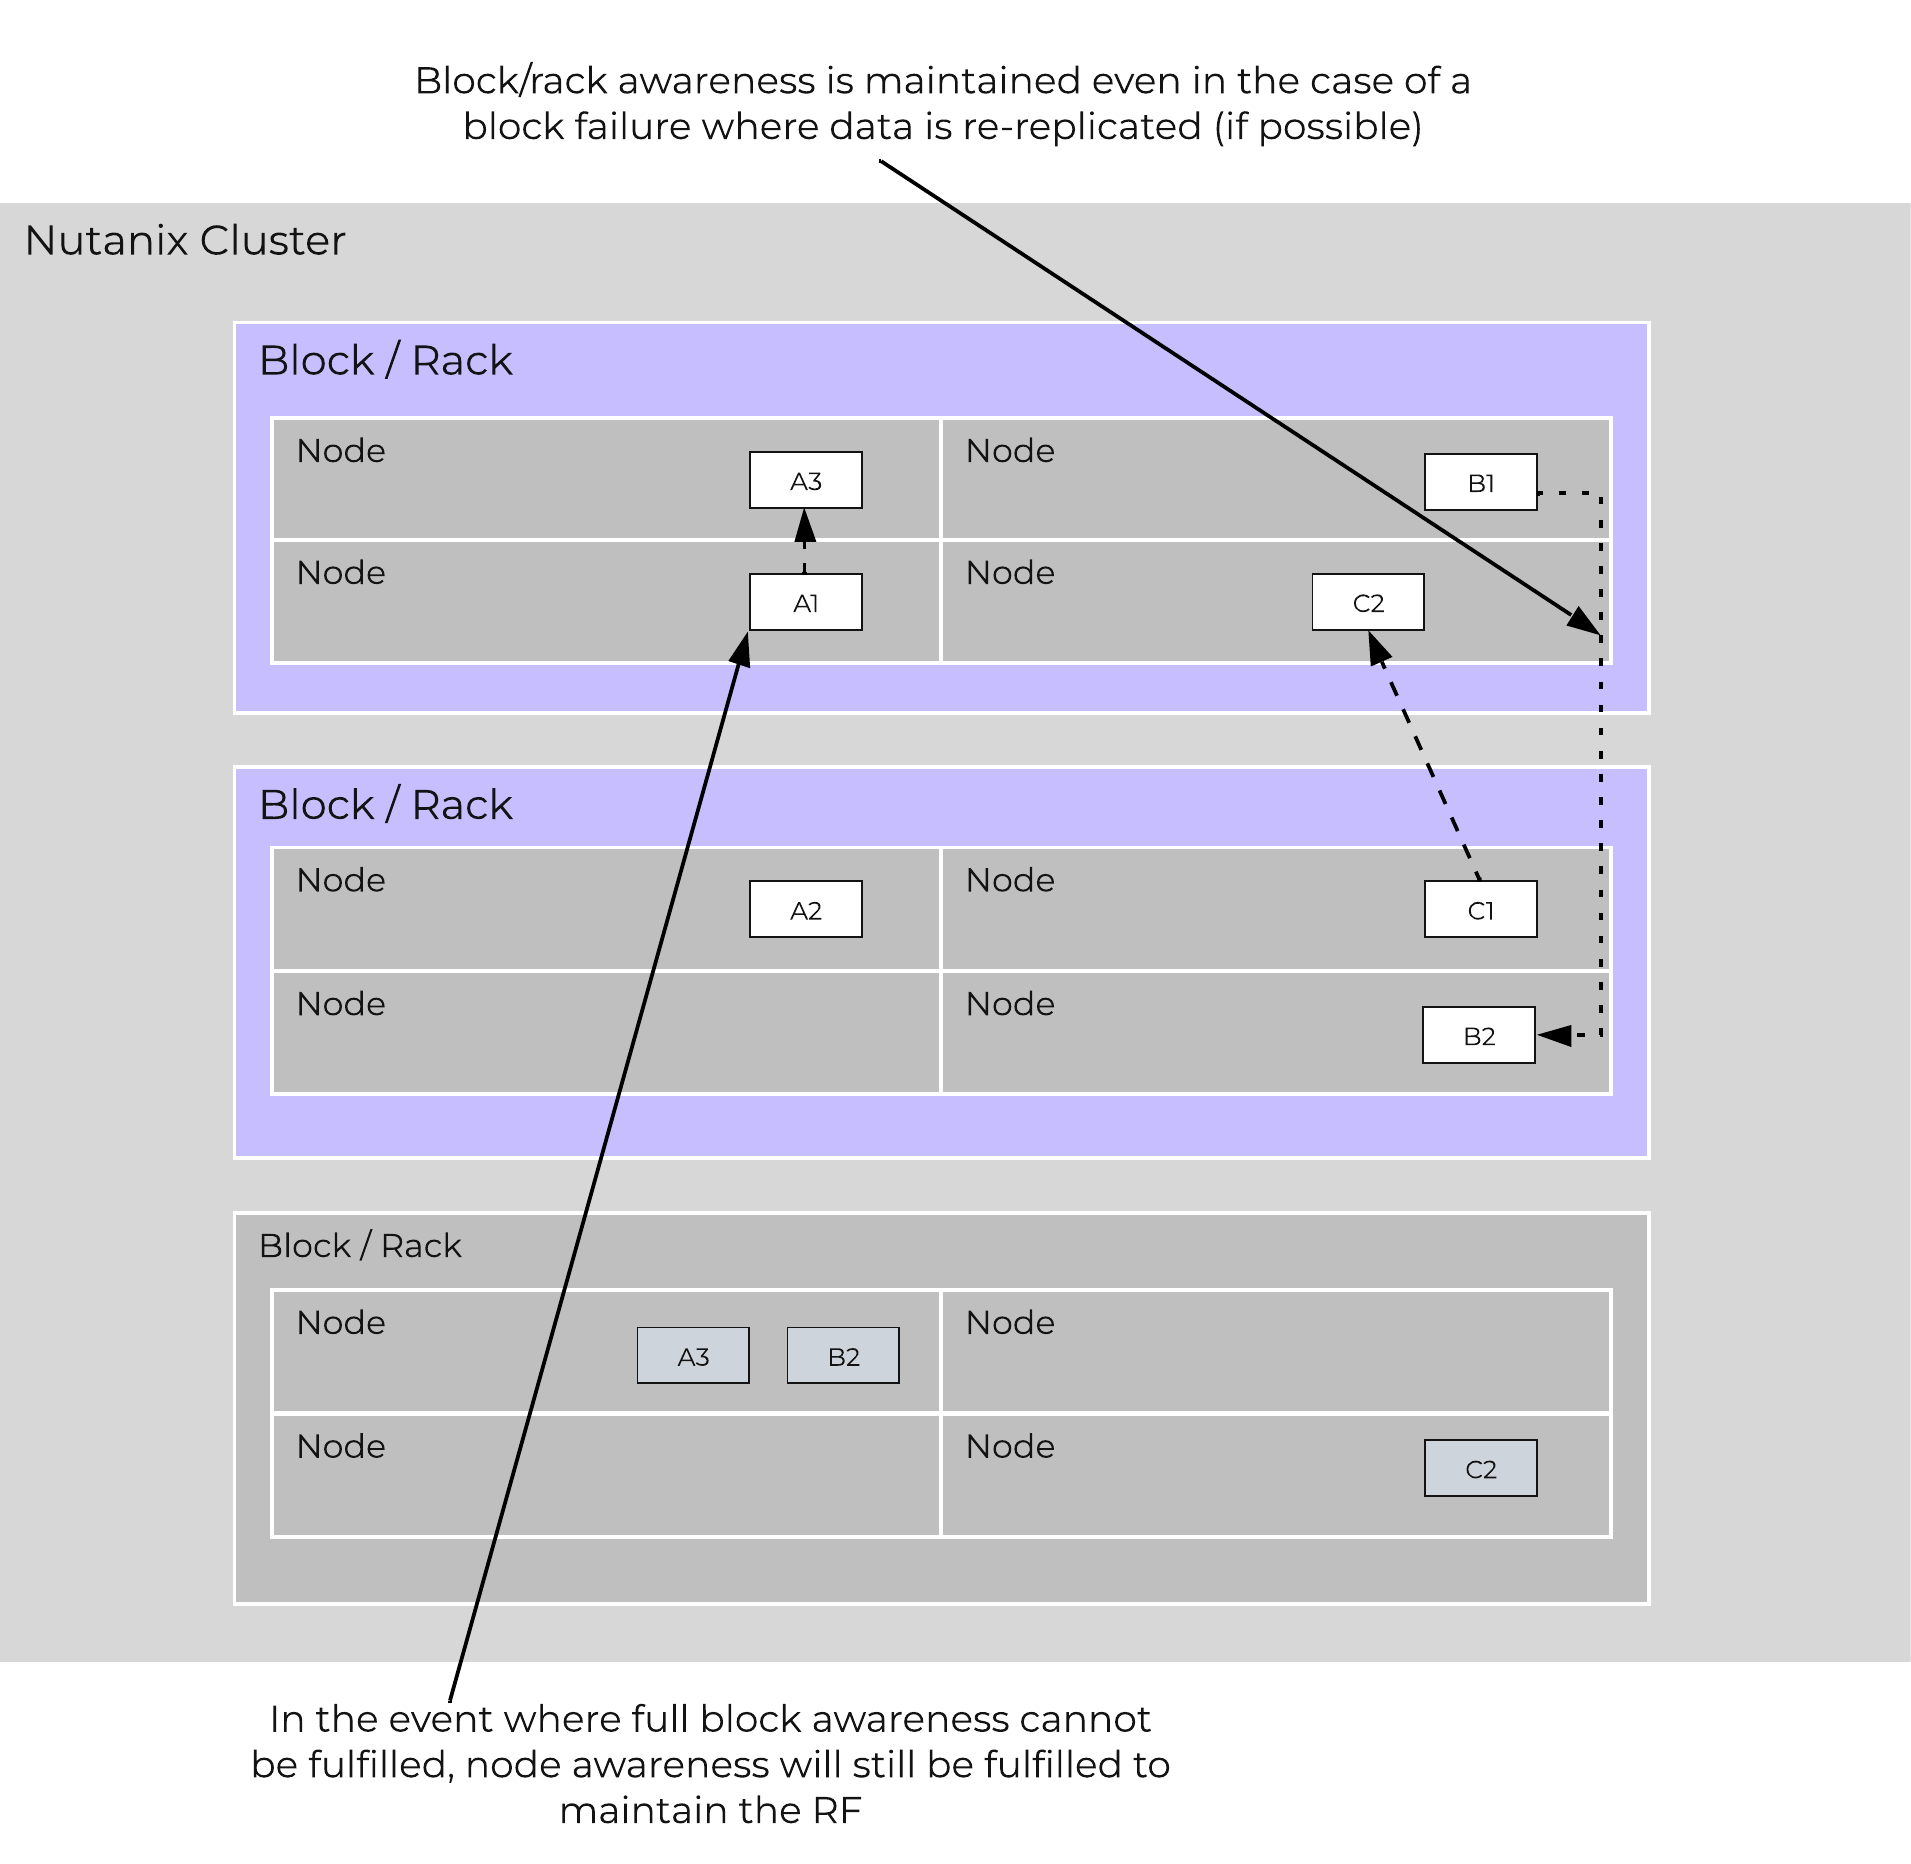 Block/Rack Failure Replica Placement
Note
Rack/Block Awareness vs. Metro clustering
A common question is can you span a cluster across two locations (rooms, buildings, etc.) and use block / rack awareness to provide resiliency around a location failure.
While theoretically possible this is not the recommended approach. Let's first think about what we're trying to achieve with this:
- Low RPO
- Low RTO (HA event instead of a DR event)
If we take the first case where we're trying to achieve an RPO ~0, it is preferred to leverage synchronous or near-synchronous replication. This will provide the same RPOs with less risk.
To minimize the RTO one can leverage a metro-cluster on top of synchronous replication and handle any failures as HA events instead of doing DR recoveries.
In summary it is preferred to leverage synchronous replication / metro clustering for the following reasons:
- The same end result can be achieved with sync rep / metro clustering, avoiding any risks and keeping isolated fault domains
- If network connectivity goes down between the two locations in a non-supported "stretched" deployment, one side will go down as quorum must be maintained (e.g. majority side will stay up). In the metro cluster scenario, both sides can continue to operate independently.
- Availability domain placement of data is best effort in skewed scenarios
- Additional Latency / reduced network bandwidth between both sites can impact performance in the "stretched" deployment
Awareness Conditions and Tolerance
Below we breakdown some common scenarios and the level of tolerance:
| Desired Awareness Type | FT Level | EC Enabled? | Min. Units | Simultaneous failure tolerance |
|---|---|---|---|---|
| Node | 1 | No | 3 Nodes | 1 Node |
| Node | 1 | Yes | 4 Nodes | 1 Node |
| Node | 2 | No | 5 Nodes | 2 Node |
| Node | 2 | Yes | 6 Nodes | 2 Nodes |
| Block | 1 | No | 3 Blocks | 1 Block |
| Block | 1 | Yes | 4 Blocks | 1 Block |
| Block | 2 | No | 5 Blocks | 2 Blocks |
| Block | 2 | Yes | 6 Blocks | 2 Blocks |
| Rack | 1 | No | 3 Racks | 1 Rack |
| Rack | 1 | Yes | 4 Racks | 1 Rack |
| Rack | 2 | No | 5 Racks | 2 Racks |
| Rack | 2 | Yes | 6 Racks | 2 Racks |
Block awareness operates on an opt-in (setting specifically in the Prism UI) or best-effort basis. For best-effort, when certain conditions are met (eg: minimum storage tiers per block, container replication factor setting, minimum number of blocks, free space in the storage tiers), then it will be enabled automatically. It is considered best practice to have uniform blocks to minimize any storage skew.
Metadata
As mentioned in the Scalable Metadata section above, Nutanix leverages a heavily modified Cassandra platform to store metadata and other essential information. Cassandra leverages a ring-like structure and replicates to n number of peers within the ring to ensure data consistency and availability.
The following figure shows an example of the Cassandra’s ring for a 12-node cluster:
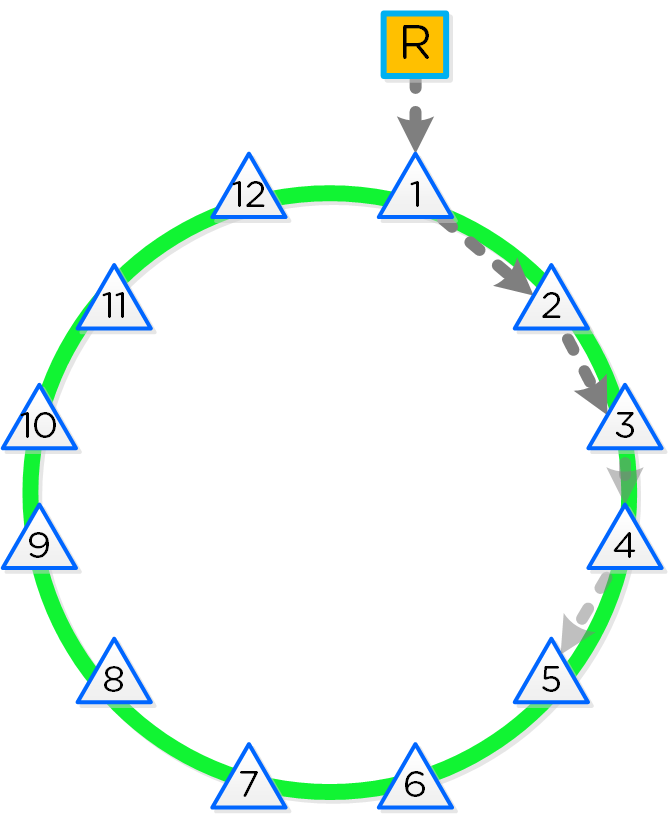 12 Node Cassandra Ring
Cassandra peer replication iterates through nodes in a clockwise manner throughout the ring. With [block/rack] awareness, the peers are distributed among the [blocks/racks] to ensure no two peers are on the same [block/rack].
The following figure shows an example node layout translating the ring above into the [block/rack] based layout:
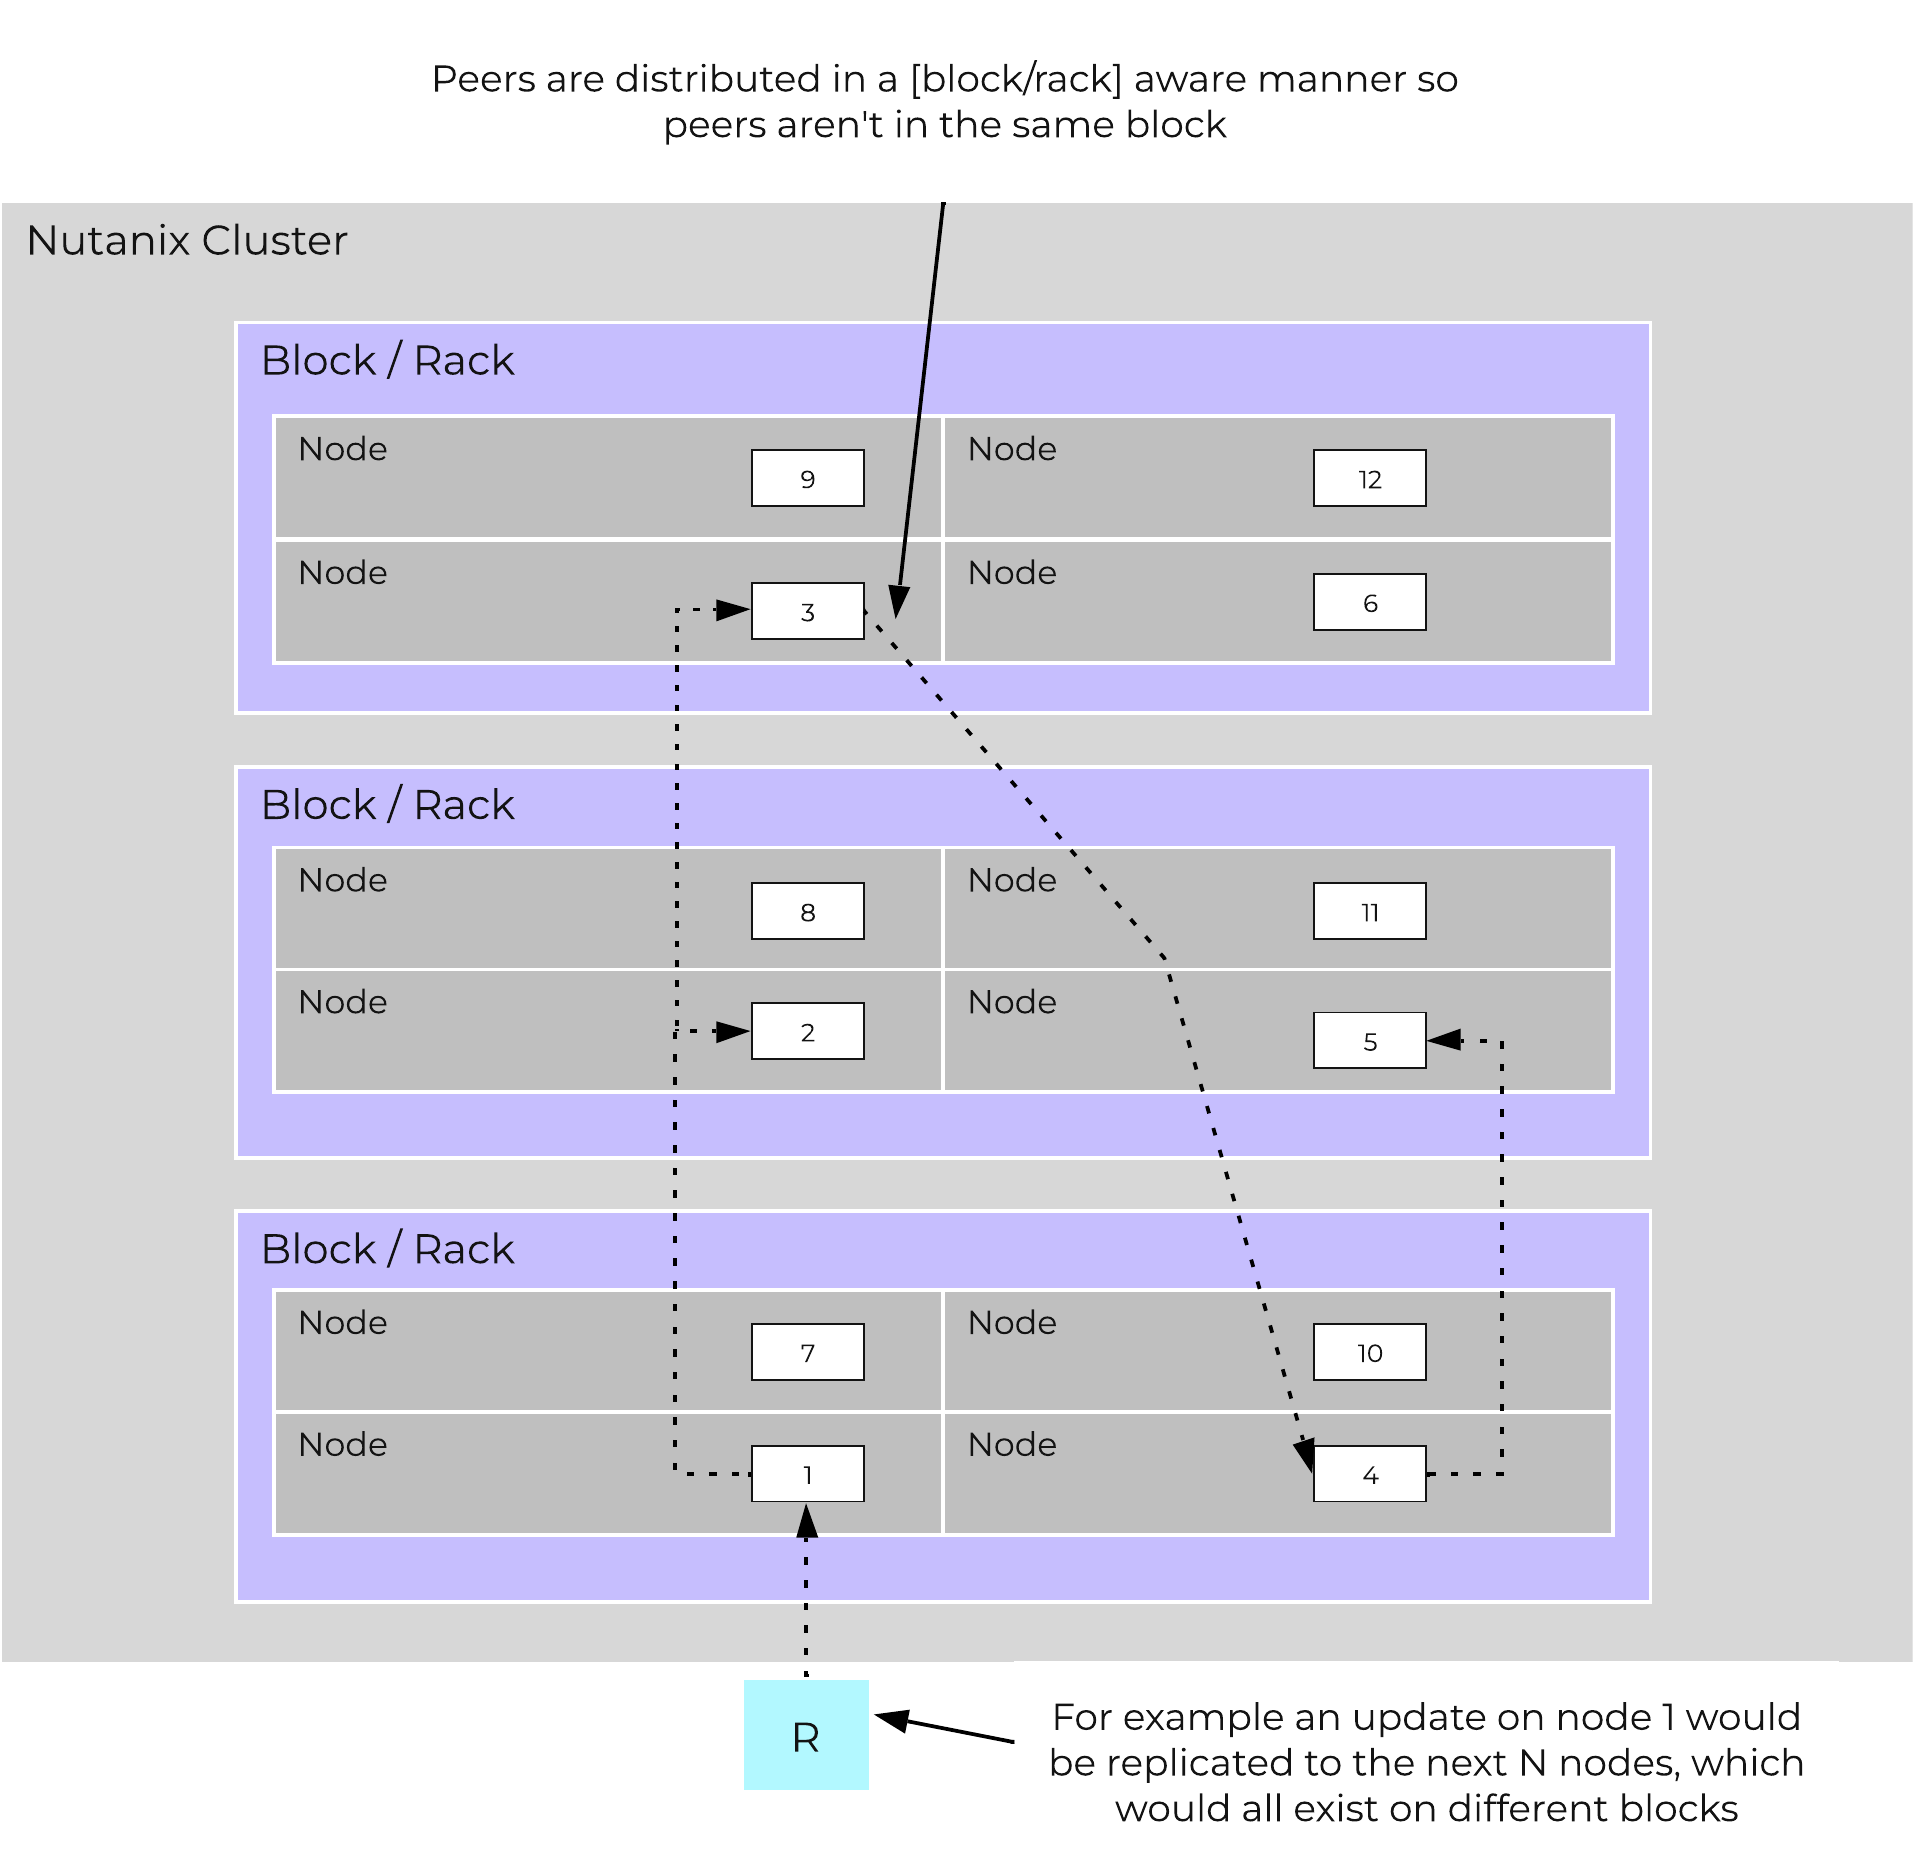 Cassandra Node Block/Rack Aware Placement
With this [block/rack]-aware nature, in the event of a [block/rack] failure there will still be at least two copies of the data (with Metadata RF3 – In larger clusters RF5 can be leveraged).
The following figure shows an example of all of the nodes replication topology to form the ring (yes – it’s a little busy):
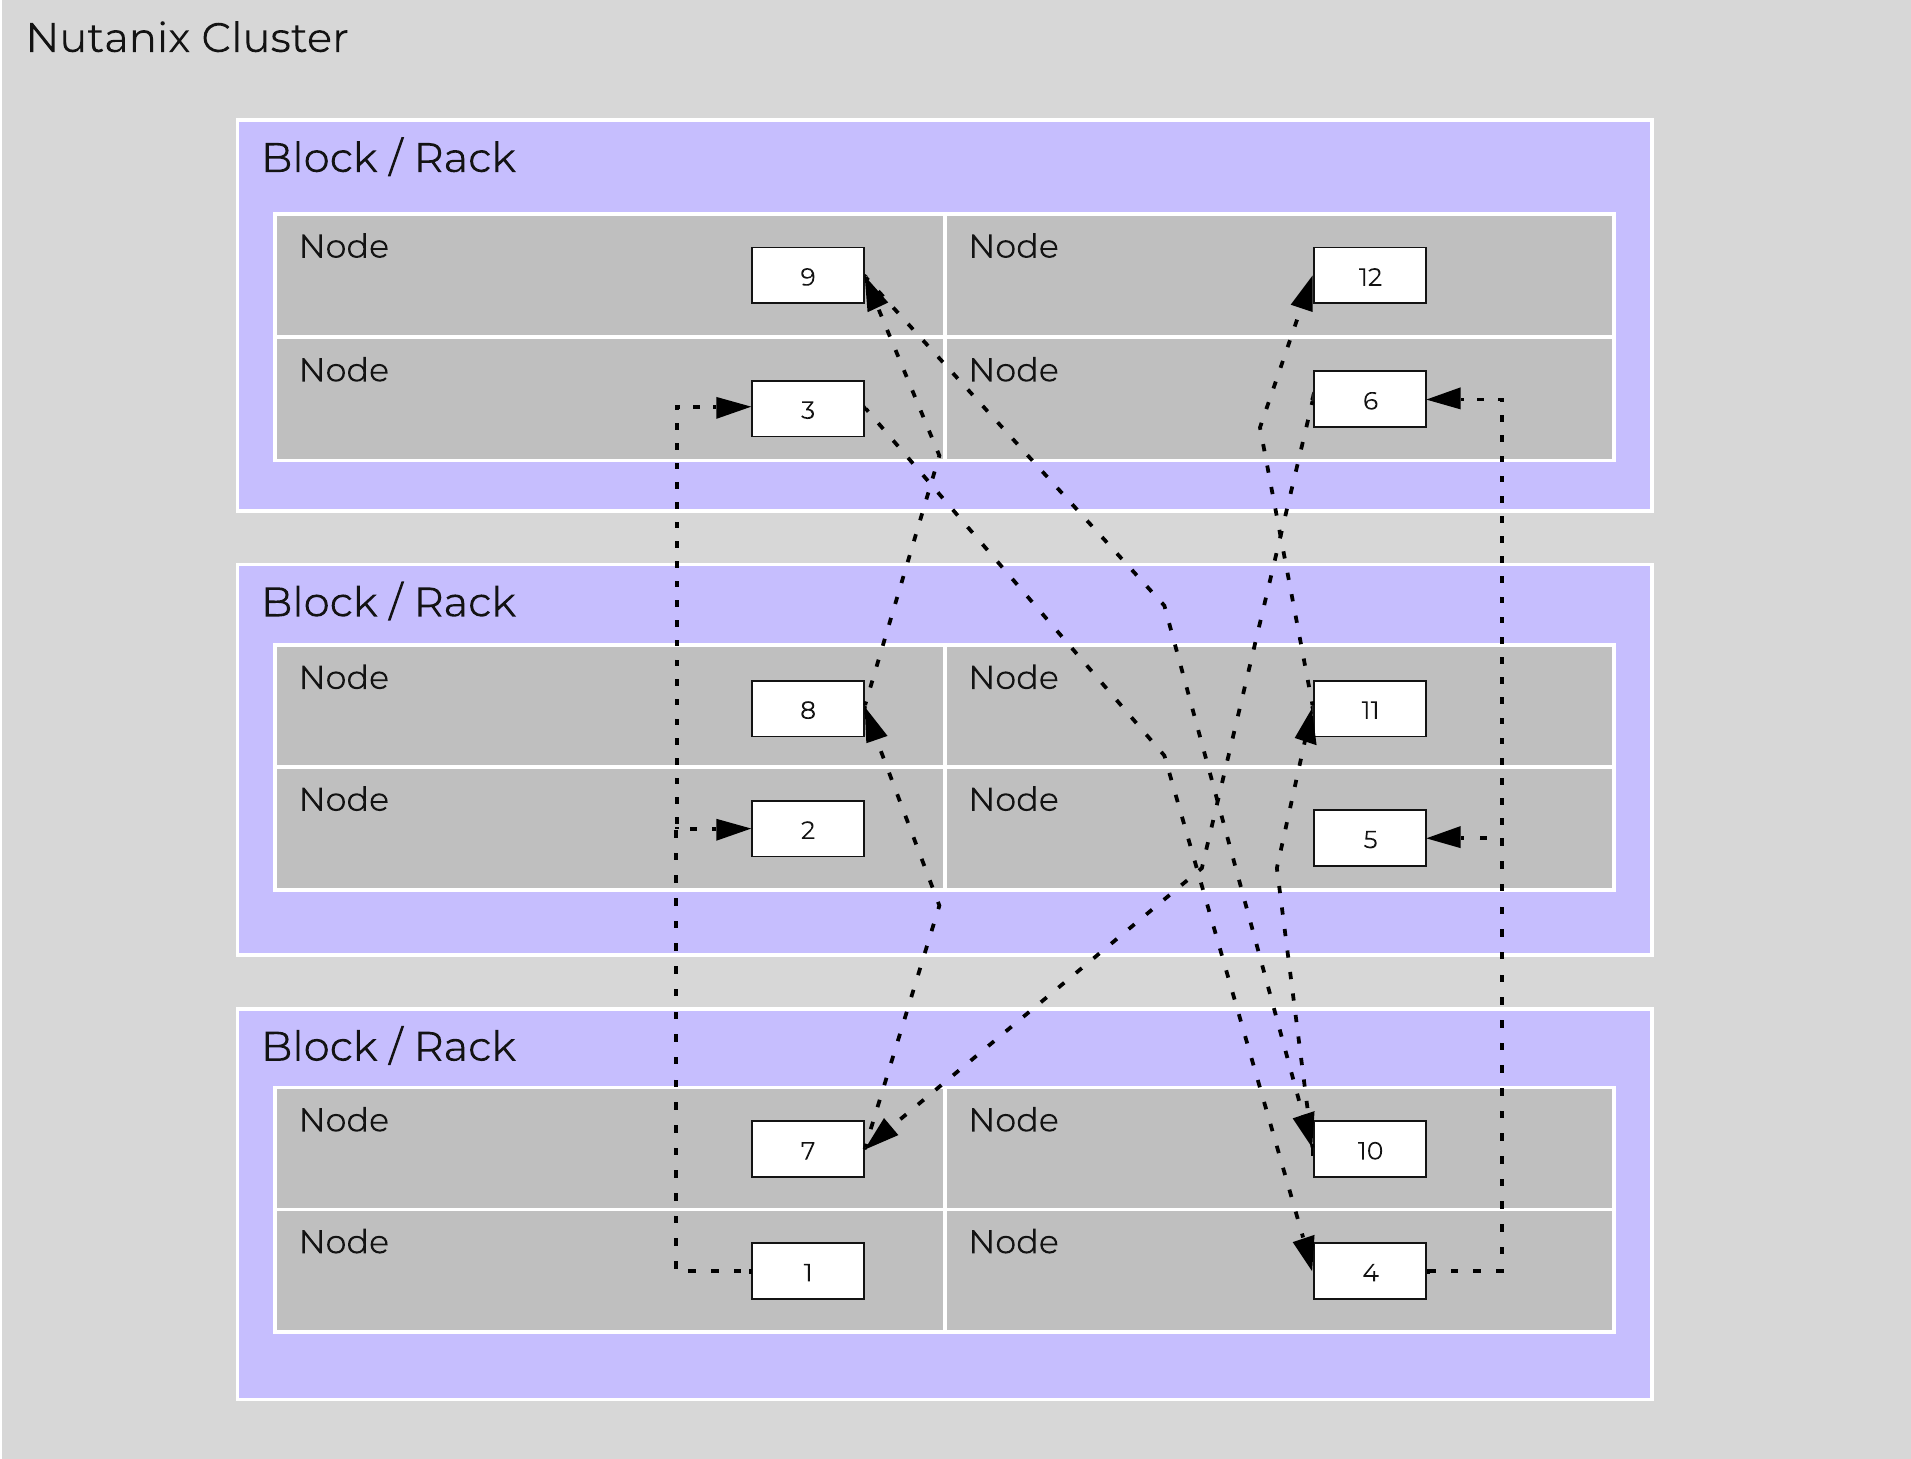 Full Cassandra Node Block/Rack Aware Placement
Note
Metadata Awareness Conditions
Below we breakdown some common scenarios and what level of awareness will be utilized:
- FT1 (Data RF2 / Metadata RF3) will be block aware if:
- >= 3 blocks
- Let X be the number of nodes in the block with max nodes. Then, the remaining blocks should have at least 2X nodes.
-
Example: 4 blocks with 2,3,4,2 nodes per block respectively.
- The max node block has 4 nodes which means the other 3 blocks should have 2x4 (8) nodes. In this case it WOULD NOT be block aware as the remaining blocks only have 7 nodes.
-
Example: 4 blocks with 3,3,4,3 nodes per block respectively.
- The max node block has 4 nodes which means the other 3 blocks should have 2x4==8 nodes. In this case it WOULD be block aware as the remaining blocks have 9 nodes which is above our minimum.
-
Example: 4 blocks with 2,3,4,2 nodes per block respectively.
- FT2 (Data RF3 / Metadata RF5) will be block aware if:
- >= 5 blocks
- Let X be the number of nodes in the block with max nodes. Then, the remaining blocks should have at least 4X nodes.
-
Example: 6 blocks with 2,3,4,2,3,3 nodes per block respectively.
- The max node block has 4 nodes which means the other 3 blocks should have 4x4==16 nodes. In this case it WOULD NOT be block aware as the remaining blocks only have 13 nodes.
-
Example: 6 blocks with 2,4,4,4,4,4 nodes per block respectively.
- The max node block has 4 nodes which means the other 3 blocks should have 4x4==16 nodes. In this case it WOULD be block aware as the remaining blocks have 18 nodes which is above our minimum.
-
Example: 6 blocks with 2,3,4,2,3,3 nodes per block respectively.
Configuration Data
Nutanix leverages Zookeeper to store essential configuration data for the cluster. This role is also distributed in a [block/rack]-aware manner to ensure availability in the case of a [block/rack] failure.
The following figure shows an example layout showing 3 Zookeeper nodes distributed in a [block/rack]-aware manner:
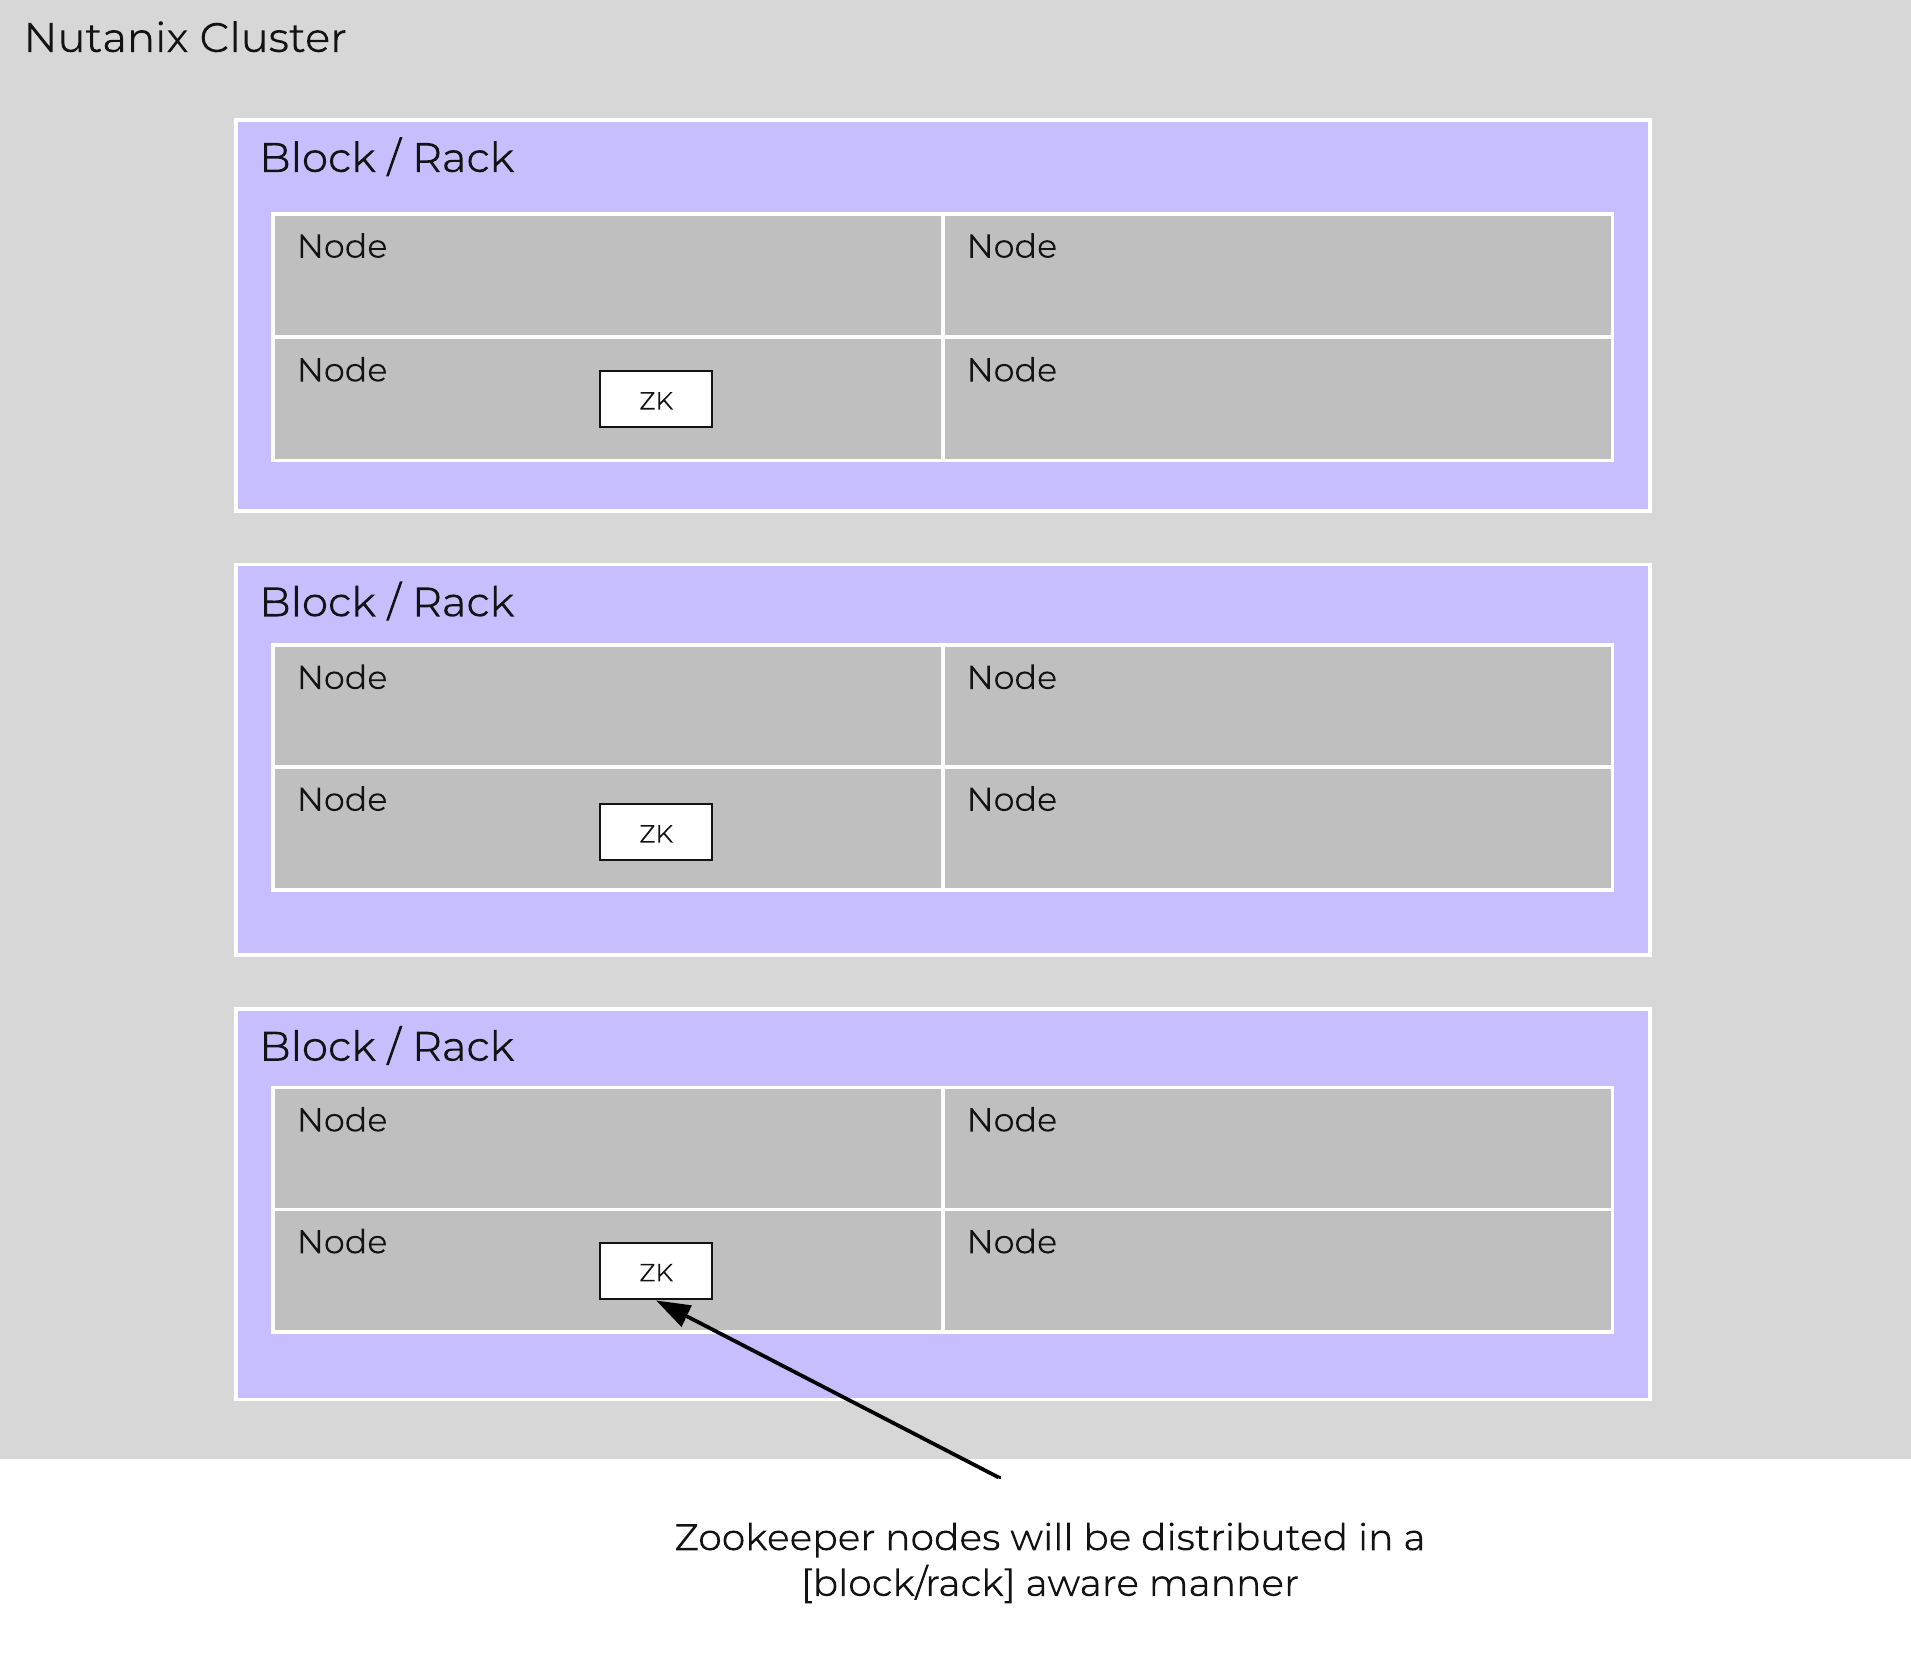 Zookeeper Block/Rack Aware Placement
In the event of a [block/rack] outage, meaning one of the Zookeeper nodes will be gone, the Zookeeper role would be transferred to another node in the cluster as shown below:
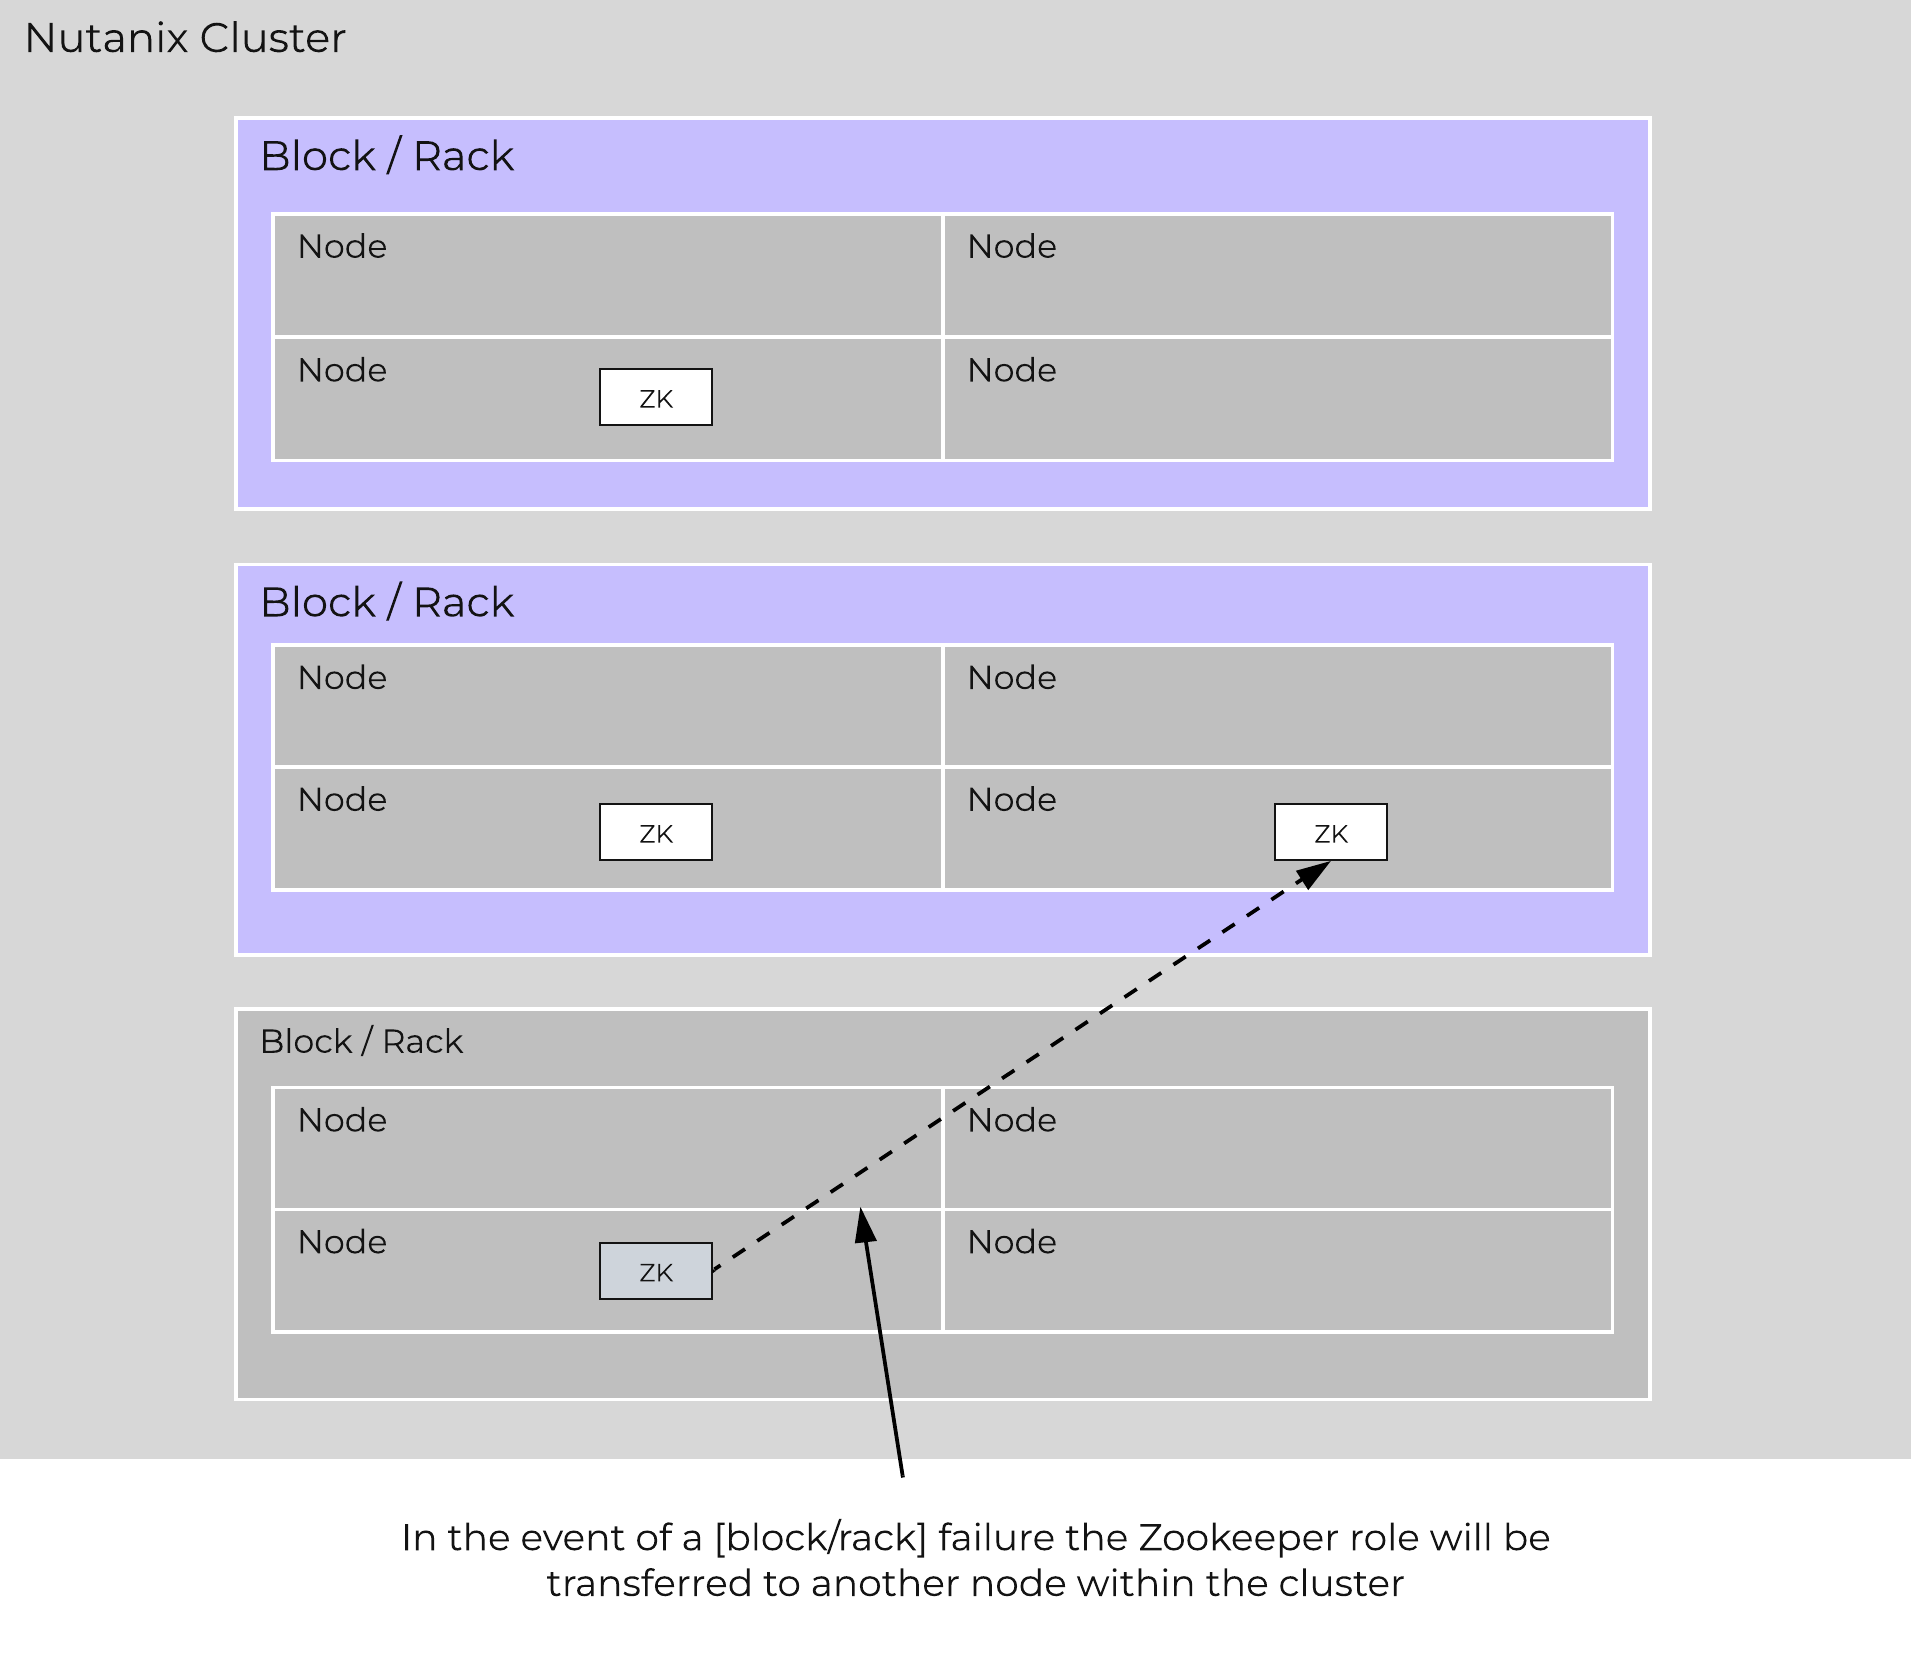 Zookeeper Placement Block/Rack Failure
When the [block/rack] comes back online, the Zookeeper role would be transferred back to maintain [block/rack] awareness.
Data Path Resiliency
Reliability and resiliency are key, if not the most important concepts within AOS or any primary storage platform.
Contrary to traditional architectures which are built around the idea that hardware will be reliable, Nutanix takes a different approach: it expects hardware will eventually fail. By doing so, the system is designed to handle these failures in an elegant and non-disruptive manner.
NOTE: That doesn’t mean the hardware quality isn’t there, just a concept shift. The Nutanix hardware and QA teams undergo an exhaustive qualification and vetting process.
As mentioned in the prior sections metadata and data are protected using a RF which is based upon the cluster FT level. As of 5.0 supported FT levels are FT1 and FT2 which correspond to metadata RF3 and data RF2, or metadata RF5 and data RF3 respectively.
To learn more about how metadata is sharded refer to the prior ‘Scalable Metadata’ section. To learn more about how data is protected refer to the prior ‘Data protection’ section.
In a normal state, cluster data layout will look similar to the following:
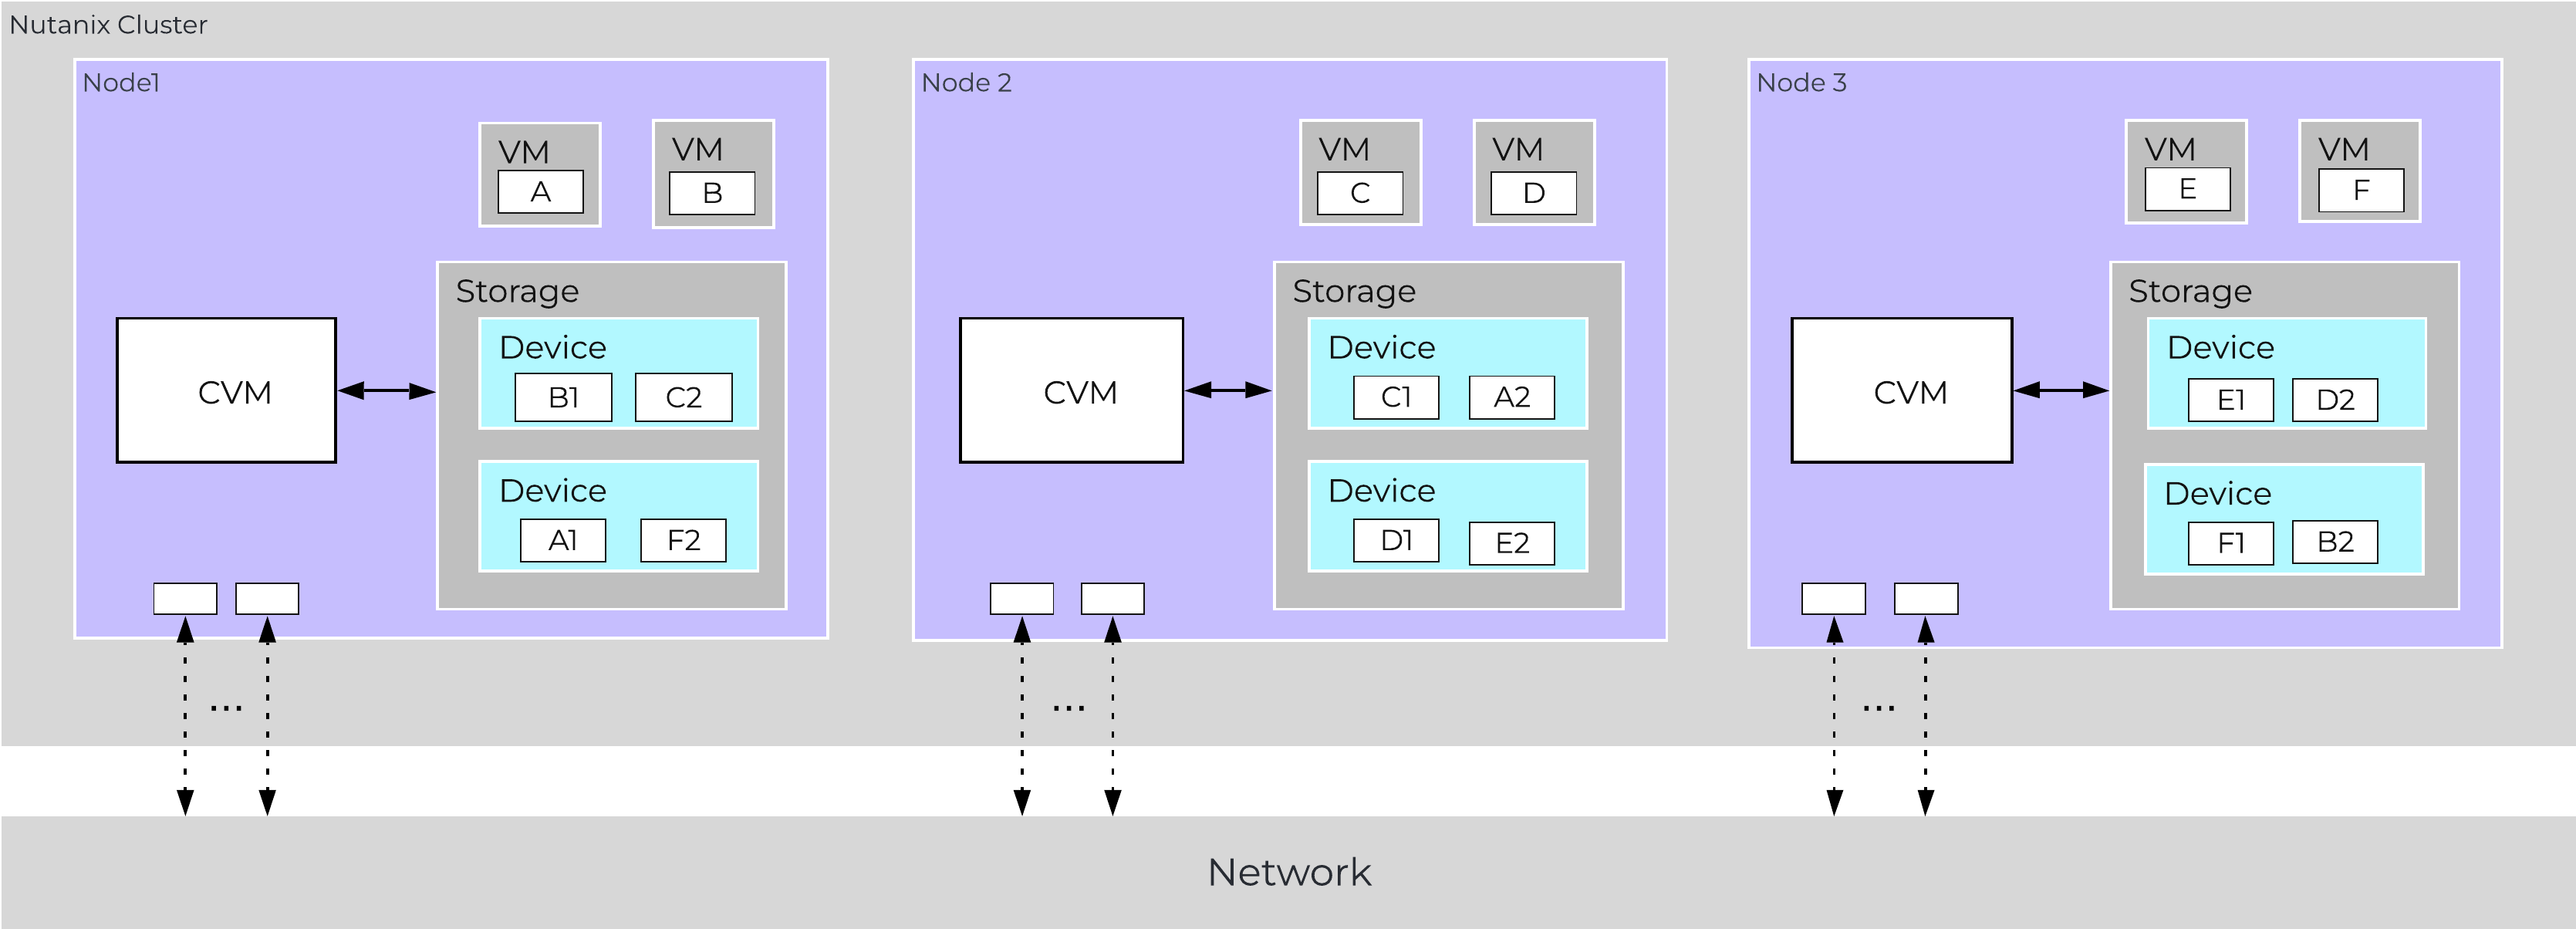 Data Path Resiliency - Normal State
As you can see the VM/vDisk data has 2 or 3 copies on disk which are distributed among the nodes and associated storage devices.
Note
Importance of Data Distribution
By ensuring metadata and data is distributed across all nodes and all disk devices we can ensure the highest possible performance during normal data ingest and re-protection.
As data is ingested into the system its primary and replica copies will be distributed across the local and all other remote nodes. By doing so we can eliminate any potential hot spots (e.g. a node or disk performing slowly) and ensure a consistent write performance.
In the event of a disk or node failure where data must be re-protected, the full power of the cluster can be used for the rebuild. In this event the scan of metadata (to find out the data on the failed device(s) and where the replicas exist) will be distributed evenly across all CVMs. Once the data replicas have been found all healthy CVMs, disk devices (SSD+HDD), and host network uplinks can be used concurrently to rebuild the data.
For example, in a 4 node cluster where a disk fails each CVM will handle 25% of the metadata scan and data rebuild. In a 10 node cluster, each CVM will handle 10% of the metadata scan and data rebuild. In a 50 node cluster, each CVM will handle 2% of the metadata scan and data rebuild.
Key point: With Nutanix and by ensuring uniform distribution of data we can ensure consistent write performance and far superior re-protection times. This also applies to any cluster wide activity (e.g. erasure coding, compression, deduplication, etc.)
Comparing this to other solutions where HA pairs are used or a single disk holds a full copy of the data, they will face frontend performance issues if the mirrored node/disk is under duress (facing heavy IO or resource constraints).
Also, in the event of a failure where data must be re-protected, they will be limited by a single controller, a single node's disk resources and a single node's network uplinks. When terabytes of data must be re-replicated this will be severely constrained by the local node's disk and network bandwidth, increasing the time the system is in a potential data loss state if another failure occurs.
Potential levels of failure
Being a distributed system, AOS is built to handle component, service, and CVM failures, which can be characterized on a few levels:
- Disk Failure
- CVM “Failure”
- Node Failure
Note
When does a rebuild begin?
When there is an unplanned failure (in some cases we will proactively take things offline if they aren't working correctly) we begin the rebuild process immediately.
Unlike some other vendors which can, depending on the failure, wait up to 60 minutes to start rebuilding and only maintain a single copy during that period (very risky and can lead to data loss if there's any sort of failure), we are not willing to take that risk at the sacrifice of potentially higher storage utilization.
We can do this because of a) the granularity of our metadata b) choose peers for write RF dynamically (while there is a failure, all new data (e.g. new writes / overwrites) maintain their configured redundancy) and c) we can handle things coming back online during a rebuild and re-admit the data once it has been validated. In this scenario data may be "over-replicated" in which a Curator scan will kick off and remove the over-replicated copies.
Disk Failure
A disk failure can be characterized as just that, a disk which has either been removed, encounters a failure, or one that is not responding or has I/O errors. When Stargate sees I/O errors or the device fails to respond within a certain threshold it will mark the disk offline. Once that has occurred Hades will run S.M.A.R.T. and check the status of the device. If the tests pass the disk will be marked online, if they fail it will remain offline. If Stargate marks a disk offline multiple times (currently 3 times in an hour), Hades will stop marking the disk online even if S.M.A.R.T. tests pass.
VM impact:
- HA event:No
- Failed I/Os:No
- Latency:No impact
In the event of a disk failure, a Curator scan (MapReduce Framework) will occur immediately. It will scan the metadata (Cassandra) to find the data previously hosted on the failed disk and the nodes / disks hosting the replicas.
Once it has found that data that needs to be “re-replicated”, it will distribute the replication tasks to the nodes throughout the cluster.
During this process a Drive Self Test (DST) is started for the bad disk and SMART logs are monitored for errors.
The following figure shows an example disk failure in node 1, device 1 and re-protection on node 2 and 3:
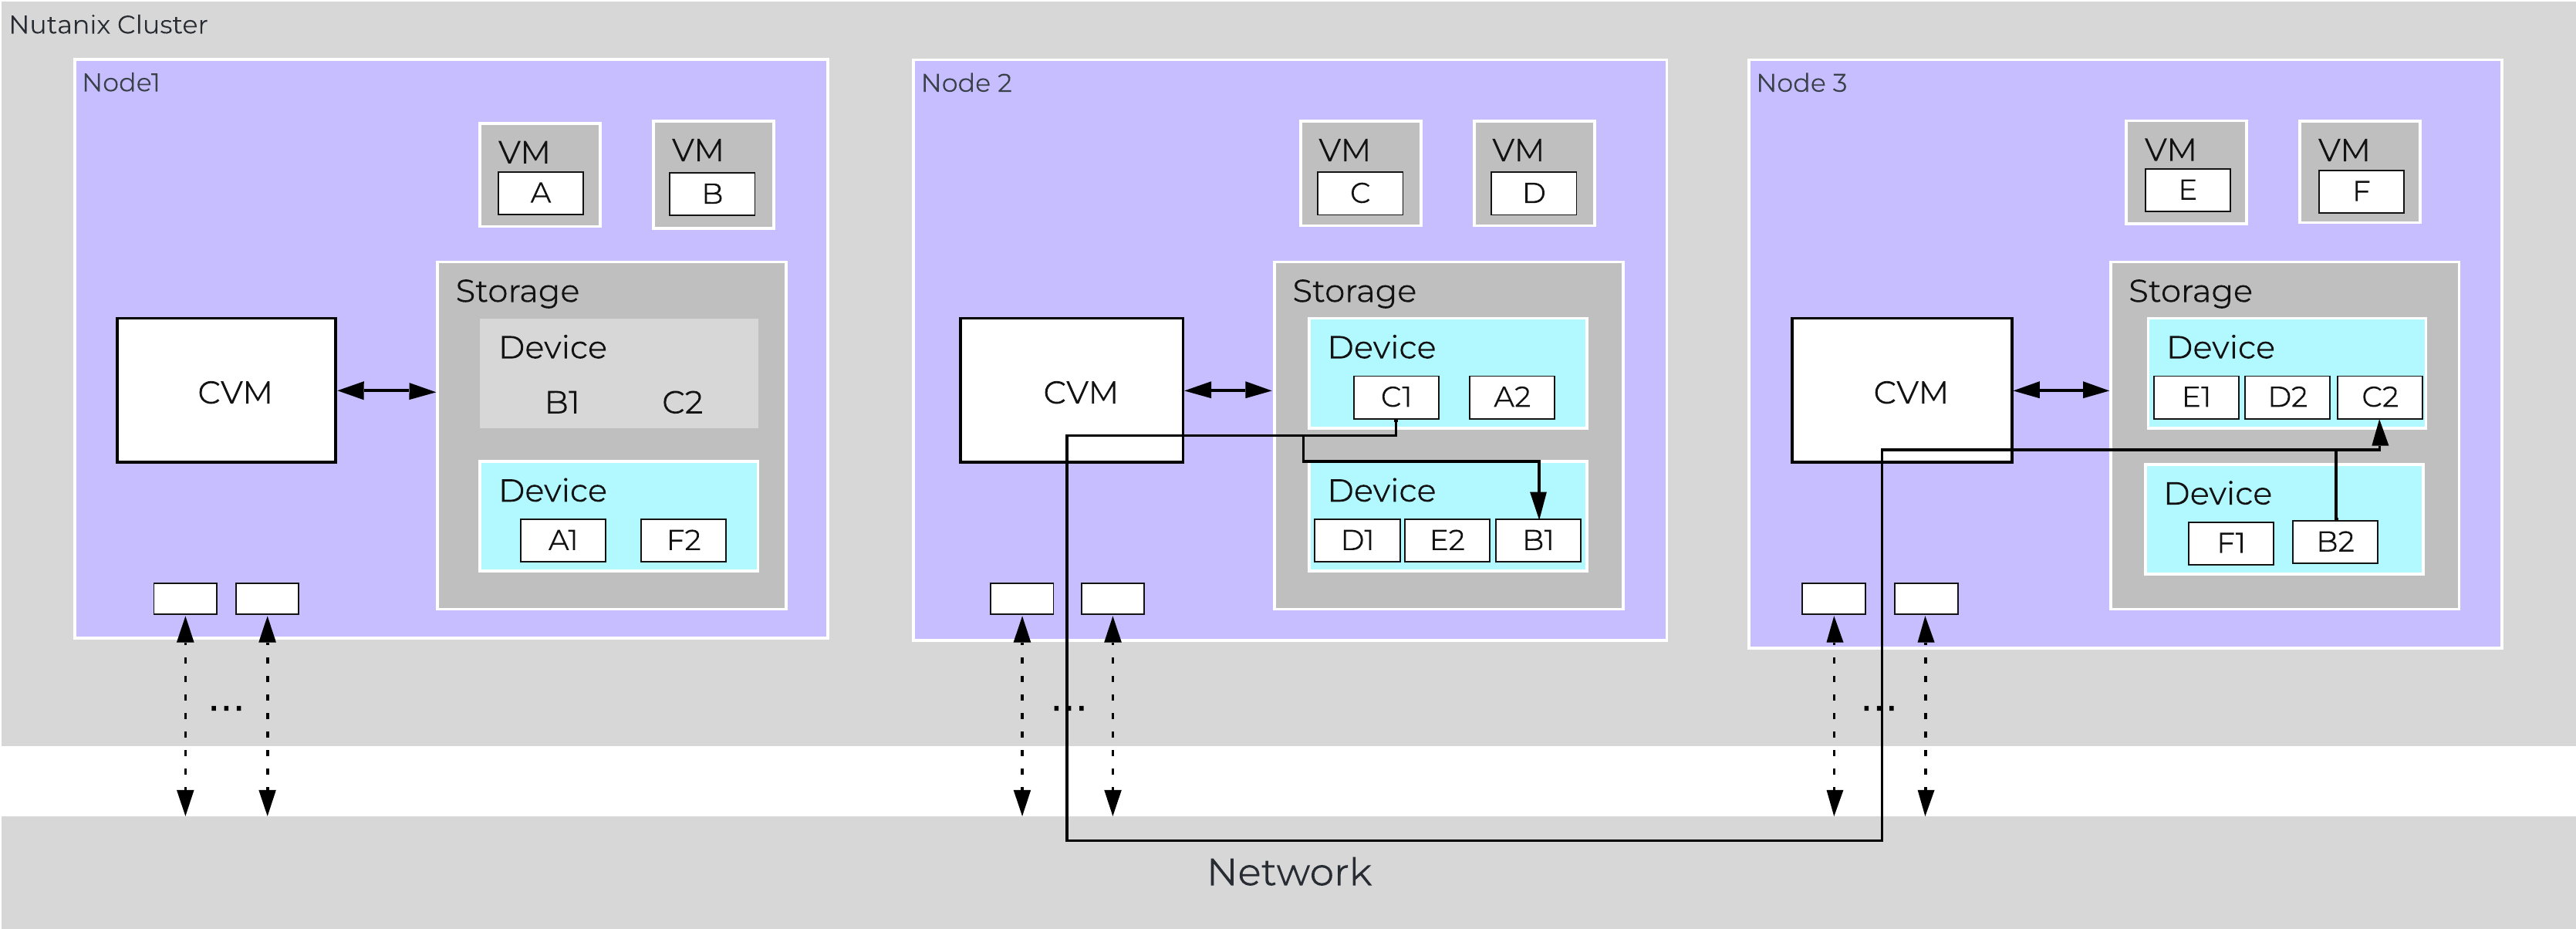 Data Path Resiliency - Node 1 Disk Failure
An important thing to highlight here is given how Nutanix distributes data and replicas across all nodes / CVMs / disks; all nodes / CVMs / disks will participate in the re-replication.
This substantially reduces the time required for re-protection, as the power of the full cluster can be utilized; the larger the cluster, the faster the re-protection.
Node Failure
VM Impact:
- HA event:Yes
- Failed I/Os:No
- Latency:No impact
In the event of a node failure (node 1 shown below), a VM HA event will occur restarting the VMs on other nodes throughout the virtualization cluster. Once restarted, the VMs will continue to perform I/Os as usual which will be handled by their local CVMs.
Similar to the case of a disk failure above, a Curator scan will find the data previously hosted on the node and its respective replicas. Once the replicas are found all nodes will participate in the reprotection.
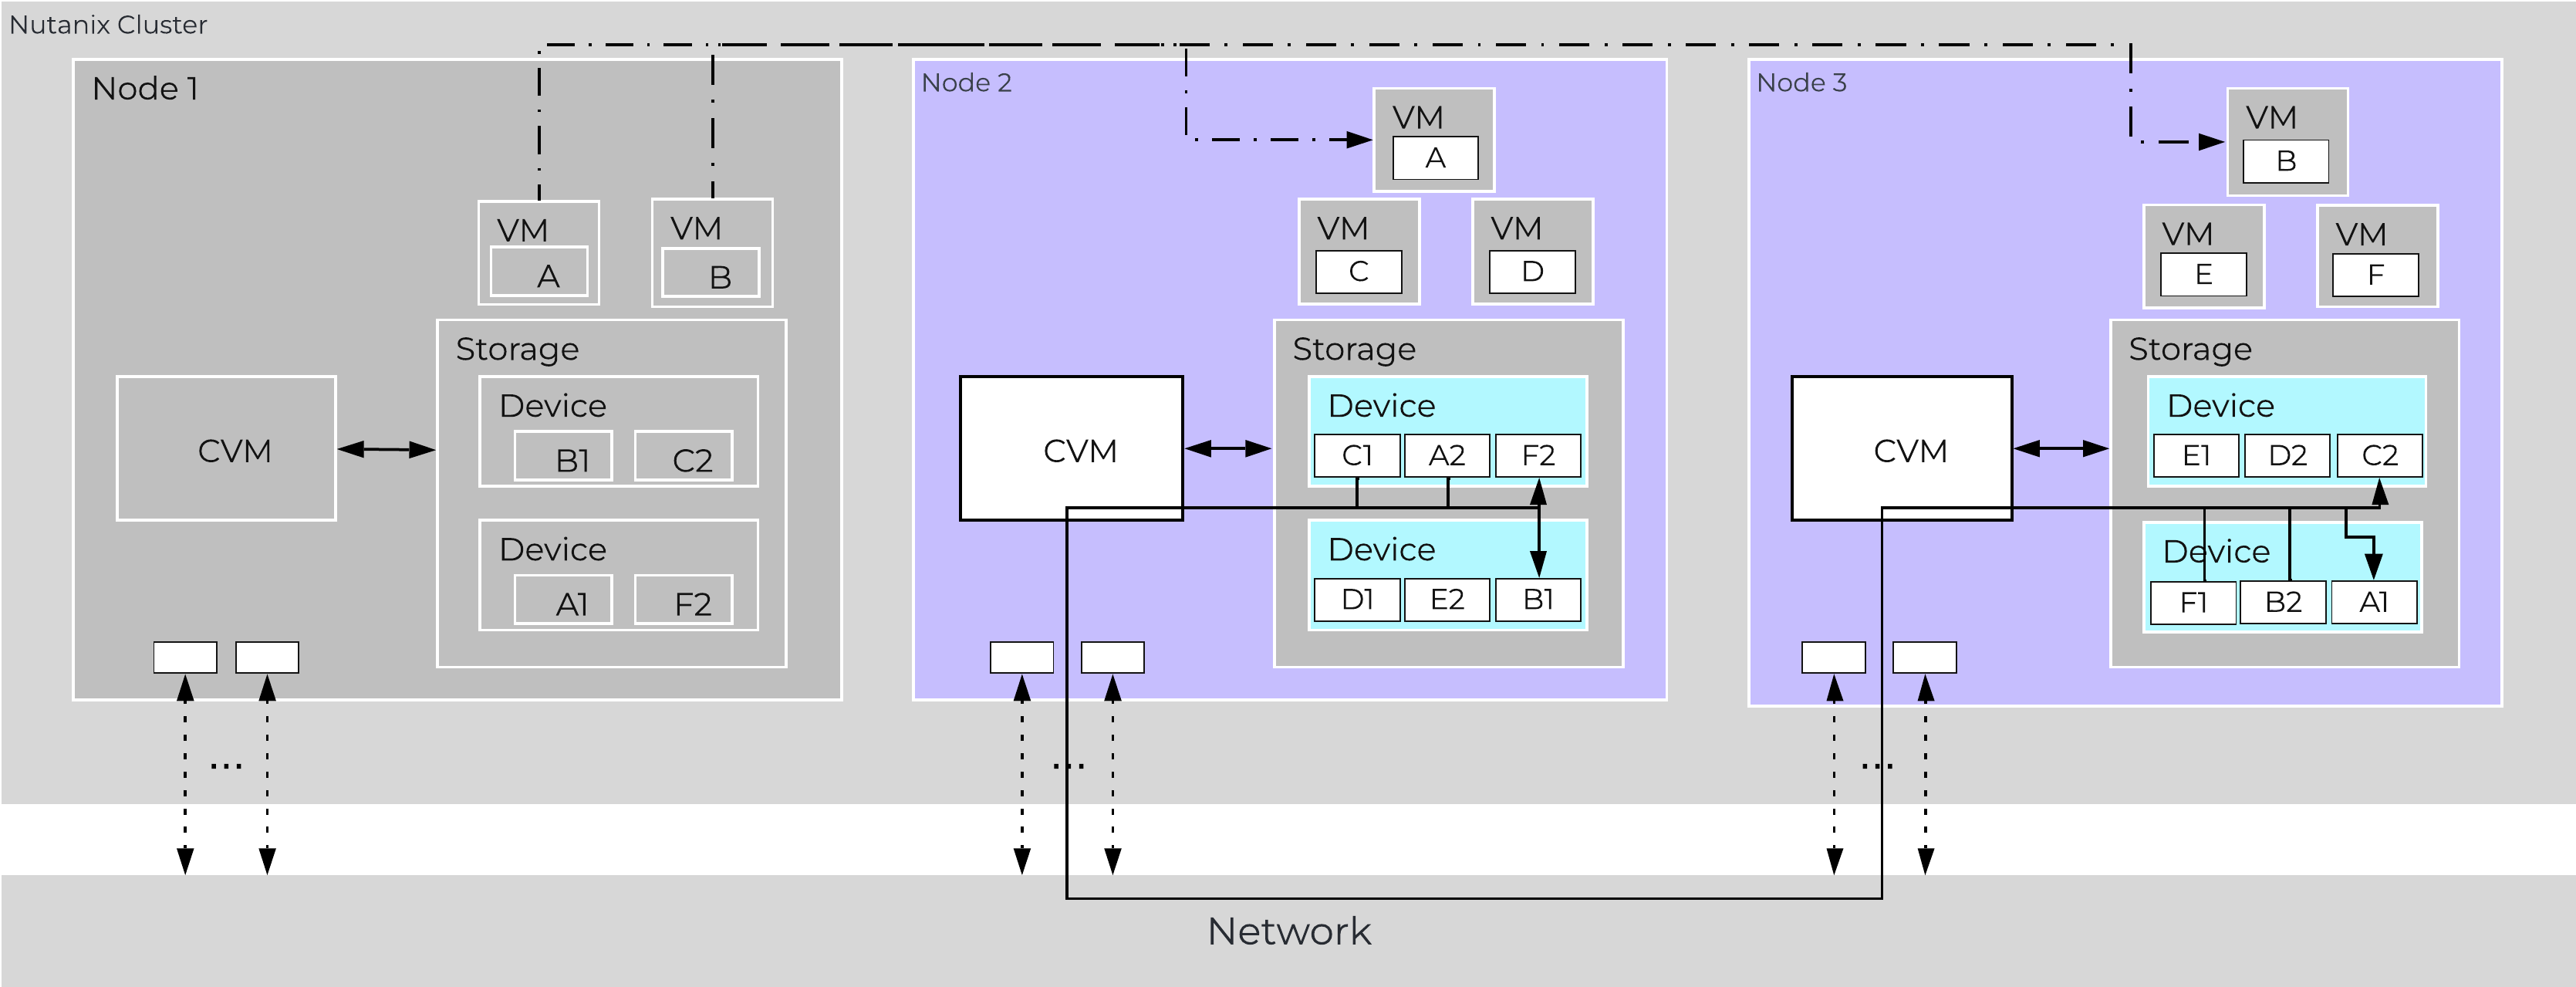 Data Path Resiliency - Node 1 Failure
In the event where the node remains down for a prolonged period of time (30 minutes), the down CVM will be removed from the metadata ring. It will be joined back into the ring after it has been up and stable for a duration of time.
Note
Pro tip
Data resiliency state will be shown in Prism on the dashboard page.
You can also check data resiliency state via the cli:
###### Node Statusncli cluster get-domain-fault-tolerance-status type=node###### Block Status
ncli cluster get-domain-fault-tolerance-status type=rackable_unit
These should always be up to date, however to refresh the data you can kick off a Curator partial scan.
CVM “Failure”
A CVM “failure” can be characterized as a CVM power action causing the CVM to be temporarily unavailable. The system is designed to transparently handle these gracefully. In the event of a failure, I/Os will be re-directed to other CVMs within the cluster. The mechanism for this will vary by hypervisor.
The rolling upgrade process actually leverages this capability as it will upgrade one CVM at a time, iterating through the cluster.
VM impact:
- HA event:No
- Failed I/Os:No
- Latency:Potentially higher given I/Os over the network
In the event of a CVM “failure” the I/O which was previously being served from the down CVM, will be forwarded to other CVMs throughout the cluster. ESXi and Hyper-V handle this via a process called CVM Autopathing, which leverages HA.py (like “happy”), where it will modify the routes to forward traffic going to the internal address (192.168.5.2) to the external IP of other CVMs throughout the cluster. This enables the datastore to remain intact, just the CVM responsible for serving the I/Os is remote.
Once the local CVM comes back up and is stable, the route would be removed and the local CVM would take over all new I/Os.
In the case of AHV, iSCSI multi-pathing is leveraged where the primary path is the local CVM and the two other paths would be remote. In the event where the primary path fails, one of the other paths will become active.
Similar to Autopathing with ESXi and Hyper-V, when the local CVM comes back online, it’ll take over as the primary path.
Resilient Capacity
Some refresher on terms used:
- Failure/Availability Domain(FD): Logical grouping of entities across which replicas are placed. Node is default domain on Nutanix clusters for node sizes > 3. Refer to Availability Domain section.
- Replication Factor(RF): Number of copies of data to be maintained on cluster for data availability.
- Fault Tolerance(FT): Number of failure(s) of entities at configured FD that can be handled by cluster, ensuring data on failed entity is rebuilt completely.
Resilient capacity is storage capacity in a cluster that can be consumed at the lowest availability/failure domain while maintaining the cluster’s ability to self-heal and recover to desired replication factor (RF) after FT failure(s) at the configured availability/failure domain. So in simple terms, Resilient Capacity = Total Cluster Capacity - Capacity needed to rebuild from FT failure(s).
Note
Resilient Capacity Examples
Homogeneous Cluster Capacity
- Configured Availability Domain: Node
- Lowest Availability Domain: Node
- FT=1
- RF=2
- Node Capacities: 10TB,10TB,10TB,10TB
- Resilient Capacity = (40-10)*0.95 = 28.5TB. 95% is threshold at which Stargate goes read-only mode not taking any more user writes
Non-Homogeneous Cluster Capacity
- Configured Availability Domain: Block(1 node/block)
- Lowest Availability Domain: Node
- FT=1
- RF=2
- Node Capacities: 10TB,10TB,40TB,40TB
- Resilient Capacity = 40*0.95 = 38TB. 95% is threshold at which Stargate goes read-only mode not taking any more user writes
The resilient capacity in this case is 40TB and not 60TB because after losing the 40TB block, the cluster has node availability domain. At this level to maintain 2 data copies, the capacity available is 40TB which makes resilient capacity in this case to be 40TB overall.
It is recommended to keep clusters uniform and homogenous from capacity and failure domain perspective.
The resilient capacity is displayed within Prism management UI within the storage summary widget (Prism Central via the Clusters view and Prism Element via the Storage view) with a gray line. Thresholds can be set to warn end users when cluster usage is reaching resilient capacity. By default that is set to 75%.
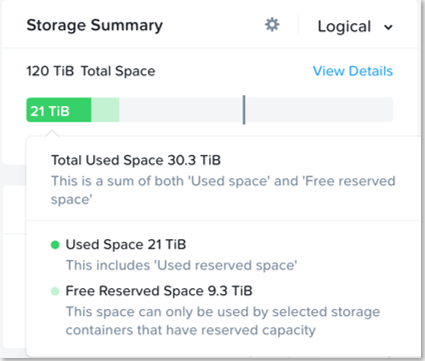
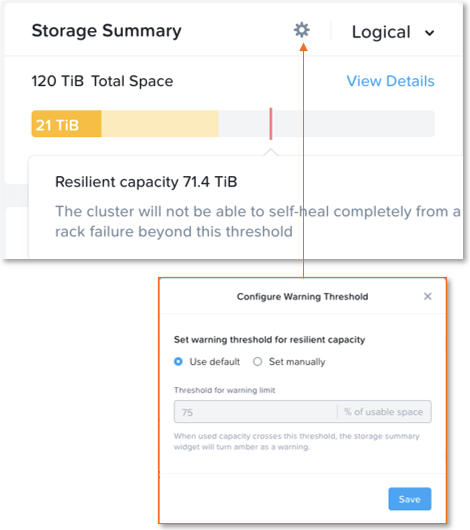
Prism can also show detailed storage utilizations on a per node basis which helps administrators understand resiliency on a per node basis. This is useful in clusters which have a skewed storage distribution.
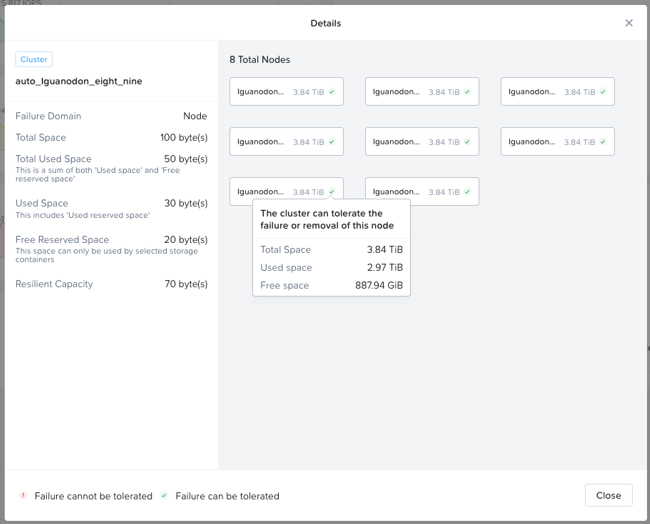
When cluster usage is greater than resilient capacity for that cluster, the cluster might not be able to tolerate and recover from failures anymore. Cluster can possibly still recover and tolerate failure at a lower failure domain as resilient capacity is for configured failure domain. For example, a cluster with a node failure domain may still be able to self-heal and recover from a disk failure but cannot self-heal and recover from a node failure.
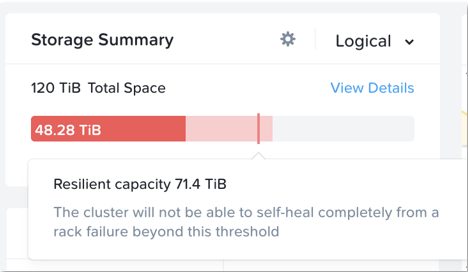
It is highly recommeded to not exceed the resilient capacity of a cluster in any circumstances to ensure proper functioning of cluster and maintain it’s ability to self-heal and recover from failures.
» Download this section as PDF (opens in a new tab/window)
Security is a core part of the Nutanix platform and was kept in mind from day one. The Nutanix Security Development Lifecycle (SecDL) incorporates security into every step of the development process. The Nutanix controlled parts of the platform is secure out of the box, rather than being an afterthought requiring end-users to “harden” the platform.
When we think about security we’re really trying to achieve 3 core things (aptly named the CIA triad):
- Confidentially
- Protect and secure data by preventing unauthorized access
- Integrity
- Ensure the consistency and accuracy of data by preventing unauthorized alteration
- Availability
- Ensure authorized users get access to data through resiliency and redundancy
This can be simplified down to a simple statement: enable users to do their jobs while keeping the bad people out. When we’re designing for security we need to look at a few core areas of interest which is highlighted in the following diagram:
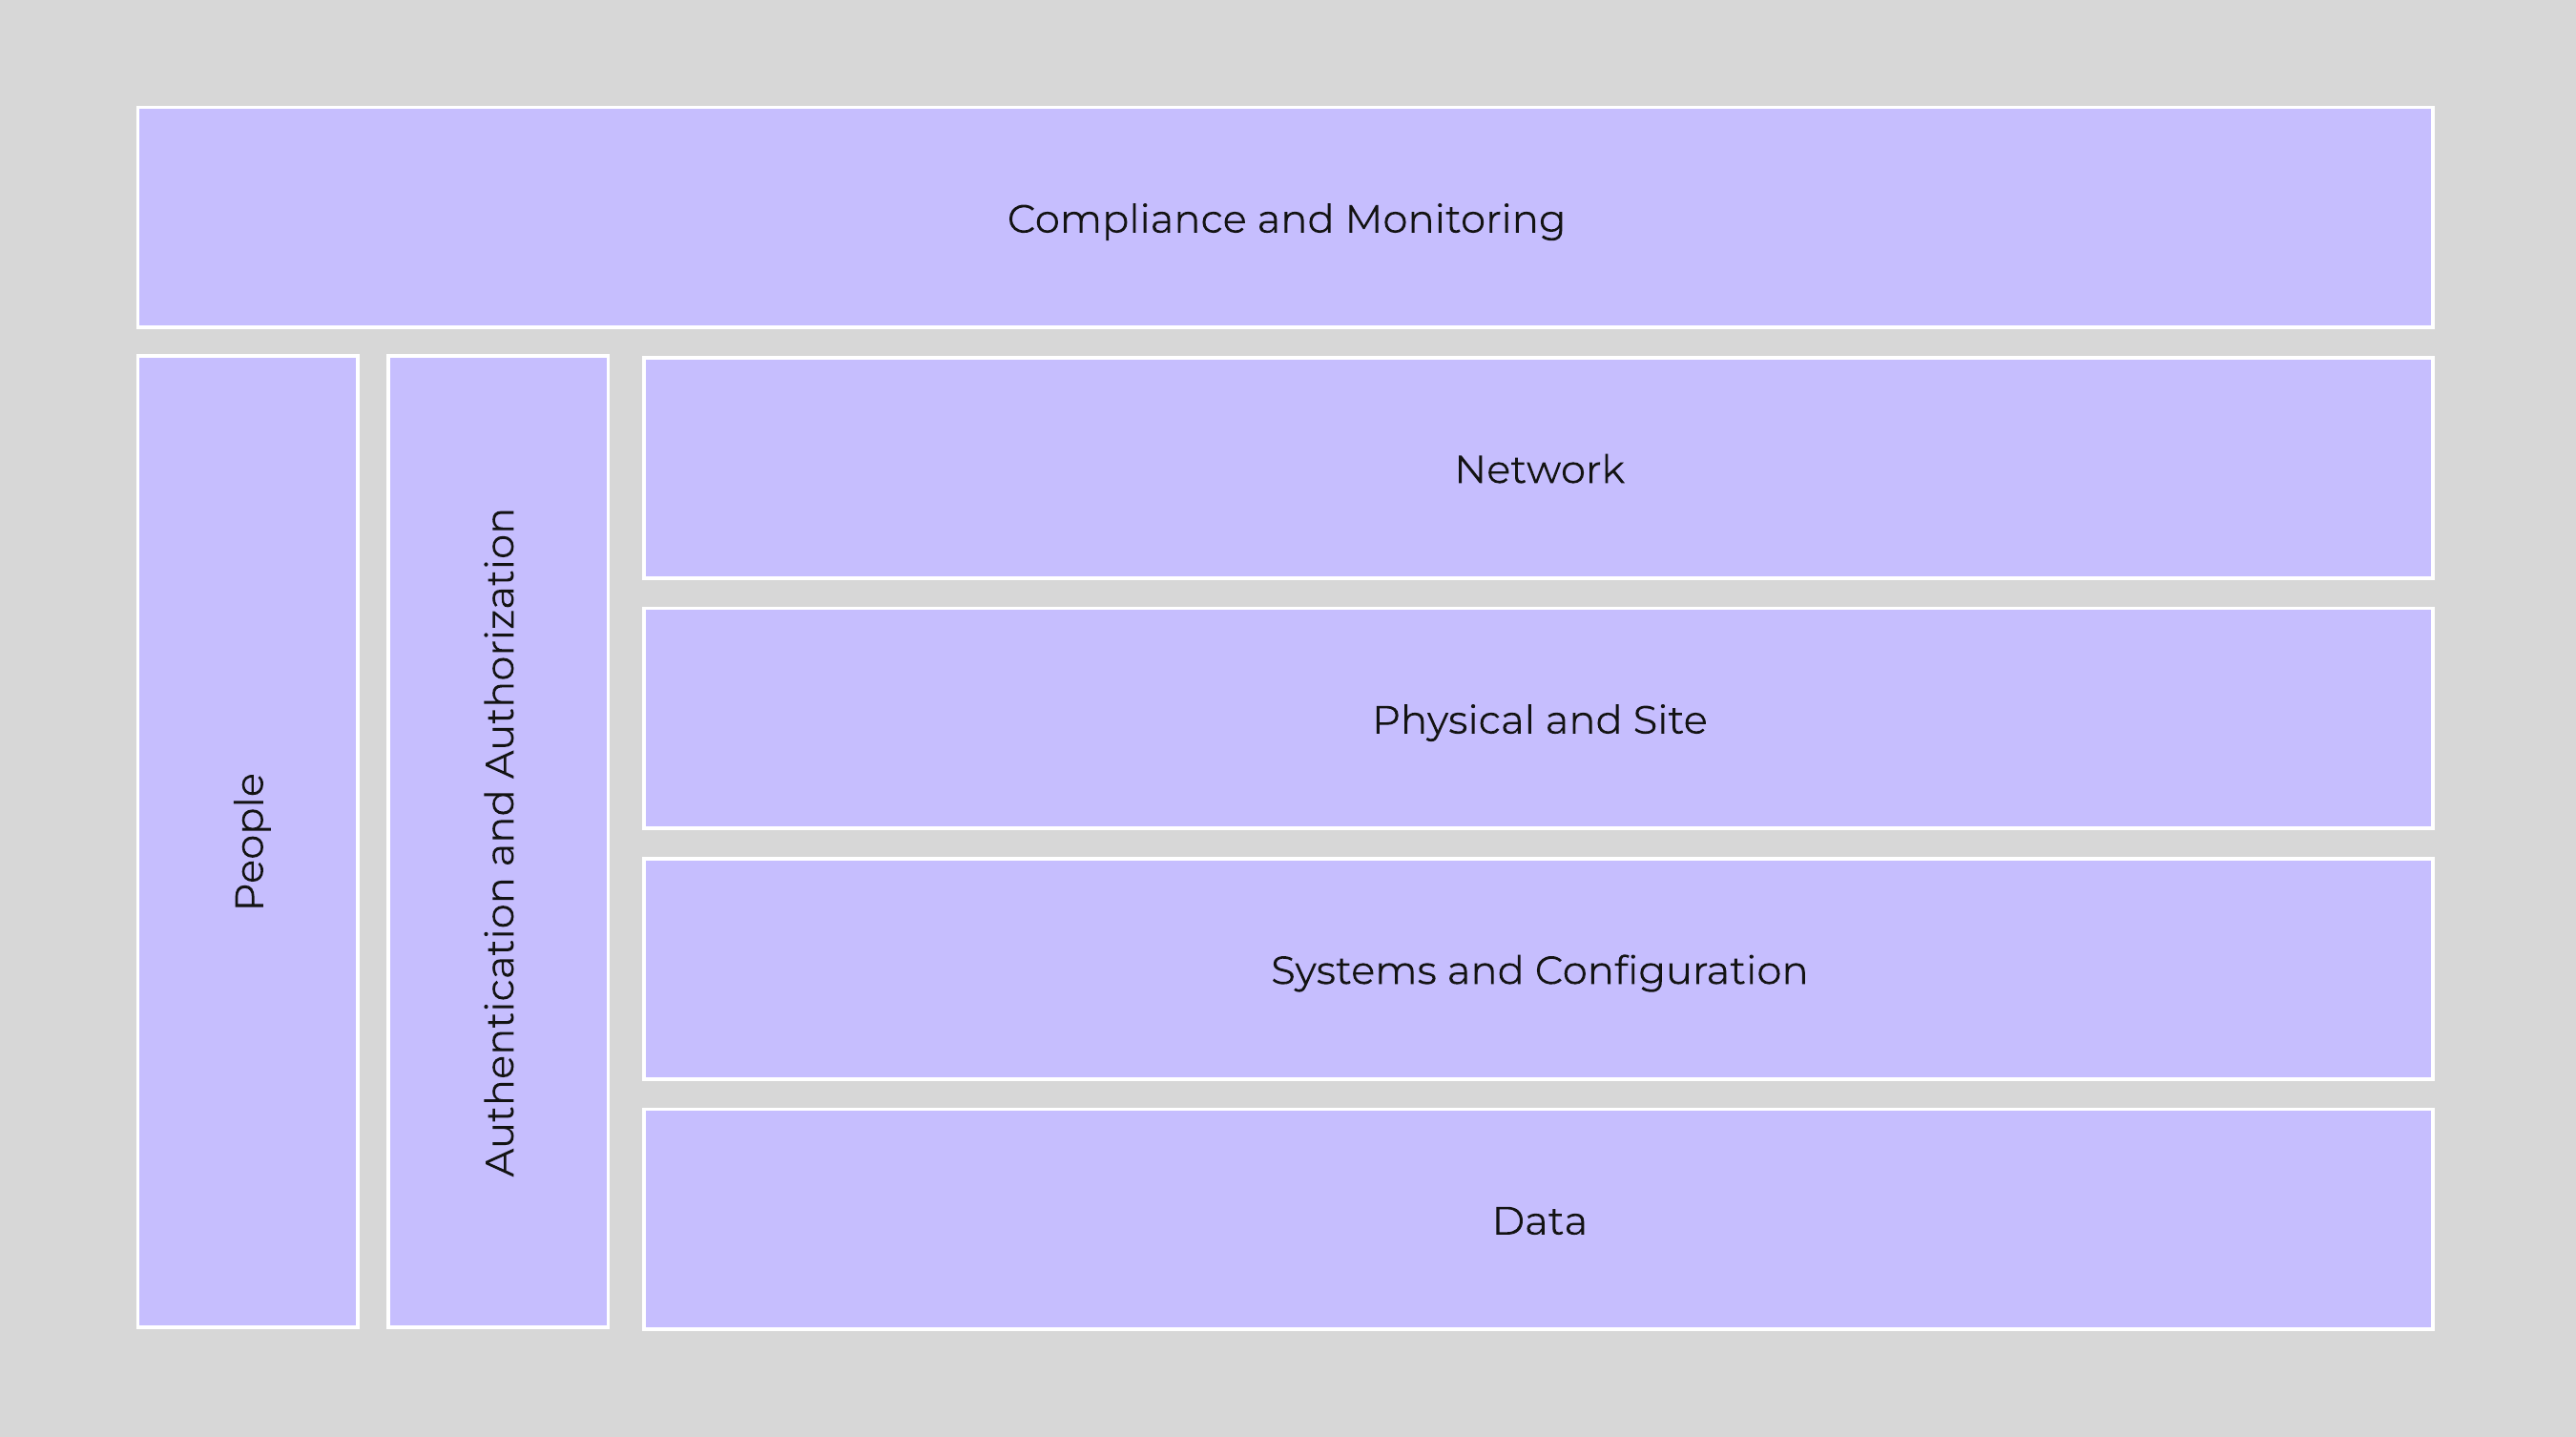 Security Layers
We will break down each section in the prior graphic in the following sections.
Systems & Configuration
Note
At a glance
- Patch and remove known vulnerabilities
- Enforce strong passwords and remove default accounts
- Configure permissions and user privileges
- Close unused ports / protocols
- Use automation to ensure baselines
Traditionally people refer to system (OS + App) security using a method called “hardening”. This is the process to which you would secure the system by configuring things to a certain standard called a baseline.
The DoD’s IT org (DISA) has a sample hardening guide which they call the STIG (more details in the SCMA section following). This includes things like directory permissions, user account management, password complexity, firewalls and a slew of other configuration settings.
Once a system is configured to that standard it is considered “secure” however that is just the beginning of the process. System security is something that must be maintained throughout its lifespan. For example, to ensure that standard hardening baseline is met, configuration automation tools should be employed. This ensures the system is always meeting your baseline “desired state”.
Nutanix ensures this for its CVM and AHV hypervisor using a tool we’ve developed called SCMA which is covered later in this section.
Data
Note
At a glance:
- Secure access control to data
- Always take backups
- Encrypt data and secure keys
Data is at the core of any business and is arguably the company’s most valuable asset. When thinking of security we need to focus on ensuring data accessibility, quality, and theft avoidance.
On the concept of accessibility, we constantly need access to systems and data to make decisions. One recent method of attack called ‘Ransomware’ threatens the ability to access data by encrypting the data and then ransoming the user to get access back. This can be avoided in a variety of methods, but also highlights to importance of backups.
Data quality is also a critical item since a lot of decisions or actions are depending on this. For example, an attacker could get access to a system and place malicious orders or update shipping addresses diverting goods to his location. This is where logging and checksumming can be very critical to ensure data remains clean.
Last but not least is how do we secure or harden the data. This is typically done using encryption which renders the data useless if they don’t have the keys to decrypt the data. In this case if someone were to steal an encrypted file or disk device, they would be unable to get access to the underlying data.
Network
Note
At a glance:
- Segment trusted/untrusted networks
- Firewall at the perimeter and between segments
- Leverage an IDPS to detect anomalies
The network is the typically communication vector attackers use to gain access to systems. This includes things like perimeter security (e.g. external firewalls) and internal intrusion prevention / detection.
Like any good design there should always be layers of security; the same holds true with the network. We need to segment our high-security networks from our trusted networks and secure those from our untrusted networks (e.g. business / wifi networks). It is never safe to assume your local network in the office is secure.
By having multiple layers of the network we can ensure someone who gains access our most untrusted network has a more difficult time working towards our secure networks. During this process a good IDPS system can detect access anomalies or scanning tools like nmap.
Authentication and Authorization
Note
At a glance:
- Use MFA/2FA where possible
- Use granular permissions
Authentication is all about authenticating a users identity against a trusted source of truth like Active Directory or any other IDP (Identity provider). Tools like MFA (multi-factor authentication) or 2FA add additional assurance the user is who they’re trying to authenticate as.
Once the identity has been verified the next piece is to determine what they are authorized to do or what they can access; this is the authorization piece. User foo is authorized to perform x,y on bar and y,z on bas.
Compliance & Monitoring
Note
At a glance:
- Compliance is a continuous activity
- Monitor and look for anomalies
Compliance is typically something people refer to when looking at certain accreditations like PCI, HIPAA, etc. However this extends further into ensure compliance with any hardening guide or standards that have been set. For example, the STIG is a sample hardening baseline, however each company may have additional policies / rules in place. In order to ensure a secure system, we must make sure our systems meet these policies and are in a compliant state.
Traditionally compliance is checked retroactively and is a fairly manual process. We believe this is absolutely the wrong approach. Compliance is something we must constantly ensure as that’s the only way we can make sure we limit any potential threat vectors, or close any that may have been opened.
Tools that handle configuration management automation (aka desired state configuration - DSC) are a critical piece here. These will ensure our configuration / settings is always set to our baseline or desired state.
Monitoring and penetration testing are critical to validate and ensure this compliance. Tools like Nessus, Nmap or metasploit can be used to to test the security of a system. During these tests monitoring and detection systems should detect these and alert.
People
Note
At a glance:
- Educate, educate, educate
- Enforce strong practices and habits (e.g. locking computer)
In any system, the people are traditionally the weakest link. In order to ensure users aren’t prone to phishing attacks or social manipulation, training and education is critical. We must ensure that users know what to look for, and to escalate to a known resource if they are unsure.
One method of education is actually simulating phishing attacks so they can start to question things and learn what to look for. We must also enforce other policies like not leaving their computer unlocked or writing down their passwords.
Certifications & Accreditations
Nutanix has the following security certifications / qualifications across portions of the stack (on and off premise):
- Common Criteria*
- Common Criteria was produced predominantly so that companies selling computer products for the government market (mainly for Defense or Intelligence use) would only need to have them evaluated against one set of standards. The CC was developed by the governments of Canada, France, Germany, the Netherlands, the UK, and the U.S.
- *This is currently under re-certification as of March 2020
- Security Technical Implementation Guides (STIGs)
- Configuration standards for DOD IA and IA-enabled devices/systems. Since 1998, DISA Field Security Operations (FSO) has played a critical role enhancing the security posture of DoD’s (Dept of Defense) security systems by providing the Security Technical Implementation Guides. The STIGs contain technical guidance to “lock down” information systems/software that might otherwise be vulnerable to a malicious computer attack.
- FIPS 140-2
- FIPS 140-2 standard is an information technology security accreditation program for cryptographic modules produced by private sector vendors who seek to have their products certified for use in government departments and regulated industries (such as financial and health-care institutions) that collect, store, transfer, share and disseminate sensitive but unclassified (SBU) information.
- NIST 800-53
- NIST 800-131a
- ISO 27001
- ISO 27017
- ISO 27018
Security Configuration Management Automation (SCMA)
Nutanix Security engineering now provides customers with the ability to evolve from point-in-time security baseline checking to a continuous monitoring/self-remediating baseline to ensure all CVM/AHV hosts in a cluster remain baseline compliant throughout the deployment lifecycle. This new innovation checks all components of the documented security baselines (STIGs) , and if found to be non-compliant, sets it back to the supported security settings without customer intervention. SCMA is enabled by default so no action is necessary to enable.
Note
Ad-hoc SCMA execution
The SCMA will run on the configured schedule (Default: HOURLY), however it is also possible to run this on-demand. To run the SCMA tool you can execute the following command from the CVM(s):
###### Run on a single CVMsudo salt-call state.highstate###### Run on all CVMs
allssh "sudo salt-call state.highstate"
The Nutanix Command Line Interface (NCLI) allows customers to control various configuration settings to enable more stringent security requirements.
CVM Security Settings
The following commands have been added to NCLI to support cluster-wide configuration of the SCMA policy. The list below gives all commands and functions:
Get CVM security settings
ncli cluster get-cvm-security-config
This command outputs the current cluster configuration. The default output will display:
Enable Aide : false
Enable Core : false
Enable High Strength P... : false
Enable Banner : false
Enable SNMPv3 Only : false
Schedule : DAILY
Each of these is defined below:
- Aide
- Enables the ‘Advanced Intrusion Detection Environment’ to periodically run.
- Core
- Generates stack traces when there’s an issue or SCMA is unable to remediate.
- High Strength Passwords
- Enforces high strength passwords (minlen=15,difok=8,remember=24)
- Banner
- Enables a custom login banner
- SNMPv3 Only
- Forces SNMPv3 instead of v2
Set CVM login banner
This command enables or disables the Department of Defense (DoD) knowledge of consent login banner when logging in to any Nutanix CVM.
ncli cluster edit-cvm-security-params enable-banner=[yes|no] #Default:no
Note
Custom login banner
By default the DoD knowledge of consent login banner is used. To utilize a custom banner follow the following steps (run as the Nutanix user on any CVM):
-
Create backup of existing banner
- sudo cp -a /srv/salt/security/KVM/sshd/DODbanner /srv/salt/security/KVM/sshd/DODbannerbak
- Use vi to modify existing banner
- sudo vi /srv/salt/security/KVM/sshd/DODbanner
- Repeat steps on every CVM or SCP modified banner to all other CVMs
- Enable banner using command above
Set CVM password strength
This command enables or disables high-strength password policies (minlen=15,difok=8,remember=24).
ncli cluster edit-cvm-security-params enable-high-strength-password=[yes|no] #Default:no
Set Advanced Intrusion Detection Environment (AIDE)
This command enables or disables the AIDE service to run weekly.
ncli cluster edit-cvm-security-params enable-aide=true=[yes|no] #Default:no
Set SNMPv3 only
This command enables or disables SNMPv3 only traps.
ncli cluster edit-cvm-security-params enable-snmpv3-only=[true|false] #Default:false
Set SCMA schedule
This command sets the frequency at which SCMA runs.
ncli cluster edit-cvm-security-params schedule=[HOURLY|DAILY|WEEKLY|MONTHLY] #Default:HOURLY
Hypervisor Security Settings
The following commands have been added to NCLI to support cluster-wide configuration of the SCMA policy. The list below gives all commands and functions:
Get hypervisor security settings
ncli cluster get-hypervisor-security-config
This command outputs the current cluster configuration. The default output will display:
Enable Aide : false
Enable Core : false
Enable High Strength P... : false
Enable Banner : false
Schedule : DAILY
Set hypervisor login banner
This command enables or disables the Department of Defense (DoD) knowledge of consent login banner when loging in to any Nutanix hypervisor.
ncli cluster edit-hypervisor-security-params enable-banner=[yes|no] #Default:no
Set hypervisor password strength
This command enables or disables high-strength password policies (minlen=15,difok=8,remember=24).
ncli cluster edit-hypervisor-security-params enable-high-strength-password=[yes|no] #Default:no
Set Advanced Intrusion Detection Environment (AIDE)
This command enables or disables the AIDE service to run weekly.
ncli cluster edit-hypervisor-security-params enable-aide=true=[yes|no] #Default:no
Set SCMA schedule
This command sets the frequency at which SCMA runs.
ncli cluster edit-hypervisor-security-params schedule=[HOURLY|DAILY|WEEKLY|MONTHLY] #Default:HOURLY
Cluster Lockdown
Cluster lockdown is the ability to disable password based CVM access and/or only allow key based access.
The cluster lockdown configuration can be found in Prism under the gear menu:
 Cluster Lockdown Menu
This will show the current configuration and allow you to add/remove SSH keys for access:
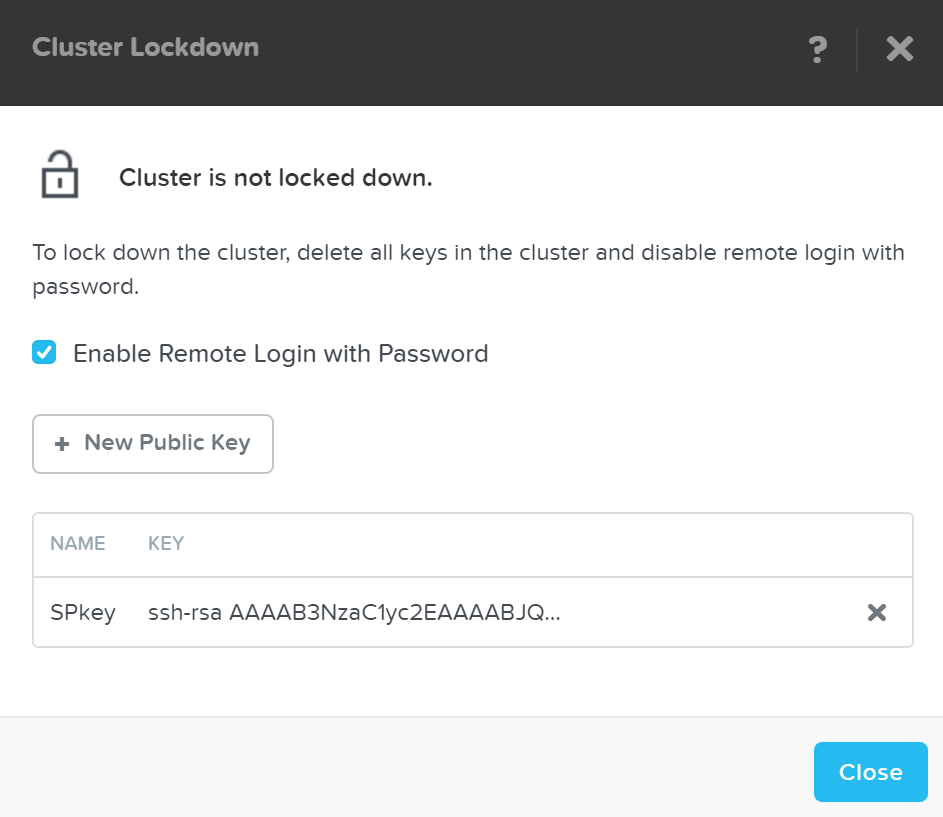 Cluster Lockdown Page
To add a new key click on the ‘New Public Key’ button and enter the public key details:
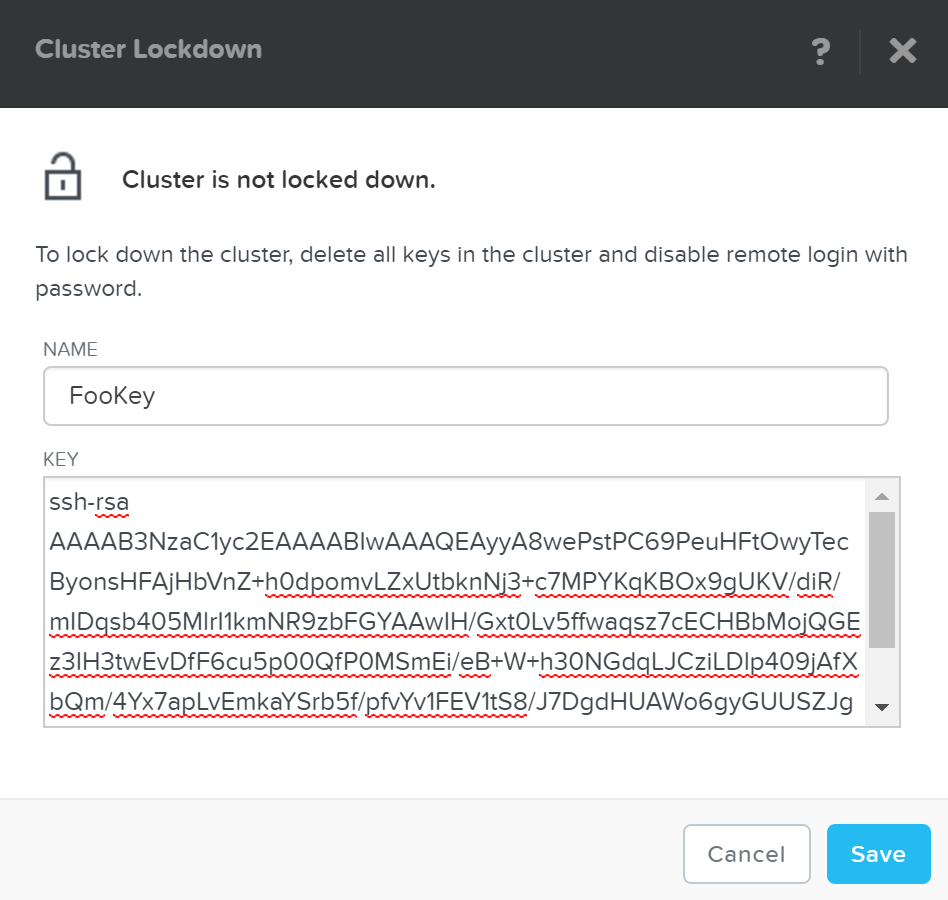 Cluster Lockdown - Add Key
Note
Working with SSH keys
To generate a SSH key, run the following command:
ssh-keygen -t rsa -b 2048
This will generate the key pair which creates two files:
- id_rsa (private key)
- id_rsa.pub (public key - this one is used when adding a key to the cluster)
Once you’ve added some key(s) and have validated access with them, you can disable password based login, by un-checking ‘Enable Remote Login with Password.’ A popup will appear to confirm the action, click ‘Ok’ to proceed with lockdown.
Note
Disabling SSH Bash Shell Access
In AOS 7.3 Nutanix introduced support for disabling Bash shell SSH access. This helps to reduce the attack surface and disables external SSH access to the CVM and AHV with Bash. For any internal traffic (ie: CVM to CVM or Host to CVM) where SSH might be needed by internal services or processes, port 22 is routed through an envoy proxy. This routing adjustment is done automatically as part of disabling SSH access.
For more information, visit the official SSH Bash Shell Access FAQ KB-20212.
Data Encryption and Key Management
Data encryption is a method that allows parties to encode data in a manner that only those who are authorized can make sense of the data, making it unintelligible for anyone who is unauthorized.
For example, if a message needs to be sent to one person and one person only, the message (plaintext) can be encrypted with a cipher (key) and send them the encrypted message (ciphertext). If this message is stolen or intercepted the attacker can only see the ciphertext which is mostly useless without having the cipher to decipher the message. Once the desired party has received the message they can decrypt the message using the key we have given them.
There are a few main methods of encrypting data:
- Symmetric Encryption (private key encryption):
- The same key is used to both encrypt and decrypt data
- Examples: AES, PGP*, Blowfish, Twofish, etc.
- Asymmetric Encryption (public key encryption):
- One key is used for encryption (public key), another is used for decryption (private key)
- Examples: RSA, PGP*, etc.
NOTE: PGP (or GPG) uses both a symmetric and asymmetric key.
When data encryption is talked about it is normally done so in two main contexts:
- In-transit: data that is in transit between two parties (e.g. sending data over the network)
- At-rest: static data (e.g. data that is stored on a device)
With Native software-based encryption (with or without SEDs) Nutanix solves for both in-transit* and at-rest encryption. With SED only based encryption Nutanix solves for at-rest data encryption. *NOTE: In-transit encryption is currently applicable within a Nutanix cluster for data RF.
The following sections will describe how Nutanix manages data encryption and its key management options.
Data Encryption
Nutanix provides data encryption via three main options:
- Native software-based encryption (FIPS-140-2 Level-1) *released in 5.5
- Using self-encrypting drives (SED) (FIPS-140-2 Level-2)
- Software + hardware encryption
This encryption is configured at either the cluster or container level, and is dependent on the hypervisor type:
- Cluster level encryption:
- AHV, ESXi, Hyper-V
- Container level encryption:
- ESXi, Hyper-V
NOTE: for deployments using SED based encryption, this will be cluster level as the physical devices are encrypted themselves.
You can view the encryption state of the cluster by navigating to ‘Data-at-Rest Encryption’ in the settings menu (gear icon). This will provide the current status and allow you to configure encryption (if not currently enabled).
In this example we can see that encryption is enabled at the cluster level:
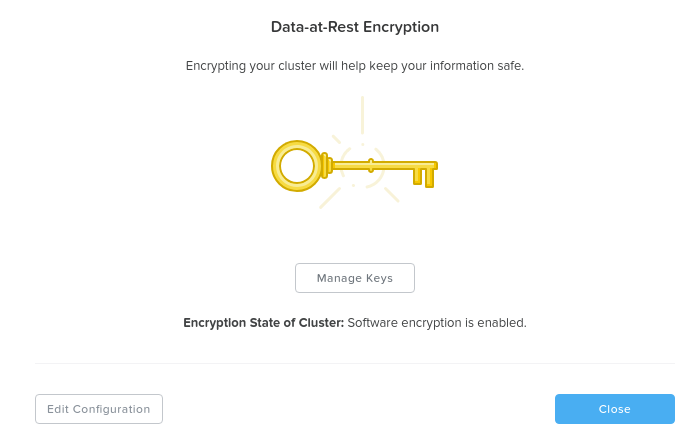 Data Encryption - Enabled (cluster level)
In this example encryption is enabled for particular containers which are listed:
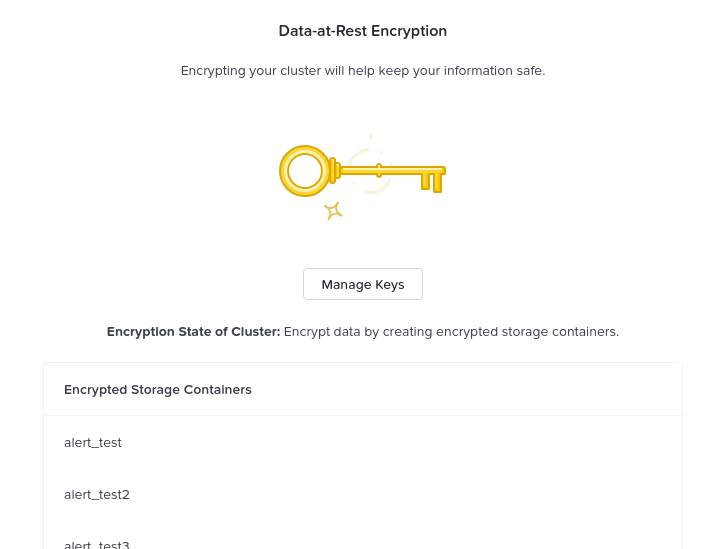 Data Encryption - Enabled (container level)
You can enable / modify the configuration by clicking the ‘edit configuration’ button. This will bring up the menu to configure the KMS used for encryption or the type of KMS currently being leveraged:
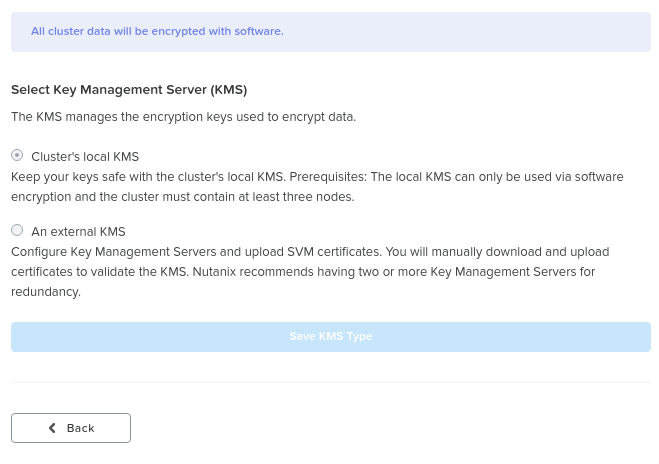 Data Encryption - Configure
For external KMS the menus will guide your through the CSR request process which you can then give to your CA for signing.
Native Software-based Encryption
Nutanix software encryption provides native AES-256 data-at-rest encryption. This can either interact with any KMIP or TCG compliant external KMS server (Vormetric, SafeNet, etc.) or the Nutanix native KMS introduced in 5.8 (more on this below). For encryption / decryption the system leverages the Intel AES-NI acceleration to minimize any potential performance impact of doing this in software.
As data is written (OpLog and Extent Store) the data is encrypted before it is written to disk at the checksum boundary. This also means that data is encrypted locally and then the encrypted data is replicated to the remote CVM(s) for RF.
Encryption is the last transform applied to data before it is written to disk:
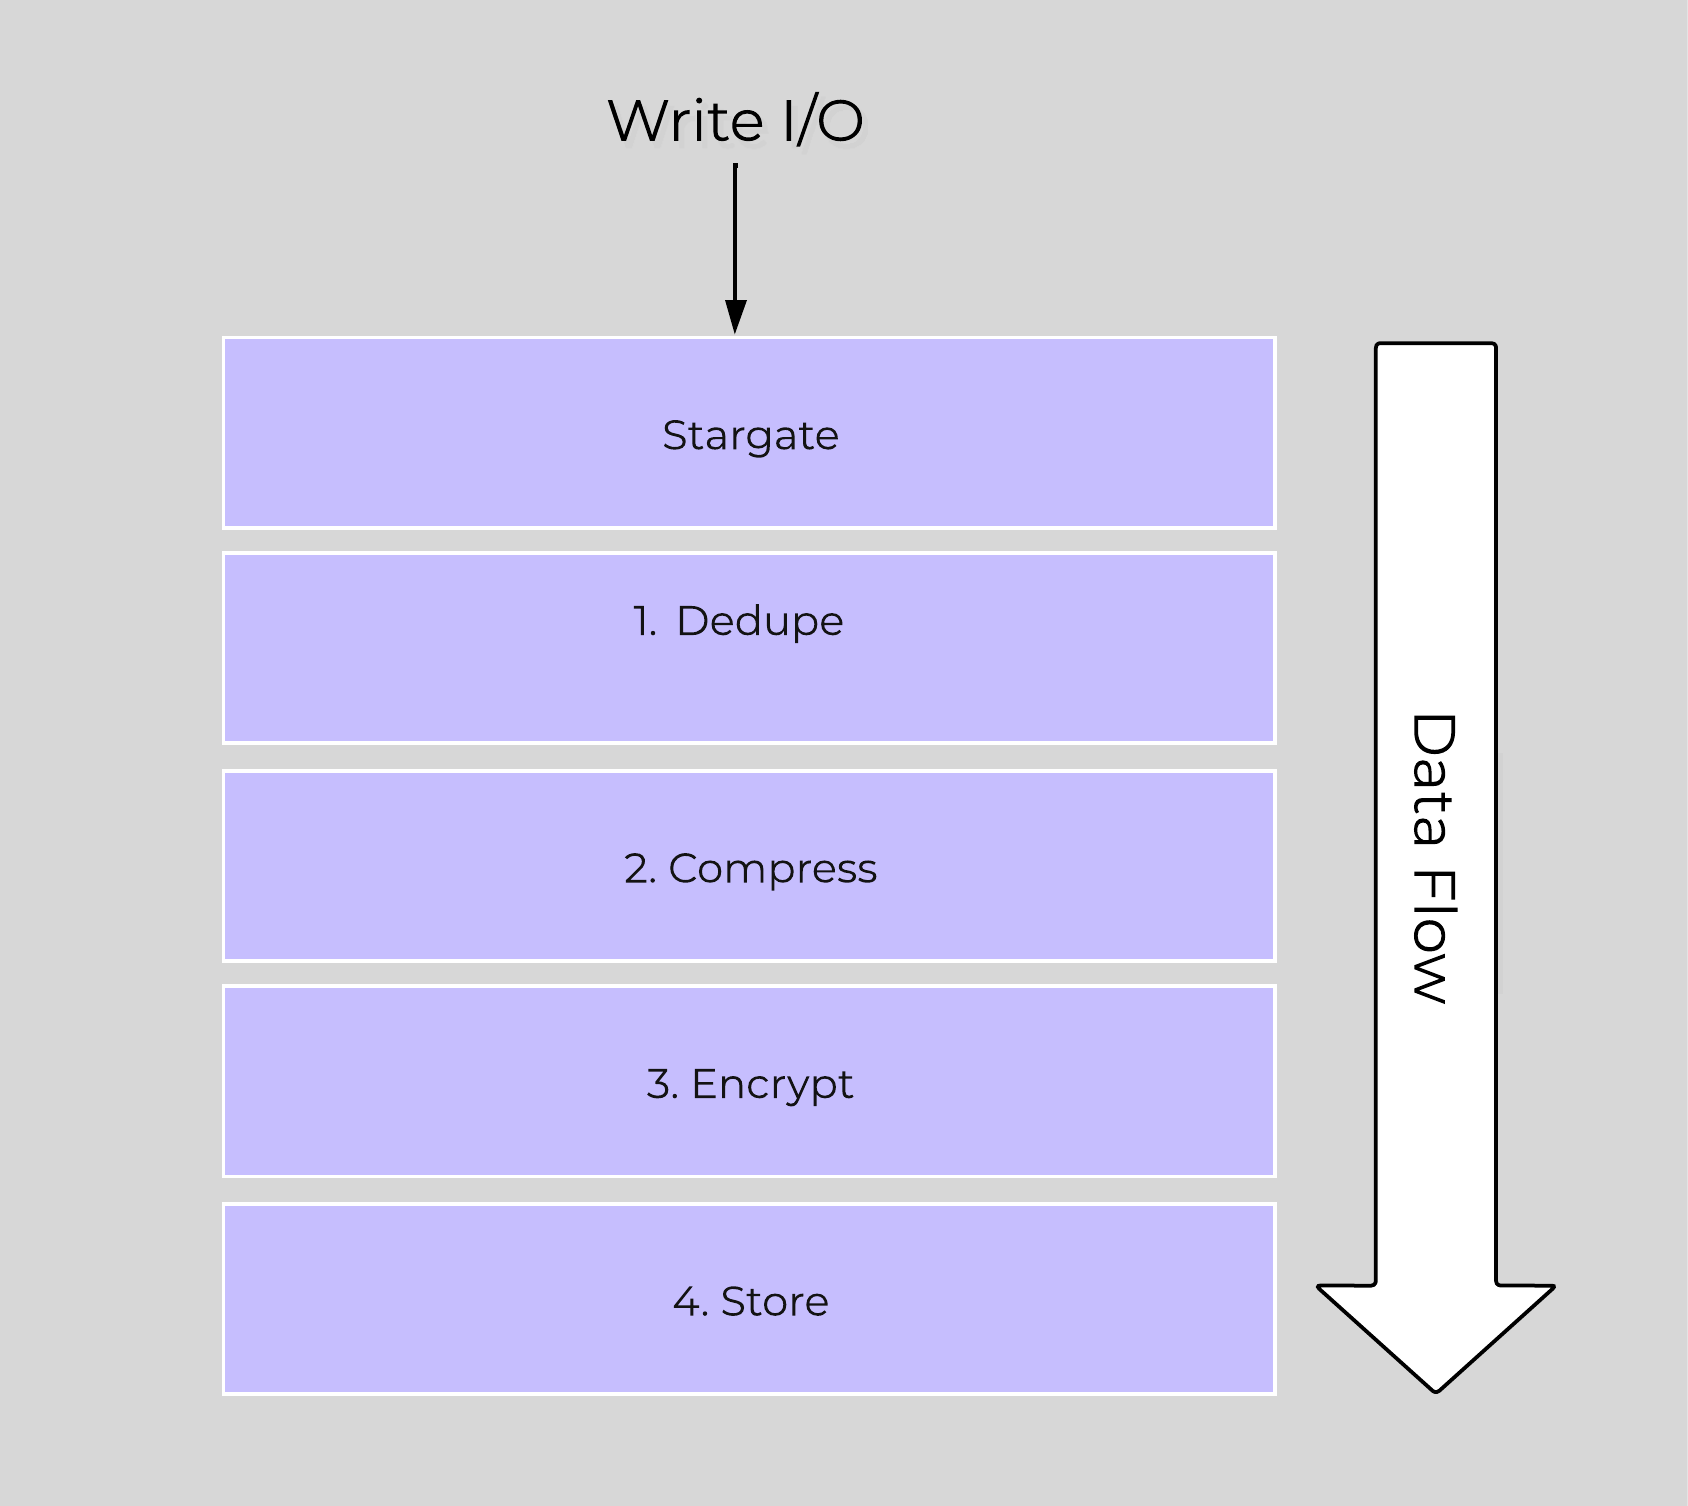 Data Encryption - Transform Application
Note
Encryption and Data Efficiency
Since we encrypt the data after we've applied any deduplication or compression, we ensure that all space savings from those methods are maintained. Put simply, deduplication and compression ratios will be the exact same for encrypted or non-encrypted data.
When data is read we will read the encrypted data from disk at the checksum boundary, decrypt and return the data to the guest. By doing [de/en]cryption at the checksum boundary we ensure no read amplification occurs. Given we are leveraging the Intel AES NI offload, we’ve seen very little impact to performance / latency.
SED Based Encryption
The figure shows a high-level overview of the architecture:
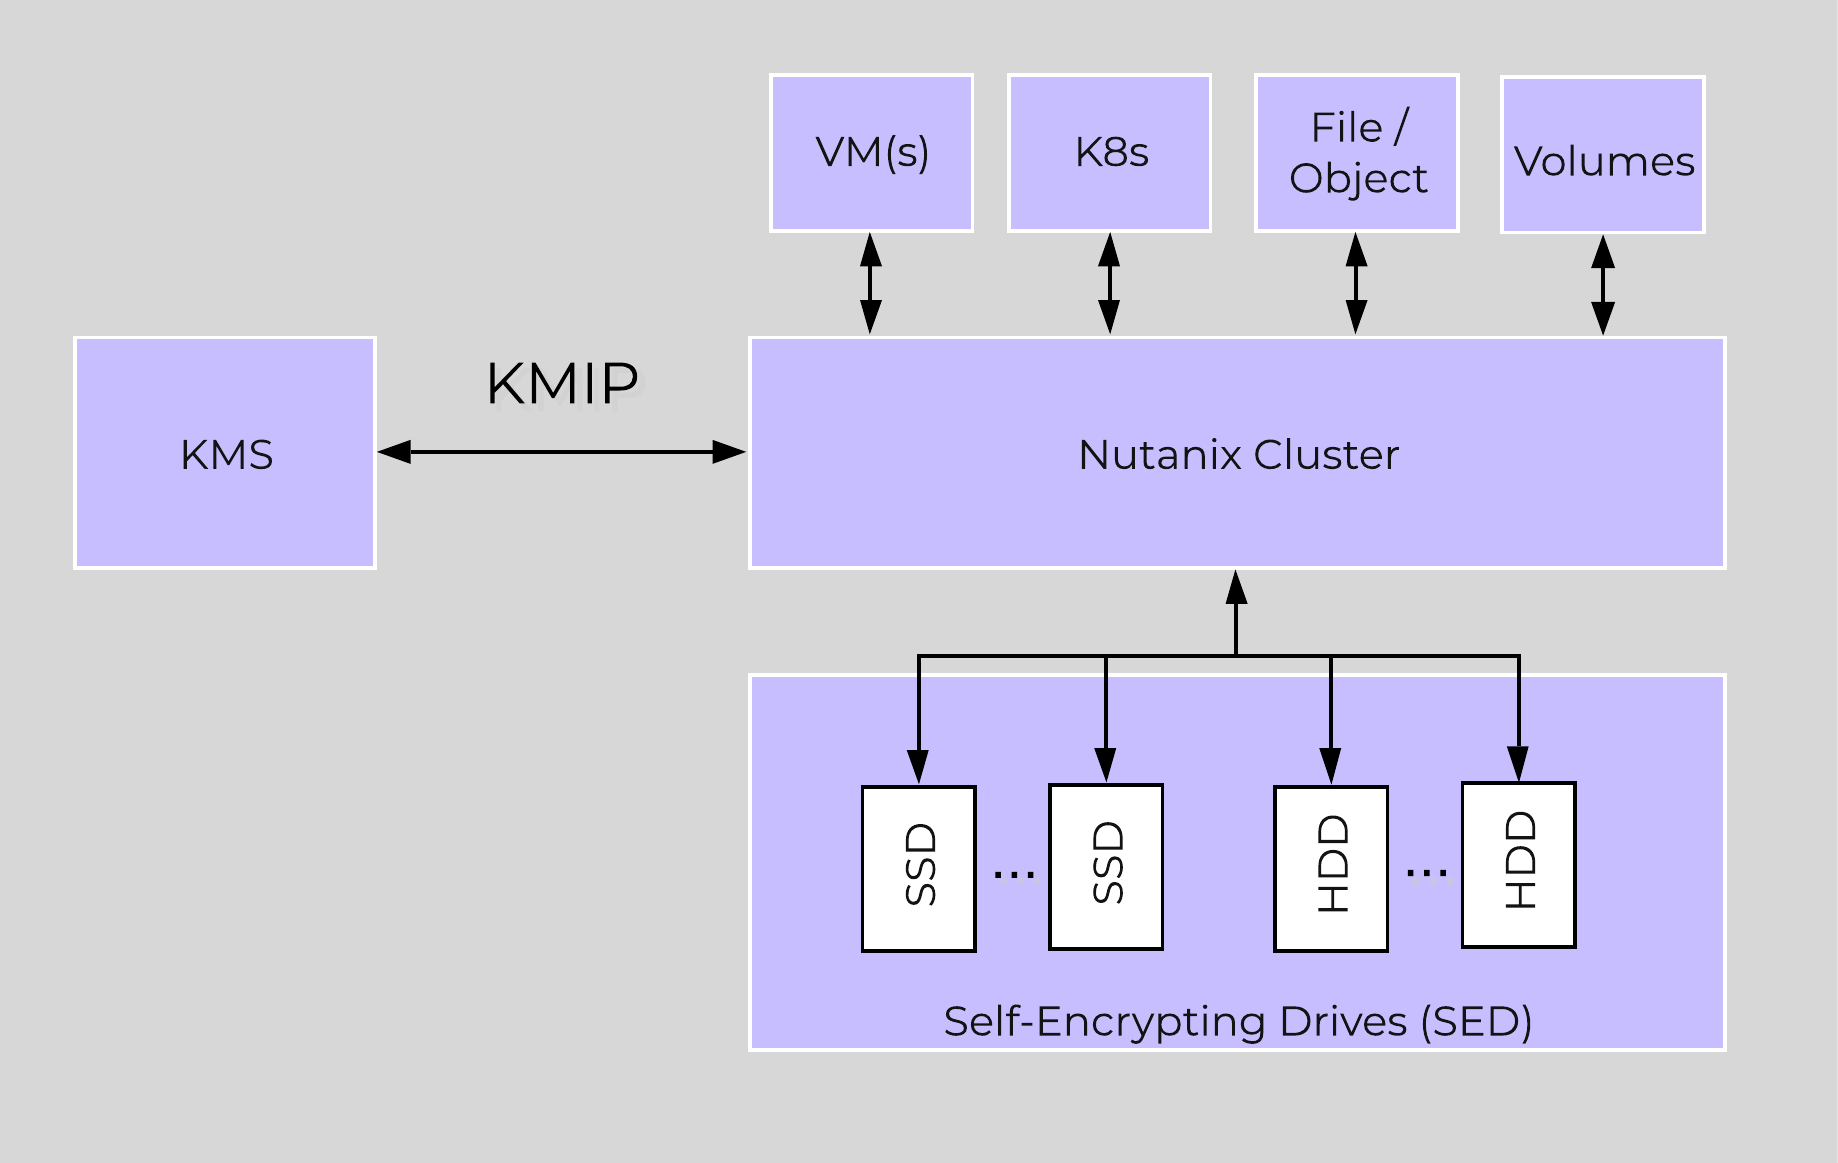 Data Encryption - SED
SED encryption works by splitting the storage device into “data bands” which can be in an secured or un-secured state. In the case of Nutanix, the boot and Nutanix Home partitions are trivially encrypted. All data devices and bands are heavily encrypted with big keys to level-2 standards.
When the cluster starts it will call out to the KMS server to get the keys to unlock the drives. In order to ensure security no keys are cached on the cluster. In the event of a cold boot and IPMI reset, the node will need to make a call back to the KMS server to unlock the drives. Soft reboots of the CVM will not force this to occur.
Key Management (KMS)
Nutanix provides native key management (local key manager - LKM) and storage capabilities (introduced in 5.8) as an alternative to other dedicated KMS solutions. This was introduced to negate the need for a dedicated KMS solution and simplify the environment, however external KMS are still supported.
As mentioned in the prior section, key management is a very crucial piece of any data encryption solution. Multiple keys are used throughout the stack to provide a very secure key management solution.
There are three types of keys used in the solution:
- Data Encryption Key (DEK)
- Key used to encrypt the data
- Key Encryption Key (KEK)
- Encryption key used to encrypt the DEK
- Master Encryption Key (MEK)
- Encryption key used to encrypt the KEK
- Only applicable when using the Local Key Manager
The following figure shows the relationships between the various keys and KMS options:
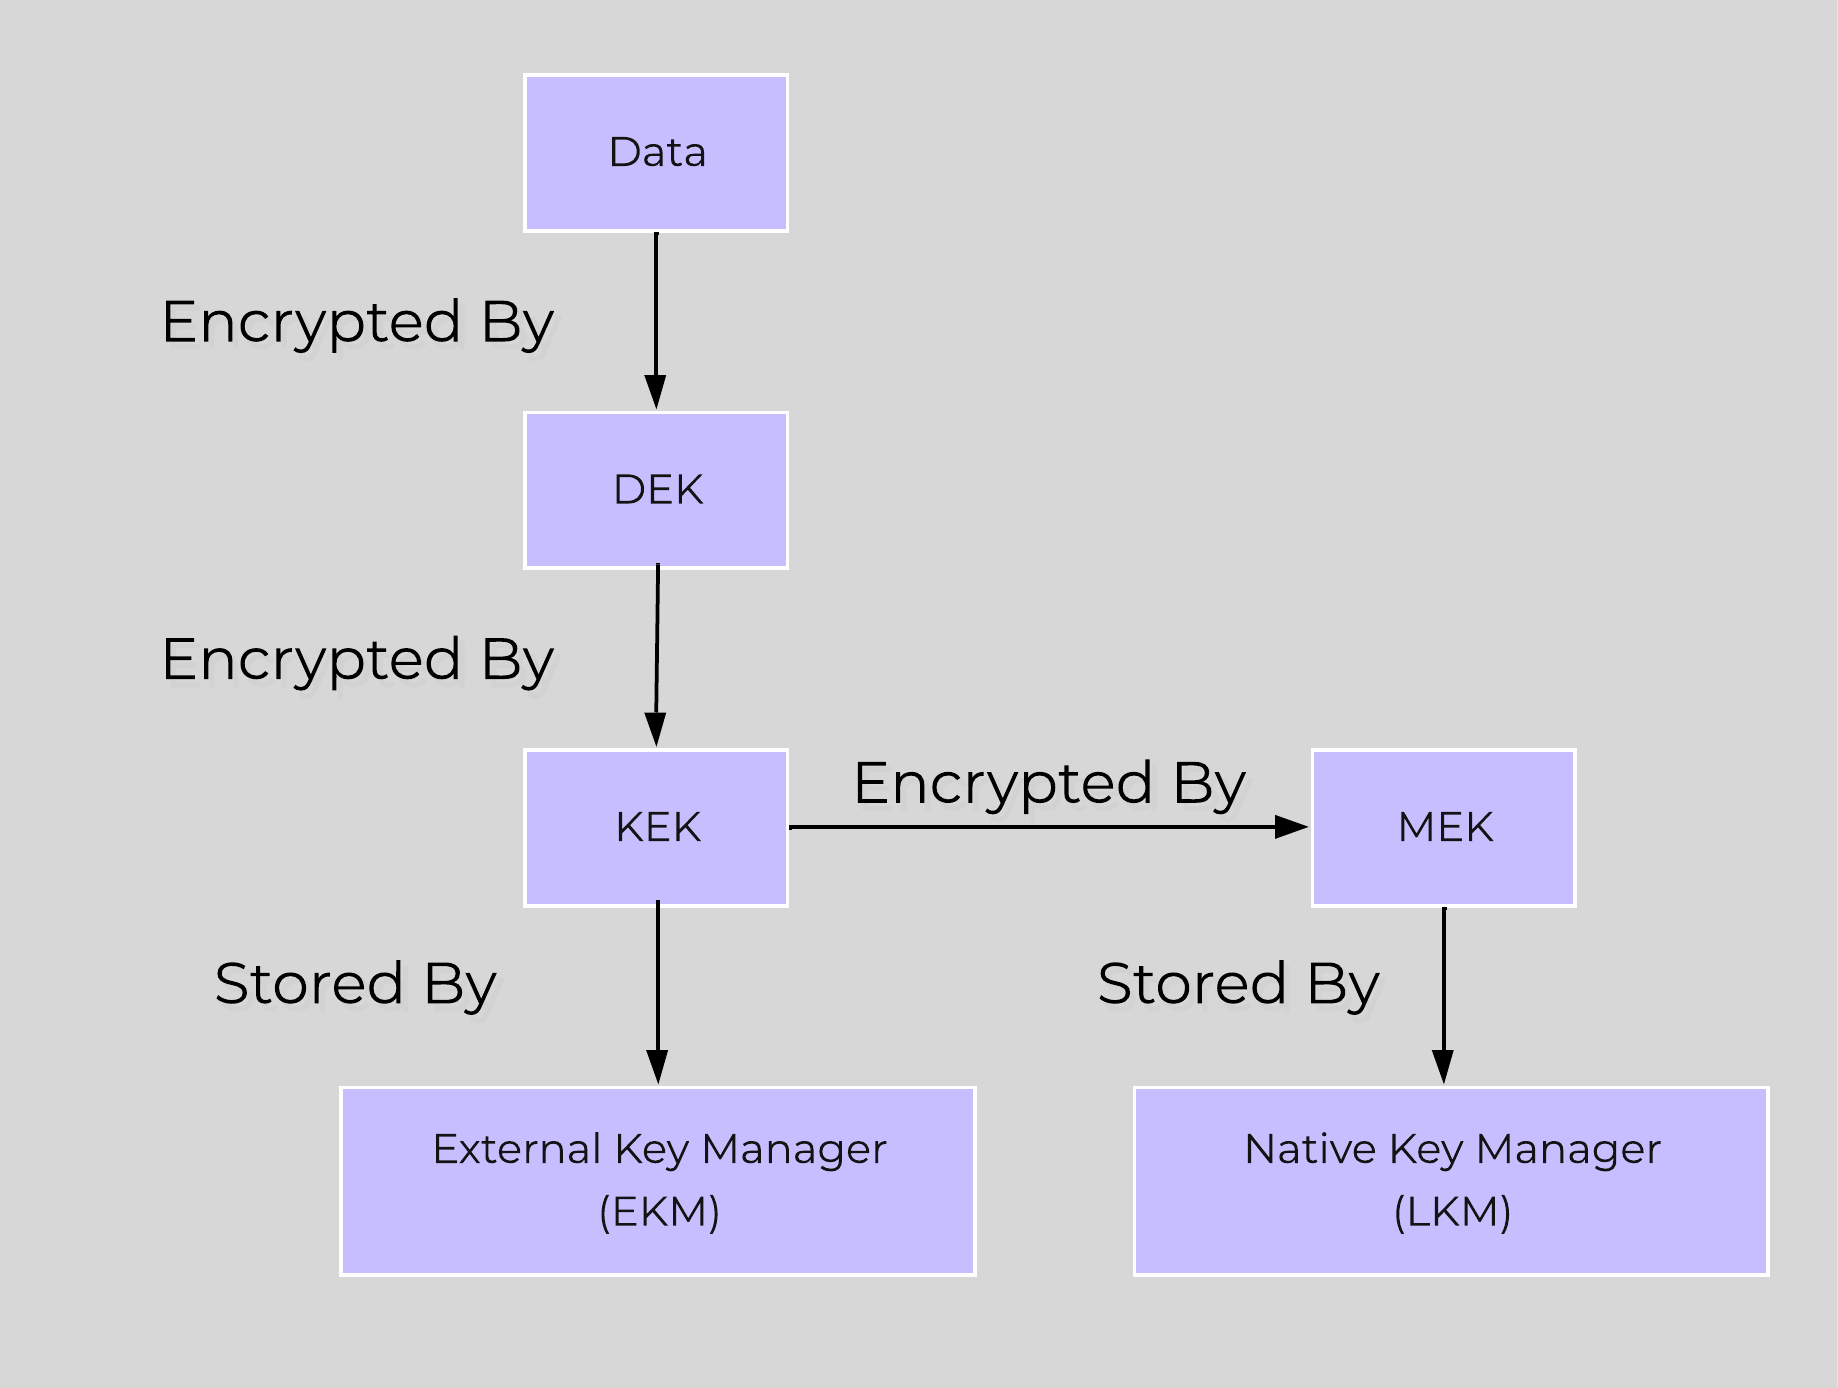 Data Encryption - Key Management
The local key manager (LKM) service is distributed among every Nutanix node and runs natively on each CVM. The service uses a FIPS 140-2 Crypto module (under certification), and key management is transparent to the end-user besides doing any key management activities (e.g. re-key, backup keys, etc.).
When configuring data encryption, the native KMS can be leveraged by selecting ‘Cluster’s local KMS’:
Data Encryption - Configure
The master key (MEK) is split and stored across all nodes in the cluster leveraging Shamir’s Secret Sharing algorithm to allow for resiliency and security. A minimum of ROUNDUP(N/2) nodes must be available to re-construct the keys, where N = number of nodes in the cluster.
Note
Key Backups and Key Rotation
Once encryption has been enabled, it is recommended to take a backup of the data encryption key(s) (DEK). If a backup is taken, it must be secured with a strong password and stored in a secure location.
The system provides the ability to rotate (re-key) both the KEK and MEK. It automatically rotates the master key (MEK) every year, however, this operation can also be done on demand. In the event of a node add/remove, we also rotate the master key.
» Download this section as PDF (opens in a new tab/window)
Nutanix Guest Tools (NGT)
Nutanix Guest Tools (NGT) is a software-based in-guest agent framework that enables advanced VM management functionality through the Nutanix Platform.
The solution is composed of the NGT installer which is installed on the VMs and the Guest Tools Framework which is used for coordination between the agent and Nutanix platform.
The NGT installer contains the following components:
- Guest Agent Service
- Self-service Restore (SSR) aka File-level Restore (FLR) CLI
- VM Mobility Drivers (VirtIO drivers for AHV)
- VSS Agent and Hardware Provider for Windows VMs
- App Consistent snapshot support for Linux VMs (via scripts to quiesce)
This framework is composed of a few high-level components:
- Guest Tools Service
- Gateway between the AOS and Nutanix services and the Guest Agent. Distributed across CVMs within the cluster with an elected NGT Leader which runs on the current Prism Leader (hosting cluster VIP)
- Guest Agent
- Agent and associated services deployed in the VM’s OS as part of the NGT installation process. Handles any local functions such as VSS and Self-service Restore (SSR) and interacts with the Guest Tools Service.
The following figure shows the high-level mapping of the components:
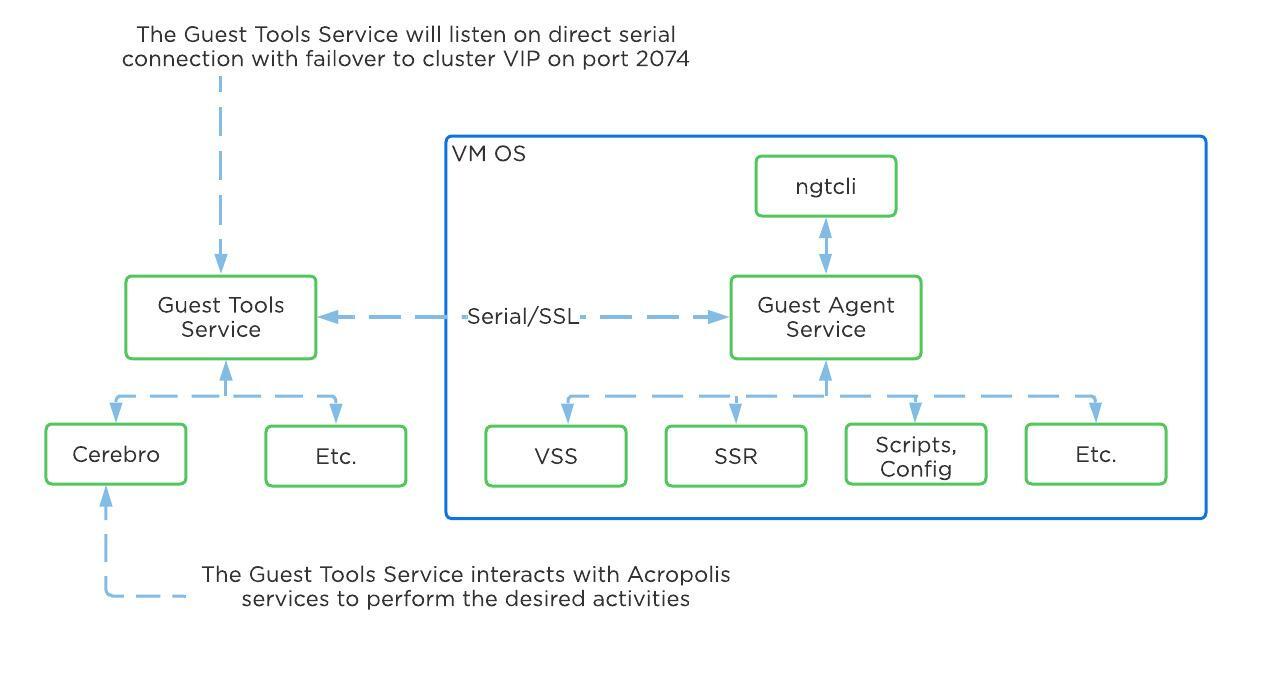 Guest Tools Mapping
Guest Tools Service
The Guest Tools Service is composed of two main roles:
- NGT Leader
- Handles requests coming from NGT Proxy and interfaces with AOS components. A single NGT Leader is dynamically elected per cluster; in the event the current leader fails a new one will be elected. The service listens internally on port 2073.
- NGT Proxy
- Runs on every CVM and will forward requests to the NGT Leader to perform the desired activity. The current VM acting as the Prism Leader (hosting the VIP) will be the active CVM handling communication from the Guest Agent. Listens externally on port 2074.
Note
Current NGT Leader
You can find the IP of the CVM hosting the NGT Leader role with the following command (run on any CVM):
nutanix_guest_tools_cli get_leader_location
The figure shows the high-level mapping of the roles:
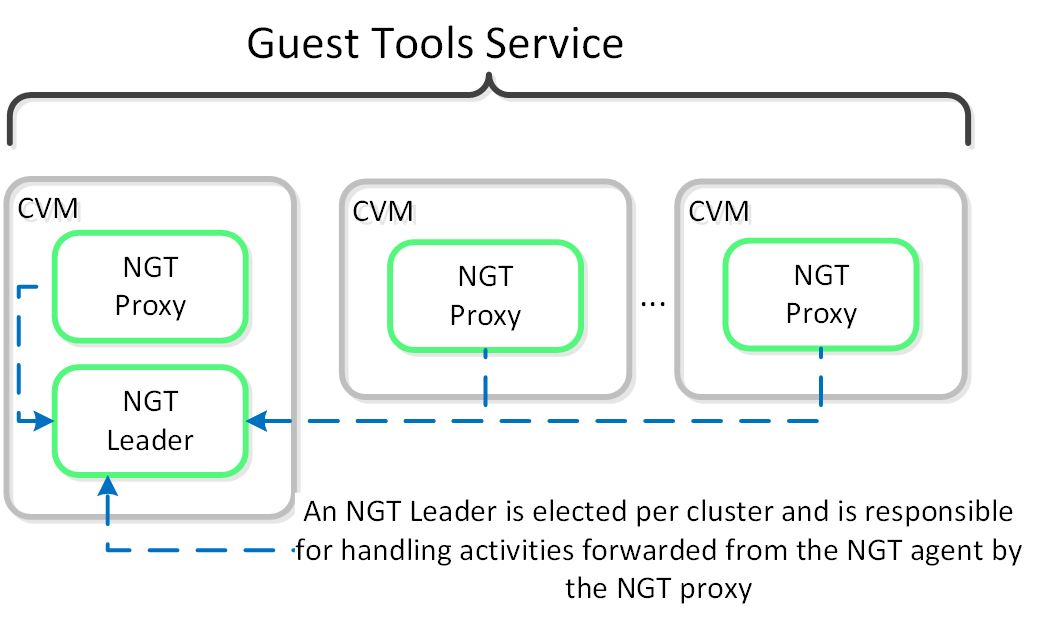 Guest Tools Service
Guest Agent
The Guest Agent is composed of the following high-level components as mentioned prior:
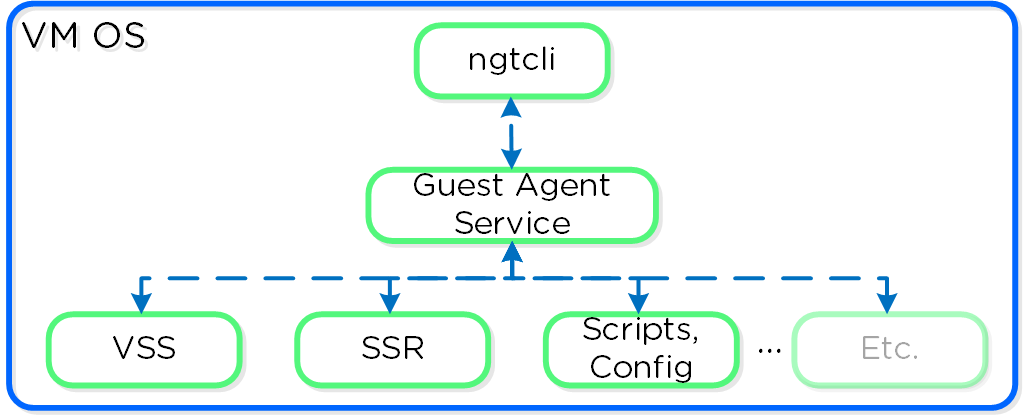 Guest Agent
Communication and Security
The Guest Agent Service communicates with the Guest Tools Service via a serial port connection from VM to the CVM. If the service is unable to reach the CVM via serial port it will fail back to a network connection to the Nutanix Cluster VIP using SSL. For deployments where the Nutanix cluster components and UVMs are on a different network (hopefully all), ensure that the following are possible to allow this fallback communication method:
- Ensure routed communication from UVM network(s) to Cluster VIP
OR
- Create a firewall rule (and associated NAT) from UVM network(s) allowing communication with the Cluster VIP on port 2074 (preferred)
The Guest Tools Service acts as a Certificate Authority (CA) and is responsible for generating certificate pairs for each NGT-enabled UVM. This certificate is embedded into the ISO which is configured for the UVM and used as part of the NGT deployment process. These certificates are installed inside the UVM as part of the installation process.
NGT Agent Installation
NGT Agent installation can be performed via Prism, install packages, or CLI and scripts such as nCLI, REST, or PowerShell. The install packages are available in .exe (Windows), .rpm and .deb (Linux) formats and are available on the Nutanix support portal. These installers can be installed manually, via scripts, or 3rd party tools. The 3rd party tool method enables NGT installation at scale utilizing existing tools.
Note
Bulk NGT Deployment
Rather than installing NGT on each VM, you can use the install packages mentioned earlier or embed and deploy NGT in your base image. Use the NGT Bulk Install instructions for packaged deployment.
Use the following process to leverage NGT inside a base image:
- Install NGT on a template VM and ensure communication with CVM
- Clone VMs from the template VM
-
Mount NGT ISO on each clone (required to get new certificate pair)
- Example: ncli ngt mount vm-id=<CLONE_ID> OR via Prism
- Power on clones
When the cloned VM is booted, it will detect the new NGT ISO, copy relevant configuration files and new certificates, and start communicating with the Guest Tools Service.
OS Customization
Nutanix provides native OS customization capabilities leveraging CloudInit and Sysprep. CloudInit is a package which handles bootstrapping of Linux cloud servers. This allows for the early initialization and customization of a Linux instance. Sysprep is a OS customization for Windows.
Some typical uses include:
- Setting Hostname
- Installing packages
- Adding users / key management
- Custom scripts
Supported Configurations
The solution is applicable to Linux guests running on AHV, including versions below (list may be incomplete, refer to documentation for a fully supported list):
- Hypervisors:
- AHV
- Operating Systems:
- Linux - most modern distributions
- Windows - most modern distributions
Pre-Requisites
In order for CloudInit to be used the following are necessary:
- CloudInit package must be installed in Linux image
Sysprep is available by default in Windows installations.
Package Installation
CloudInit can be installed (if not already) using the following commands:
Red Hat Based Systems (CentOS, RHEL)
yum -y install CloudInit
Debian Based Systems (Ubuntu)
apt-get -y update; apt-get -y install CloudInit
Sysprep is part of the base Windows installation.
Image Customization
To leverage a custom script for OS customization, a check box and inputs is available in Prism or the REST API. This option is specified during the VM creation or cloning process:
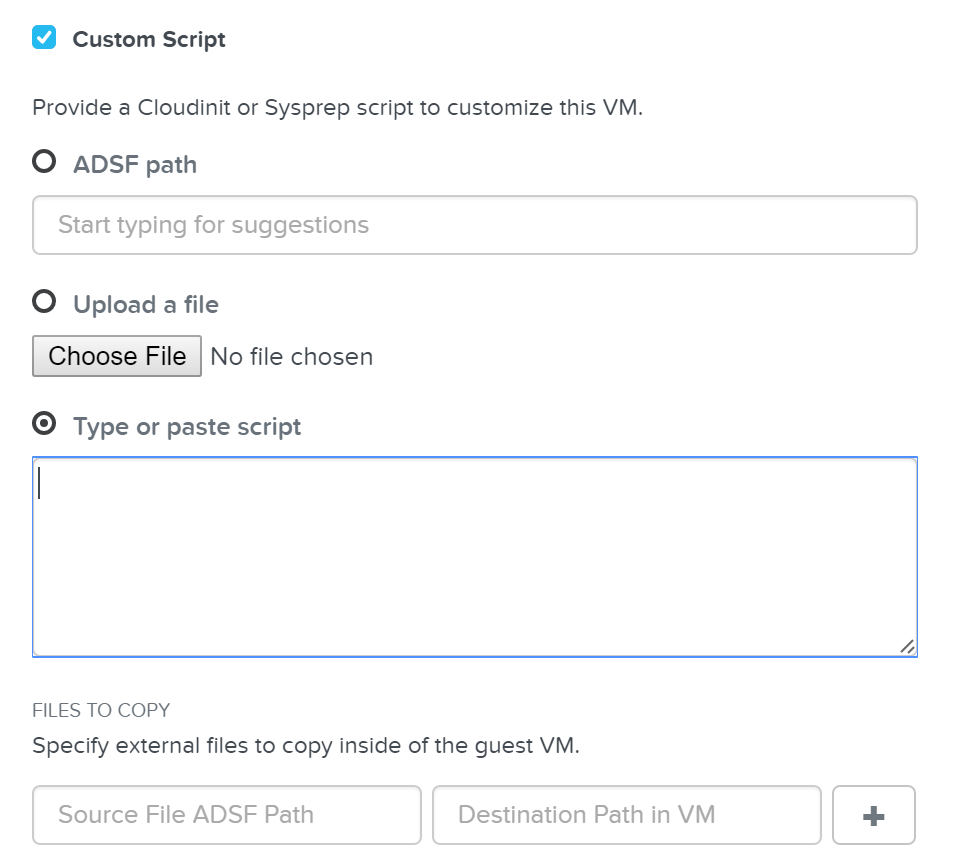 Custom Script - Input Options
Nutanix has a few options for specifying the custom script path:
- ADSF Path
- Use a file which has been previously upload to ADSF
- Upload a file
- Upload a file which will be used
- Type or paste script
- CloudInit script or Unattend.xml text
Nutanix passes the user data script to CloudInit or Sysprep process during first boot by creating a CD-ROM which contains the script. Once the process is complete we will remove the CD-ROM.
Input formatting
The platform supports a good amount of user data input formats. Some of the key formats are outlined below:
User-Data Script (CloudInit - Linux)
A user-data script is a simple shell script that will be executed very late in the boot process (e.g. “rc.local-like”).
The scripts will begin similar to any bash script: “#!”.
Below we show an example user-data script:
#!/bin/bash
touch /tmp/fooTest
mkdir /tmp/barFolder
Include File (CloudInit - Linux)
The include file contains a list of urls (one per line). Each of the URLs will be read and they will be processed similar to any other script.
The scripts will begin with: “#include”.
Below we show an example include script:
#include
http://s3.amazonaws.com/path/to/script/1
http://s3.amazonaws.com/path/to/script/2
Cloud Config Data (CloudInit - Linux)
The cloud-config input type is the most common and specific to CloudInit.
The scripts will begin with: “#cloud-config”
Below we show an example cloud config data script:
#cloud-config

# Set hostname
hostname: foobar

# Add user(s)
users:
 - name: nutanix
 sudo: ['ALL=(ALL) NOPASSWD:ALL']
 ssh-authorized-keys:
 - ssh-rsa: PUBKEY
 lock-passwd: false
 passwd: PASSWORD

# Automatically update all of the packages
package_upgrade: true
package_reboot_if_required: true

# Install the LAMP stack
packages:
 - httpd
 - mariadb-server
 - php
 - php-pear
 - php-mysql

# Run Commands after execution
runcmd:
 - systemctl enable httpd
Note
Validating CloudInit Execution
CloudInit log files can be found in /var/log/cloud-init.log and cloud-init-output.log.
Unattend.xml (Sysprep - Windows)
The unattend.xml file is the input file Sysprep uses for image customization on boot, you can read more here: LINK
The scripts will begin with: “<?xml version=”1.0” ?>”.
Attached is an example unattend.xml file
Karbon (Container Services)
Nutanix provides the ability to leverage persistent containers on the Nutanix platform using Kubernetes (currently). It was previously possible to run Docker on Nutanix platform; however, data persistence was an issue given the ephemeral nature of containers.
Container technologies like Docker are a different approach to hardware virtualization. With traditional virtualization each VM has its own Operating System (OS) but they share the underlying hardware. Containers, which include the application and all its dependencies, run as isolated processes that share the underlying Operating System (OS) kernel.
The following table shows a simple comparison between VMs and Containers:
| Metric | Virtual Machines (VM) | Containers |
|---|---|---|
| Virtualization Type | Hardware-level virtualization | OS kernel virtualization |
| Overhead | Heavyweight | Lightweight |
| Provisioning Speed | Slower (seconds to minutes) | Real-time / fast (us to ms) |
| Performance Overhead | Limited performance | Native performance |
| Security | Fully isolated (more secure) | Process-level isolation (less secure) |
Supported Configurations
The solution is applicable to the configurations below (list may be incomplete, refer to documentation for a fully supported list):
Hypervisor(s):
- AHV
Container System(s)*:
- Docker 1.13
*As of 4.7, the solution only supports storage integration with Docker based containers. However, any other container system can run as a VM on the Nutanix platform.
Container Services Constructs
The following entities compose Karbon Container Services:
- Nutanix Docker Machine Driver: Handles Docker container host provisioning via Docker Machine and the AOS Image Service
- Nutanix Docker Volume Plugin: Responsible for interfacing with AOS Volumes to create, mount, format and attach volumes to the desired container
The following entities compose Docker (note: not all are required):
- Docker Image: The basis and image for a container
- Docker Registry: Holding space for Docker Images
- Docker Hub: Online container marketplace (public Docker Registry)
- Docker File: Text file describing how to construct the Docker image
- Docker Container: Running instantiation of a Docker Image
- Docker Engine: Creates, ships and runs Docker containers
- Docker Swarm: Docker host clustering / scheduling platform
- Docker Daemon: Handles requests from Docker Client and does heavy lifting of building, running and distributing containers
- Docker Store: Marketplace for trusted and enterprise ready containers
Services Architecture
The Nutanix solution currently leverages Docker Engine running in VMs which are created using Docker Machine. These machines can run in conjunction with normal VMs on the platform.
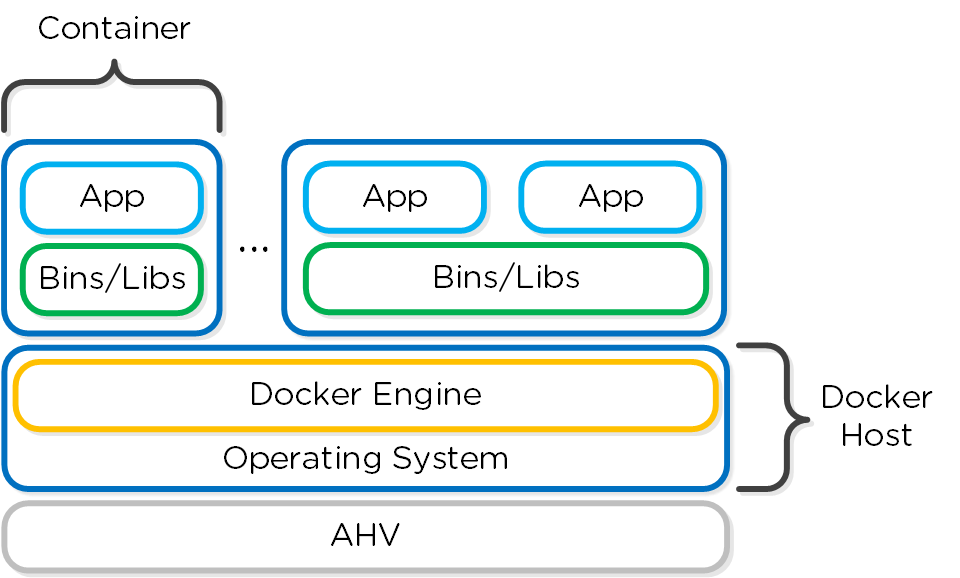 Docker - High-level Architecture
Nutanix has developed a Docker Volume Plugin which will create, format and attach a volume to container(s) using the AOS Volumes feature. This allows the data to persist as a container is power cycled / moved.
Data persistence is achieved by using the Nutanix Volume Plugin which will leverage AOS Volumes to attach a volume to the host / container:
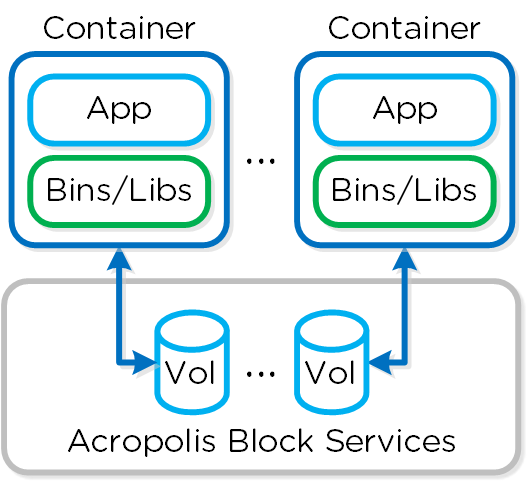 Docker - Volumes
Pre-Requisites
In order for Container Services to be used the following are necessary:
- Nutanix cluster must be AOS 4.7 or later
- A CentOS 7.0+ or a Rhel 7.2+ OS image with the iscsi-initiator-utils package installed must be downloaded and exist as an image in the AOS Image Service
- The Nutanix Data Services IP must be configured
- Docker Toolbox must be installed on the client machine used for configuration
- Nutanix Docker Machine Driver must be in client’s PATH
Docker Host Creation
Assuming all pre-requisites have been met the first step is to provision the Nutanix Docker Hosts using Docker Machine:
docker-machine -D create -d nutanix \
--nutanix-username PRISM_USER --nutanix-password PRISM_PASSWORD \
--nutanix-endpoint CLUSTER_IP:9440 --nutanix-vm-image DOCKER_IMAGE_NAME \ --nutanix-vm-network NETWORK_NAME \
--nutanix-vm-cores NUM_CPU --nutanix-vm-mem MEM_MB \
DOCKER_HOST_NAME
The following figure shows a high-level overview of the backend workflow:
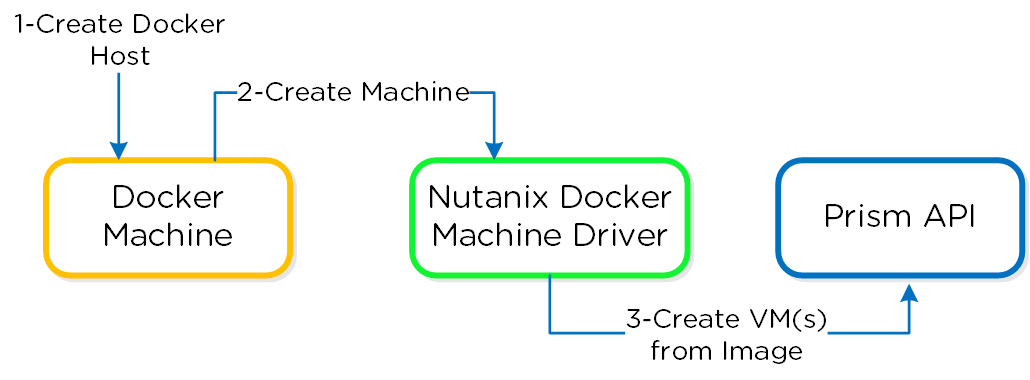 Docker - Host Creation Workflow
The next step is to SSH into the newly provisioned Docker Host(s) via docker-machine ssh:
docker-machine ssh DOCKER_HOST_NAME
To install the Nutanix Docker Volume Plugin run:
docker plugin install ntnx/nutanix_volume_plugin PRISM_IP= DATASERVICES_IP= PRISM_PASSWORD= PRISM_USERNAME= DEFAULT_CONTAINER= --alias nutanix
After that runs you should now see the plugin enabled:
[root@DOCKER-NTNX-00 ~]# docker plugin ls
ID Name Description Enabled
37fba568078d nutanix:latest Nutanix volume plugin for docker true
Docker Container Creation
Once the Nutanix Docker Host(s) have been deployed and the volume plugin has been enabled, you can provision containers with persistent storage.
A volume using the AOS Volumes can be created using the typical Docker volume command structure and specifying the Nutanix volume driver. Example usage below:
docker volume create \
VOLUME_NAME --driver nutanix

Example:
docker volume create PGDataVol --driver nutanix
The following command structure can be used to create a container using the created volume. Example usage below:
docker run -d --name CONTAINER_NAME \
-p START_PORT:END_PORT --volume-driver nutanix \
-v VOL_NAME:VOL_MOUNT_POINT DOCKER_IMAGE_NAME

Example:
docker run -d --name postgresexample -p 5433:5433 --volume-driver nutanix -v PGDataVol:/var/lib/postgresql/data postgres:latest
The following figure shows a high-level overview of the backend workflow:
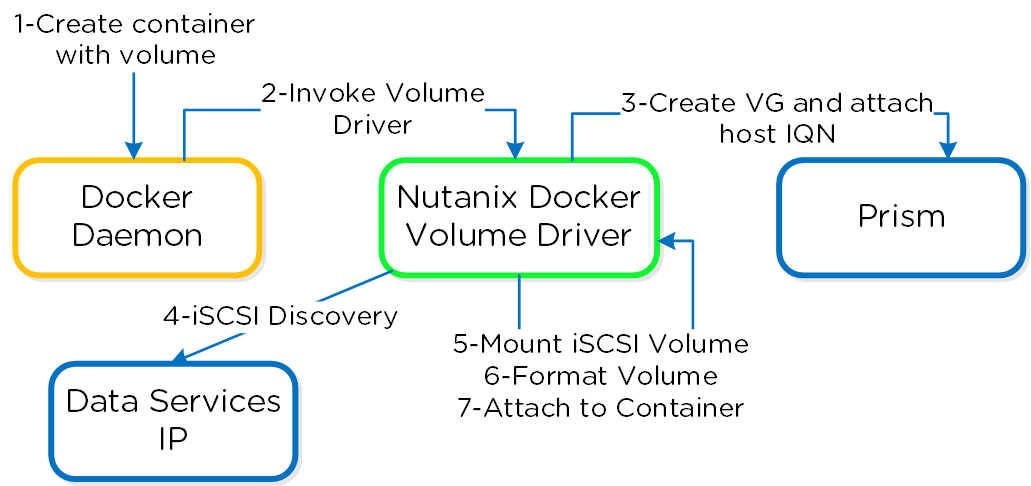
Docker - Container Creation Workflow
You now have a container running with persistent storage!
» Download this section as PDF (opens in a new tab/window)
Nutanix provides native backup and disaster recovery (DR) capabilities allowing users to backup, restore and DR VM(s) and objects running on DSF to both on-premises or cloud environments (Xi). As of AOS 5.11 Nutanix released a feature called Leap which abstracts a lot of these concepts. For more information on Leap, refer to the ‘Leap’ chapter in ‘Backup/DR Services’.
We will cover the following items in the following sections:
- Implementation Constructs
- Protecting Entities
- Backup and Restore
- Replication and DR
NOTE: Though Nutanix provides native options for backup and dr, traditional solutions (e.g. Commvault, Rubrik, etc.) can also be used, leveraging some of the native features the platform provides (VSS, snapshots, etc.).
Implementation Constructs
Within Nutanix Backup and DR, there are a few key constructs:
Protection Domain (PD)
- Key Role: Macro group of VMs and/or files to protect
- Description: A group of VMs and/or files to be replicated together on a desired schedule. A PD can protect a full container or you can select individual VMs and/or files
Note
Pro tip
Create multiple PDs for various services tiers driven by a desired RPO/RTO. For file distribution (e.g. golden images, ISOs, etc.) you can create a PD with the files to replication.
Consistency Group (CG)
- Key Role: Subset of VMs/files in PD to be crash-consistent
- Description: VMs and/or files which are part of a Protection Domain which need to be snapshotted in a crash-consistent manner. This ensures that when VMs/files are recovered, they come up in a consistent state. A protection domain can have multiple consistency groups.
Note
Pro tip
Group dependent application or service VMs in a consistency group to ensure they are recovered in a consistent state (e.g. App and DB)
Snapshot Schedule
- Key Role: Snapshot and replication schedule
- Description: Snapshot and replication schedule for VMs in a particular PD and CG
Note
Pro tip
The snapshot schedule should be equal to your desired RPO
Retention Policy
- Key Role: Number of local and remote snapshots to keep
- Description: The retention policy defines the number of local and remote snapshots to retain. NOTE: A remote site must be configured for a remote retention/replication policy to be configured.
Note
Pro tip
The retention policy should equal the number of restore points required per VM/file
Remote Site
- Key Role: A remote Nutanix cluster
- Description: A remote Nutanix cluster which can be leveraged as a target for backup or DR purposes.
Note
Pro tip
Ensure the target site has ample capacity (compute/storage) to handle a full site failure. In certain cases replication/DR between racks within a single site can also make sense.
The following figure shows a logical representation of the relationship between a PD, CG, and VM/Files for a single site:
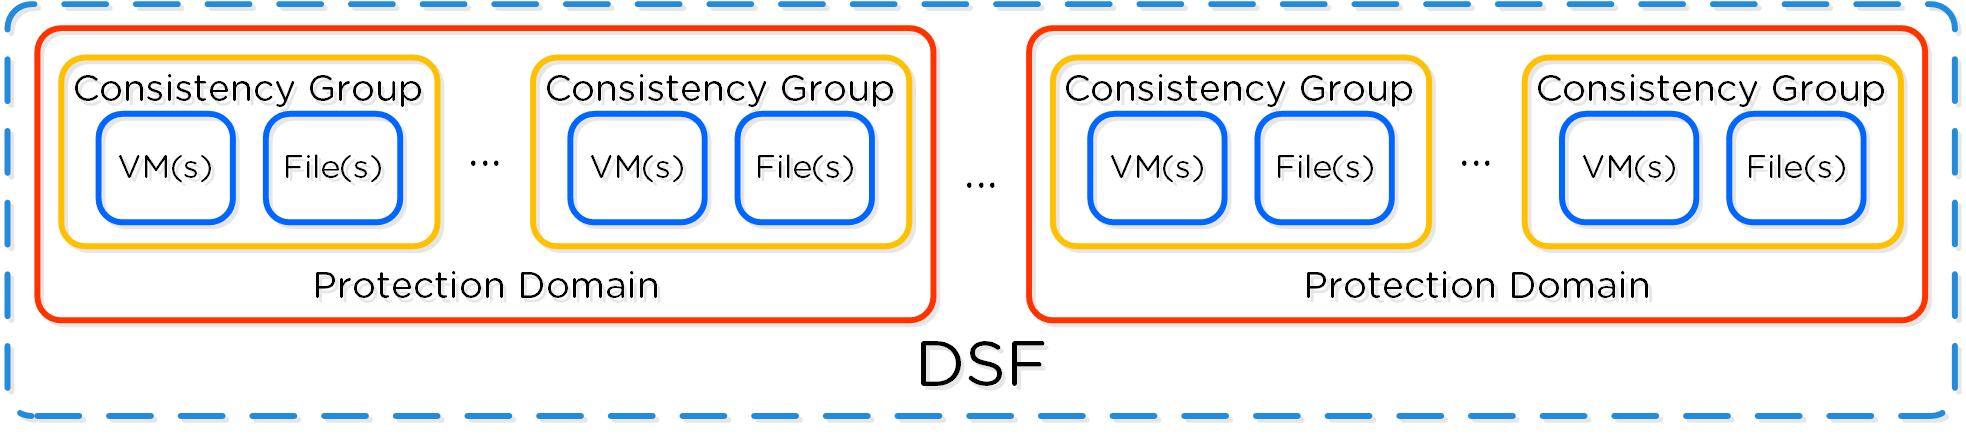 DR Construct Mapping
Note
Policy Based DR & Run Books
Policy based DR and run books extends upon the capabilities defined in VM based DR (PDs, CGs, etc.) and abstracts things into a policy driven model. This simplifies configuration by focusing on the items of interest (e.g. RPO, retention, etc.) and assigning to categories instead of directly to VMs. This also allows for a "default policy" that can apply to all VMs.
NOTE: These policies are configured via Prism Central (PC).
Protecting Entities
You can protect Entities (VMs, VGs, Files), using the following workflow:
From the Data Protection page, select + Protection Domain -> Async DR:
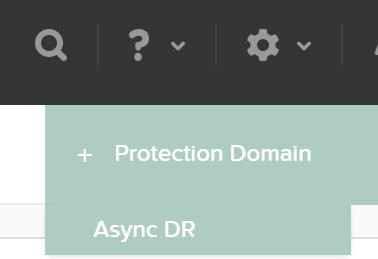 DR - Async PD
Specify a PD name and click ‘Create’
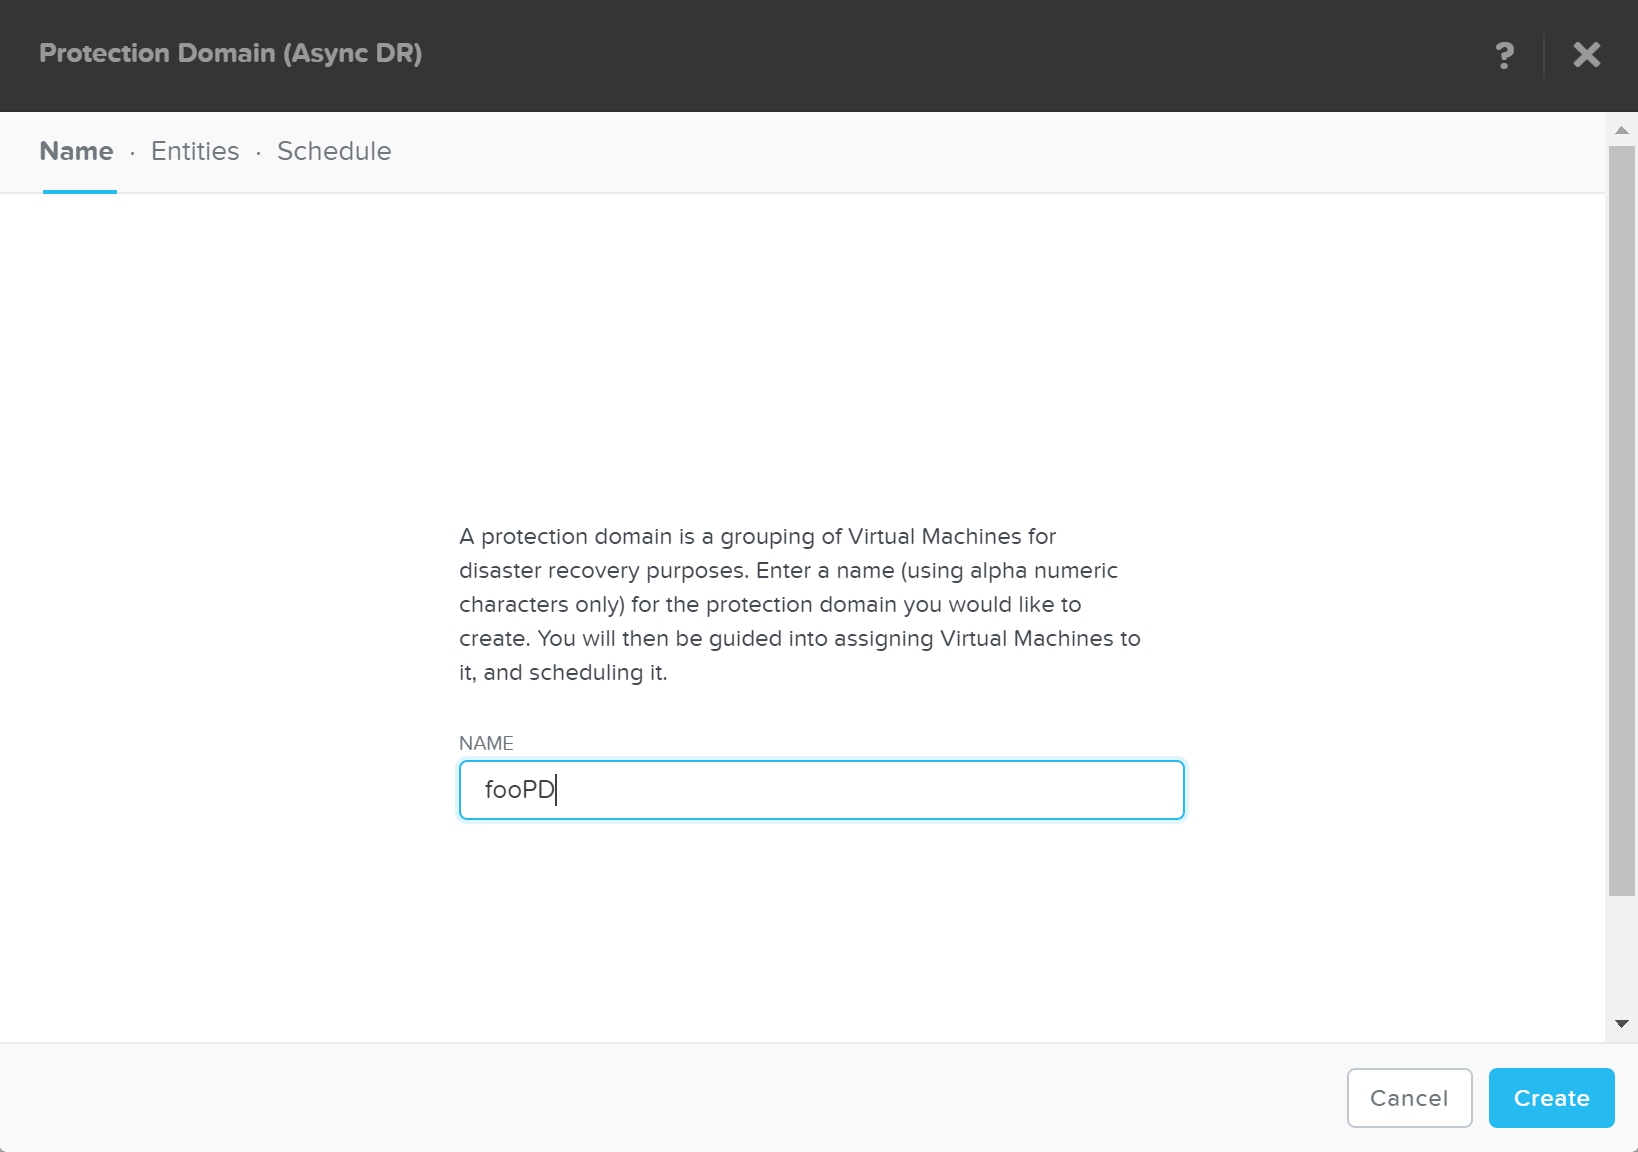 DR - Create PD
Select entities to protect:
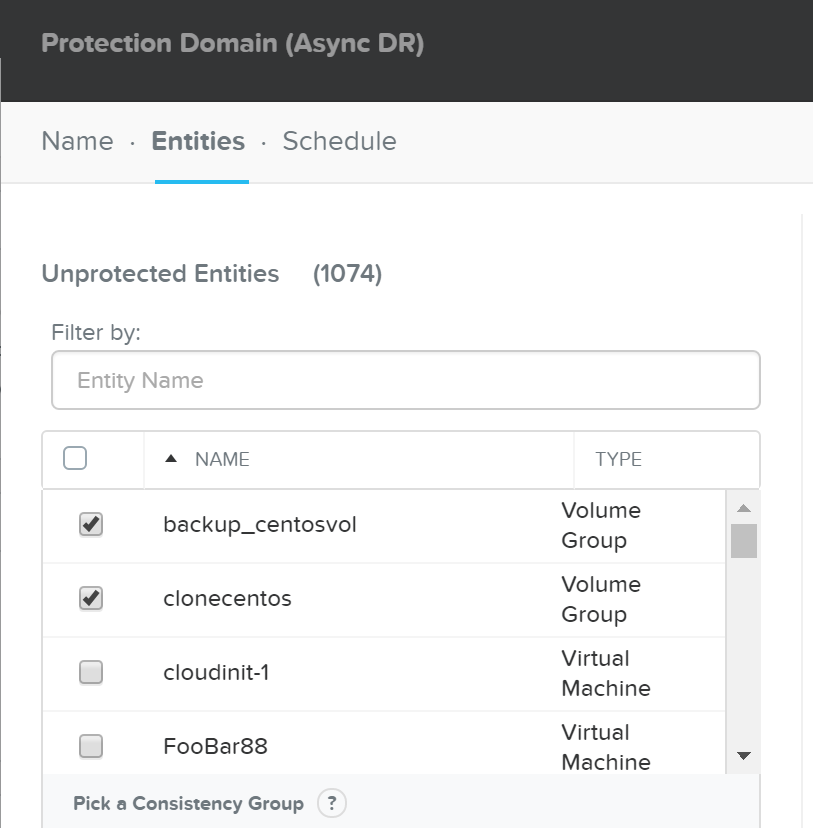 DR - Async PD
Click ‘Protect Selected Entities’
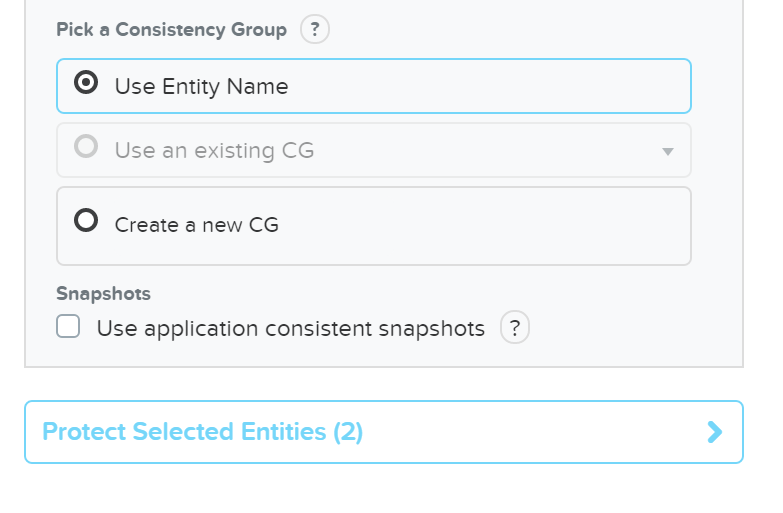 DR - Protect Entities
The protect entities will now be displayed under ‘Protected Entities’
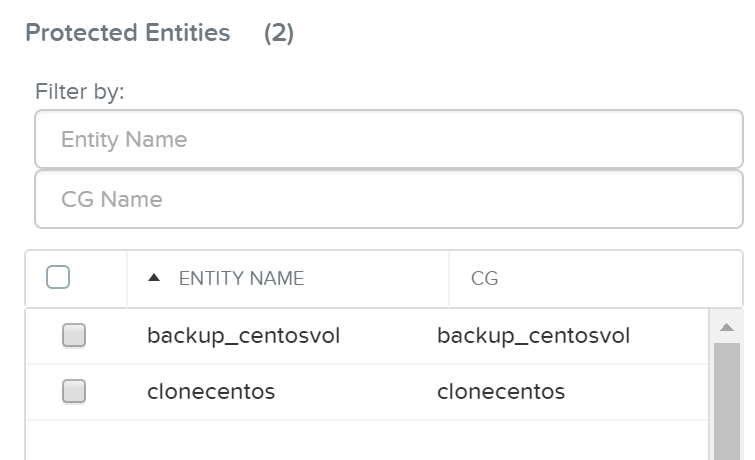 DR - Protected Entities
Click ‘Next’, then click ‘Next Schedule’ to create a snapshot and replication schedule
Enter the desired snapshot frequency, retention and any remote sites for replication
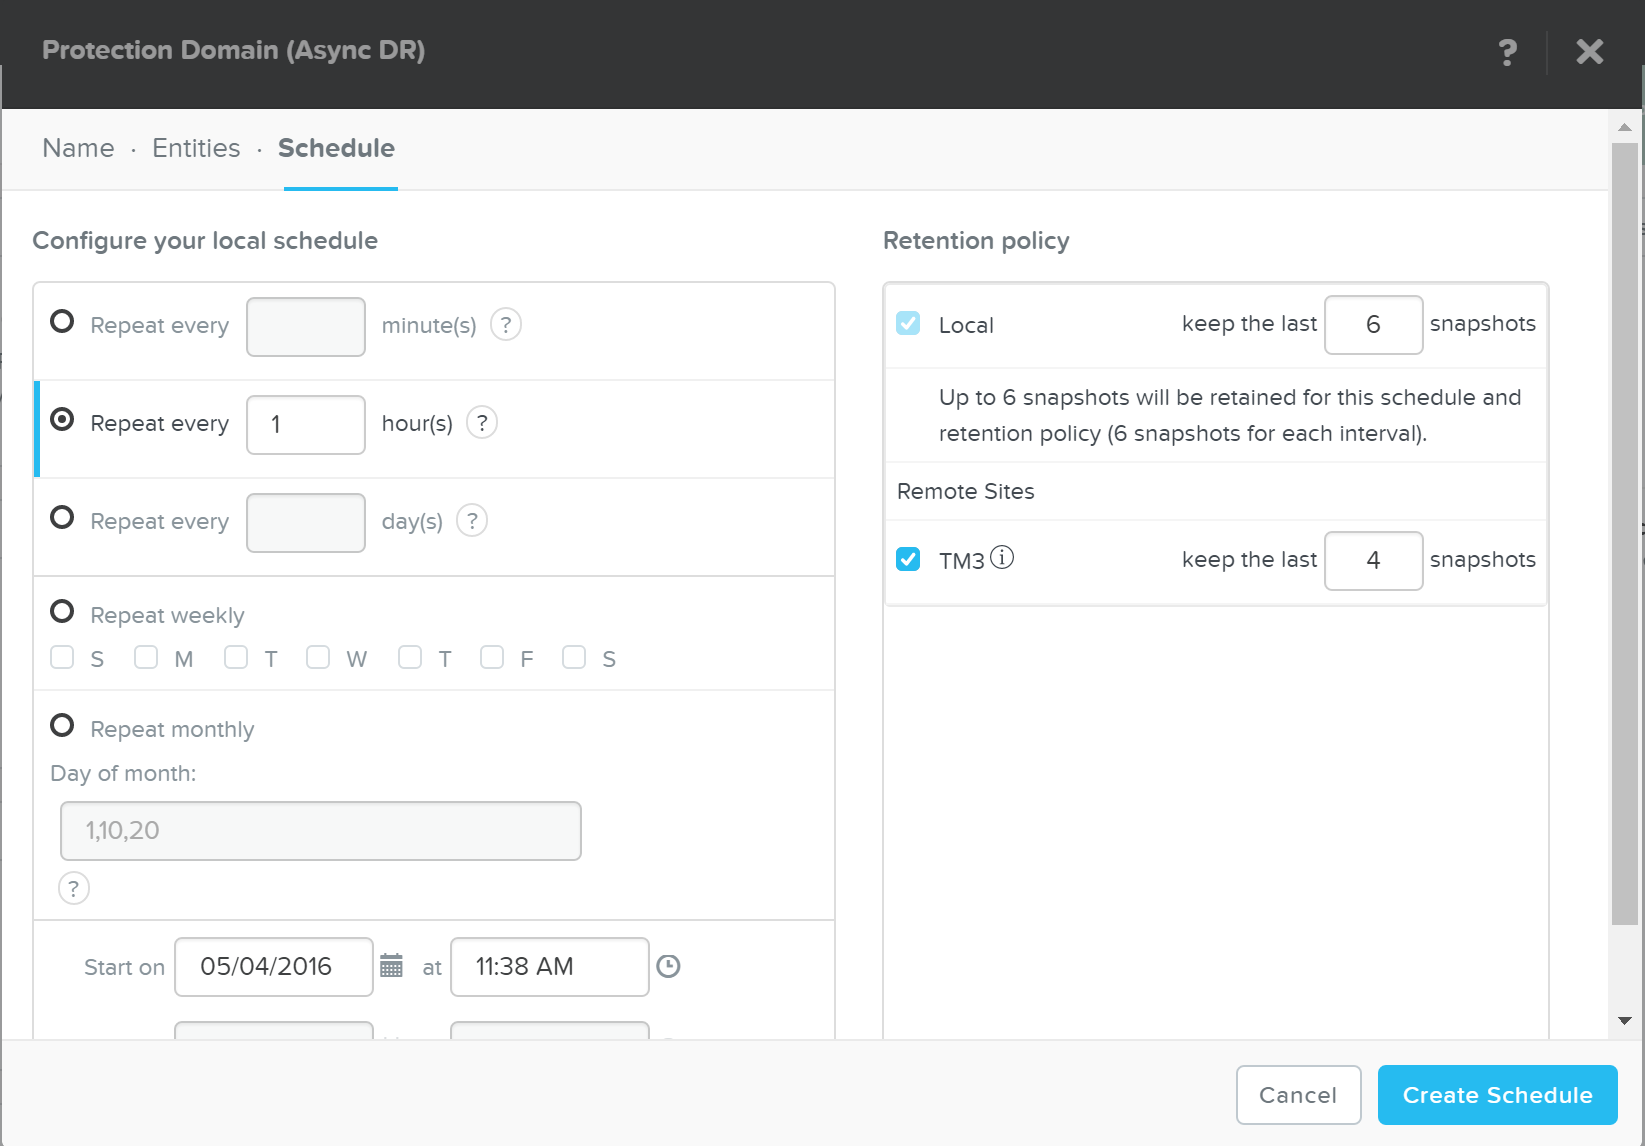 DR - Create Schedule
Click ‘Create Schedule’ to complete the schedule completion.
Note
Multiple Schedules
It is possible to create multiple snapshot / replication schedules. For example, if you want to have a local backup schedule occurring hourly and another schedule which replicated to a remote site daily.
It is important to mention that a full container can be protected for simplicity. However, the platform provides the ability to protect down to the granularity of a single VM and/or file level.
Backup and Restore
Nutanix backup capabilities leverage the native DSF snapshot capabilities and are invoked by Cerebro and performed by Stargate. These snapshot capabilities are zero copy to ensure efficient storage utilization and low overhead. You can read more on Nutanix snapshots in the ‘Snapshots and Clones’ section.
Typical backup and restore operations include:
- Snapshot: Create a restore point and replicate (if necessary)
- Restore: Restore VM(s) / File(s) from a previous snapshot (replaces original objects)
- Clone: Similar to restore but does not replace original objects (creates new objects as desired snapshot)
From the Data Protection Page, you can see the protection domains (PD) previously created in the ‘Protecting Entities’ section.
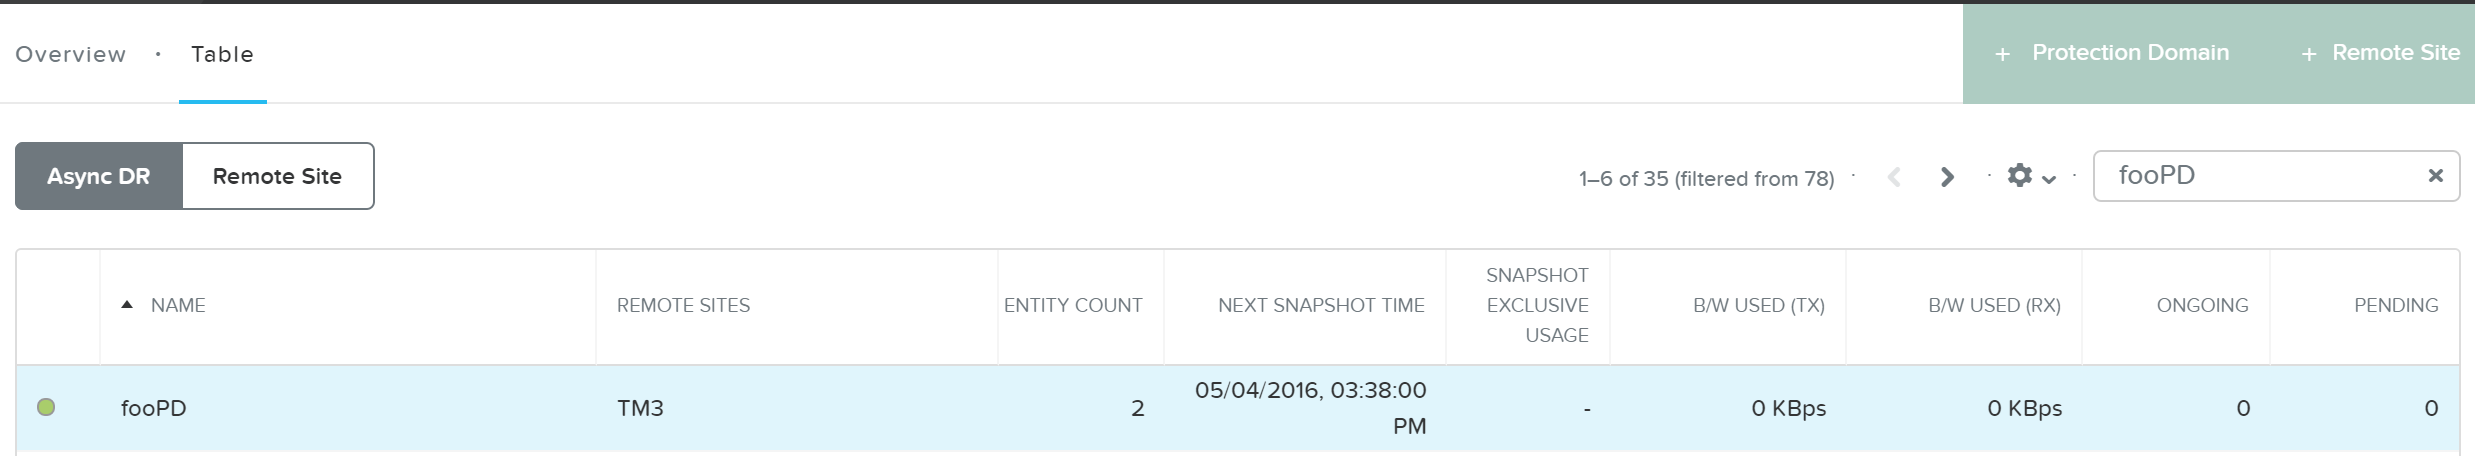 DR - View PDs
Once you’re selected a target PD you can see the various options:
 DR - PD Actions
If you click ‘Take Snapshot’ you can take an ad-hoc snapshot of the selected PD and replicate to a remote site if necessary:
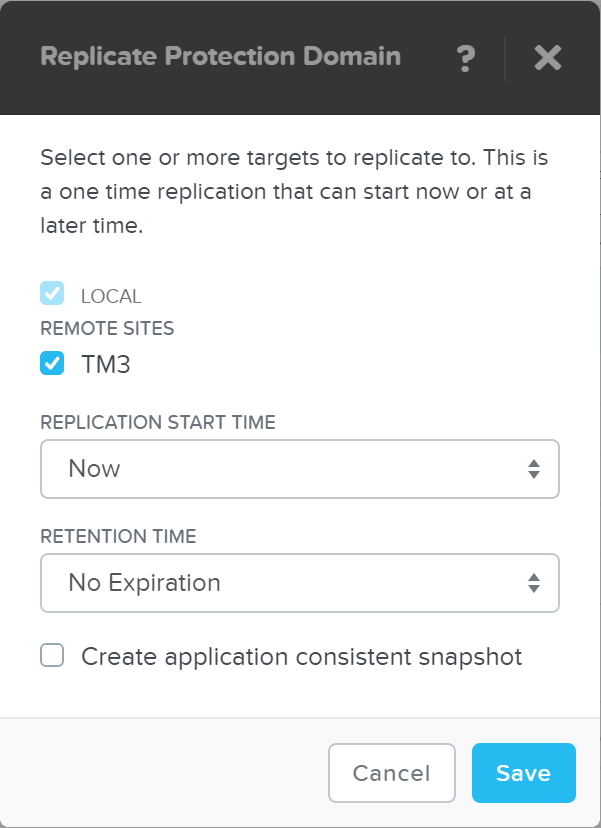 DR - Take Snapshot
You can also ‘Migrate’ the PD which will fail over the entities to a remote site:
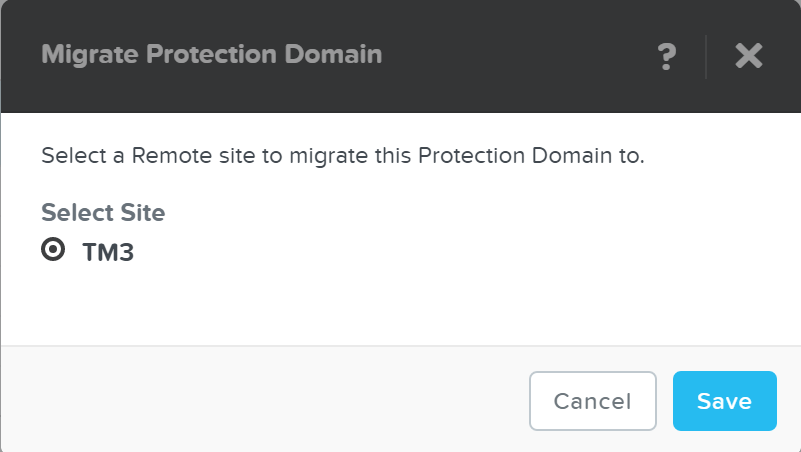 DR - Migrate
In the event of a migrate (controlled failover), the system will take a new snapshot, replicate then promote the other site with the newly created snap.
Note
Pro tip
With AOS 5.0 and above you can now leverage a single node replication target data protection.
You can also view the PD snapshot(s) in the table below:
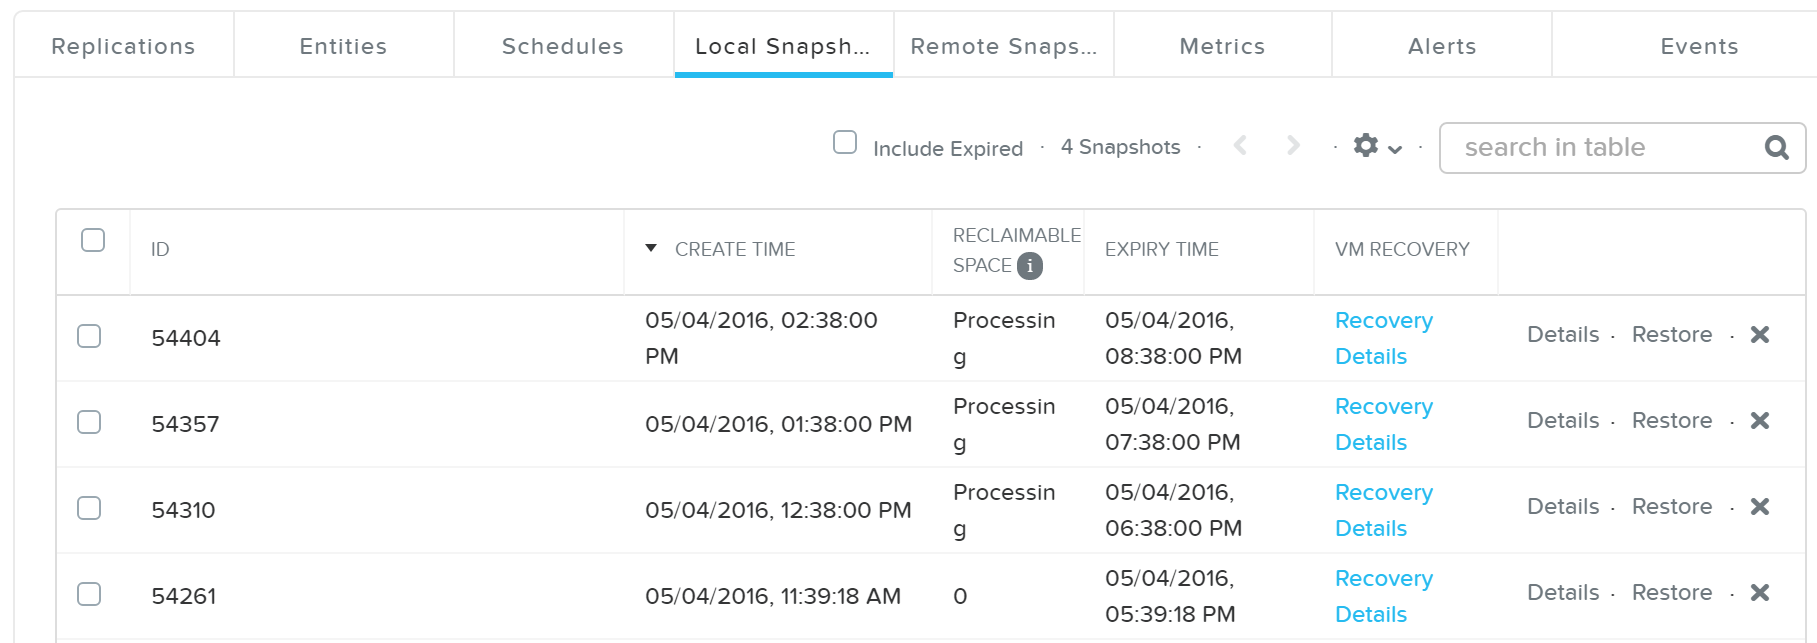 DR - Local Snapshots
From here you can restore or clone a PD snapshot:
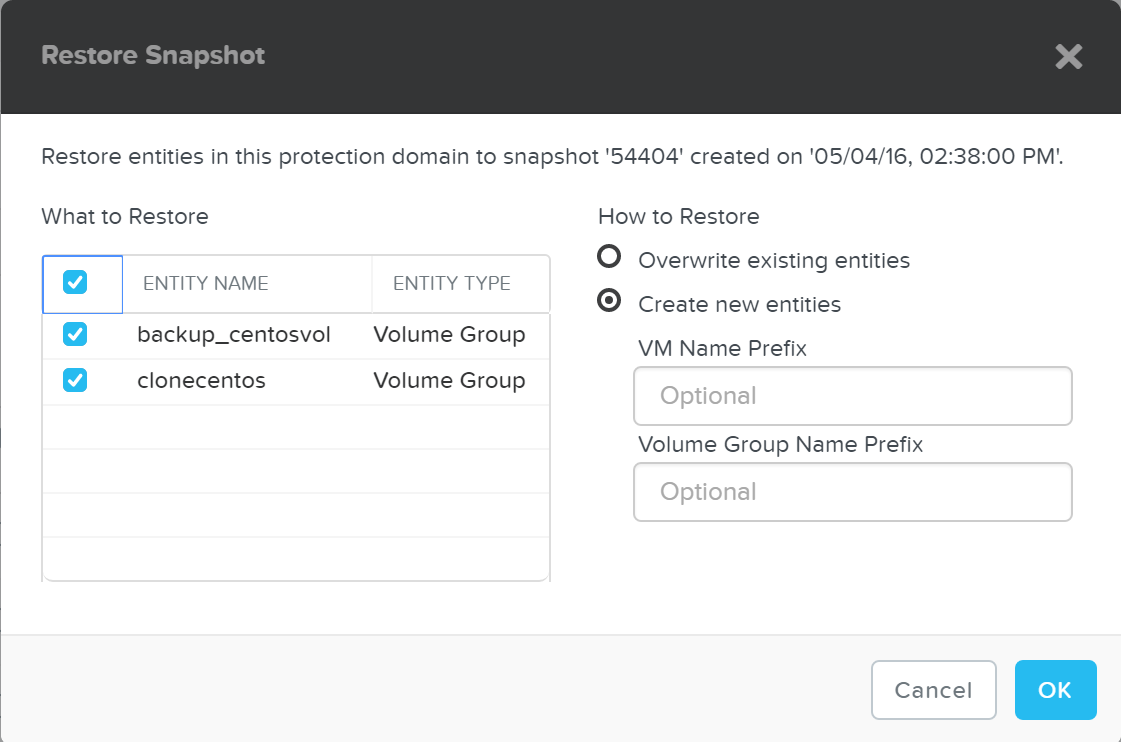 DR - Restore Snapshot
If you choose to ‘Create new entities’ that will be like cloning the snapshot of the PD to new entities with the desired prefixes. Otherwise ‘Overwrite existing entities’ will replace the current entities with those at the time of the snapshot.
Note
Storage only backup target
For backup / archival only purposes, it is possible to configure a storage only Nutanix cluster as a remote site which will act as a backup target. This will allow data to be replicated to / from the storage only cluster.
App Consistent Snapshots
Nutanix provides native VmQueisced Snapshot Service (VSS) capabilities for queiscing OS and application operations which ensure an application consistent snapshot is achieved.
Note
VmQueisced Snapshot Service (VSS)
VSS is typically a Windows specific term for Volume Shadow Copy Service. However, since this solution applies to both Windows and Linux we've modified the term to VmQueisced Snapshot Service.
Supported Configurations
The solution is applicable to both Windows and Linux guests. Refer to “NGT Compatibility” in the Compatibility and Interoperability Matrix for a full list of supported guest OS’s: LINK
Pre-Requisites
In order for Nutanix VSS snapshots to be used the following are necessary:
- Nutanix Platform
- Cluster Virtual IP (VIP) must be configured
- Guest OS / UVM
- NGT must be installed
- CVM VIP must be reachable on port 2074
- Disaster Recovery Configuration
- UVM must be in PD with ‘Use application consistent snapshots’ enabled
Backup Architecture
As of 4.6 this is achieved using the native Nutanix Hardware VSS provider which is installed as part of the Nutanix Guest Tools package. You can read more on the guest tools in the ‘Nutanix Guest Tools’ section.
The following image shows a high-level view of the VSS architecture:
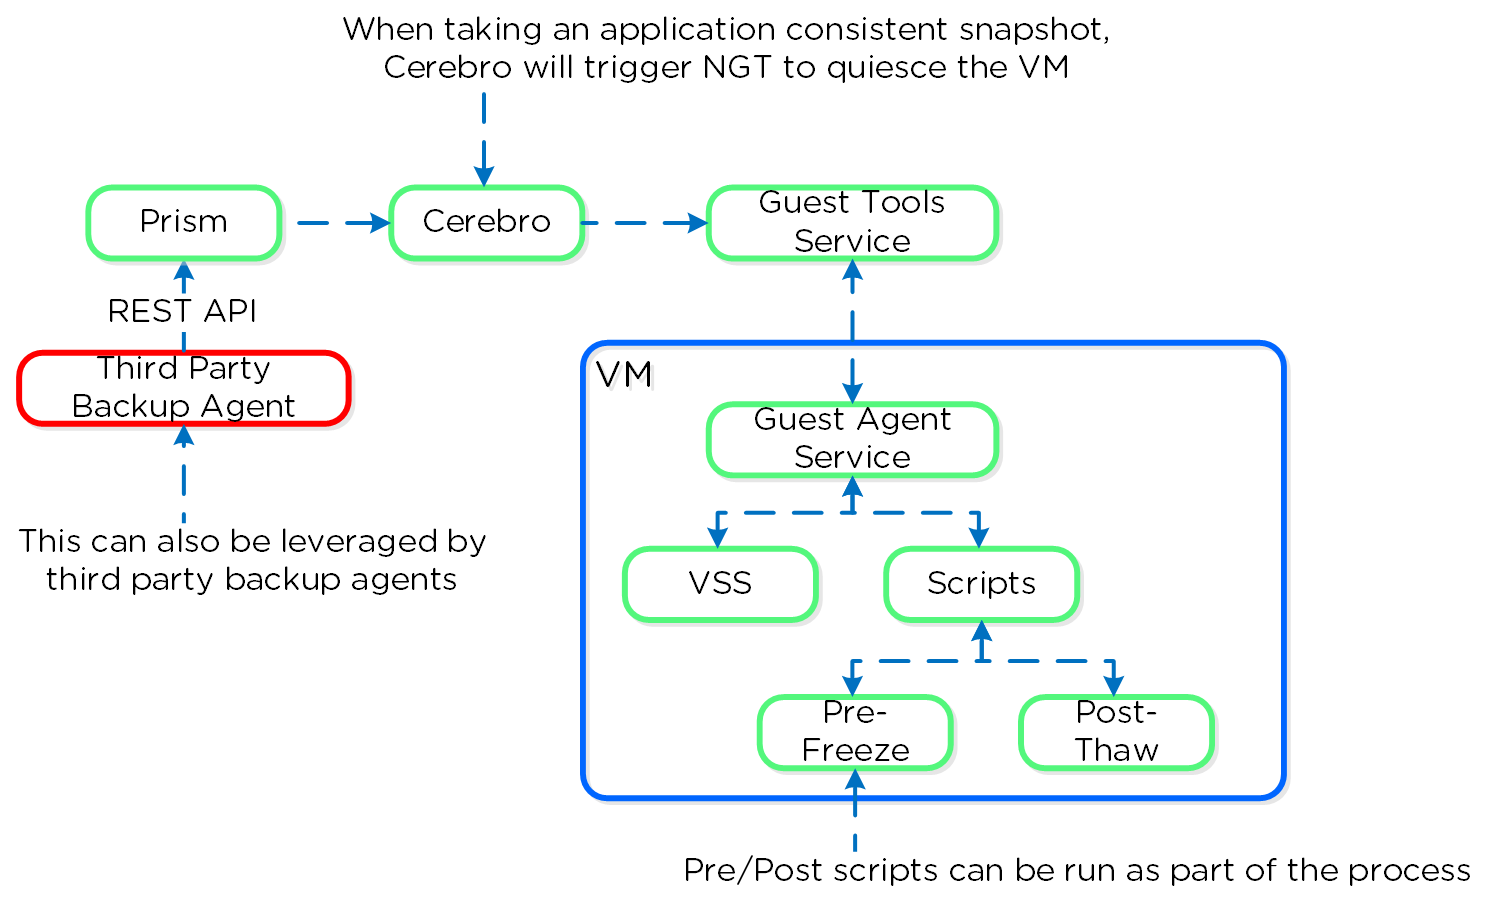
You can perform an application consistent snapshot by following the normal data protection workflow and selecting ‘Use application consistent snapshots’ when protecting the VM.
Note
Enabling/Disabling Nutanix VSS
When NGT is enabled for a UVM, the Nutanix VSS snapshot capability is enabled by default. However, you can turn off this capability with the following command:
ncli ngt disable-applications application-names=vss_snapshot vm_id=VM_ID
Windows VSS Architecture
The Nutanix VSS solution is integrated with the Windows VSS framework. The following shows a high-level view of the architecture:
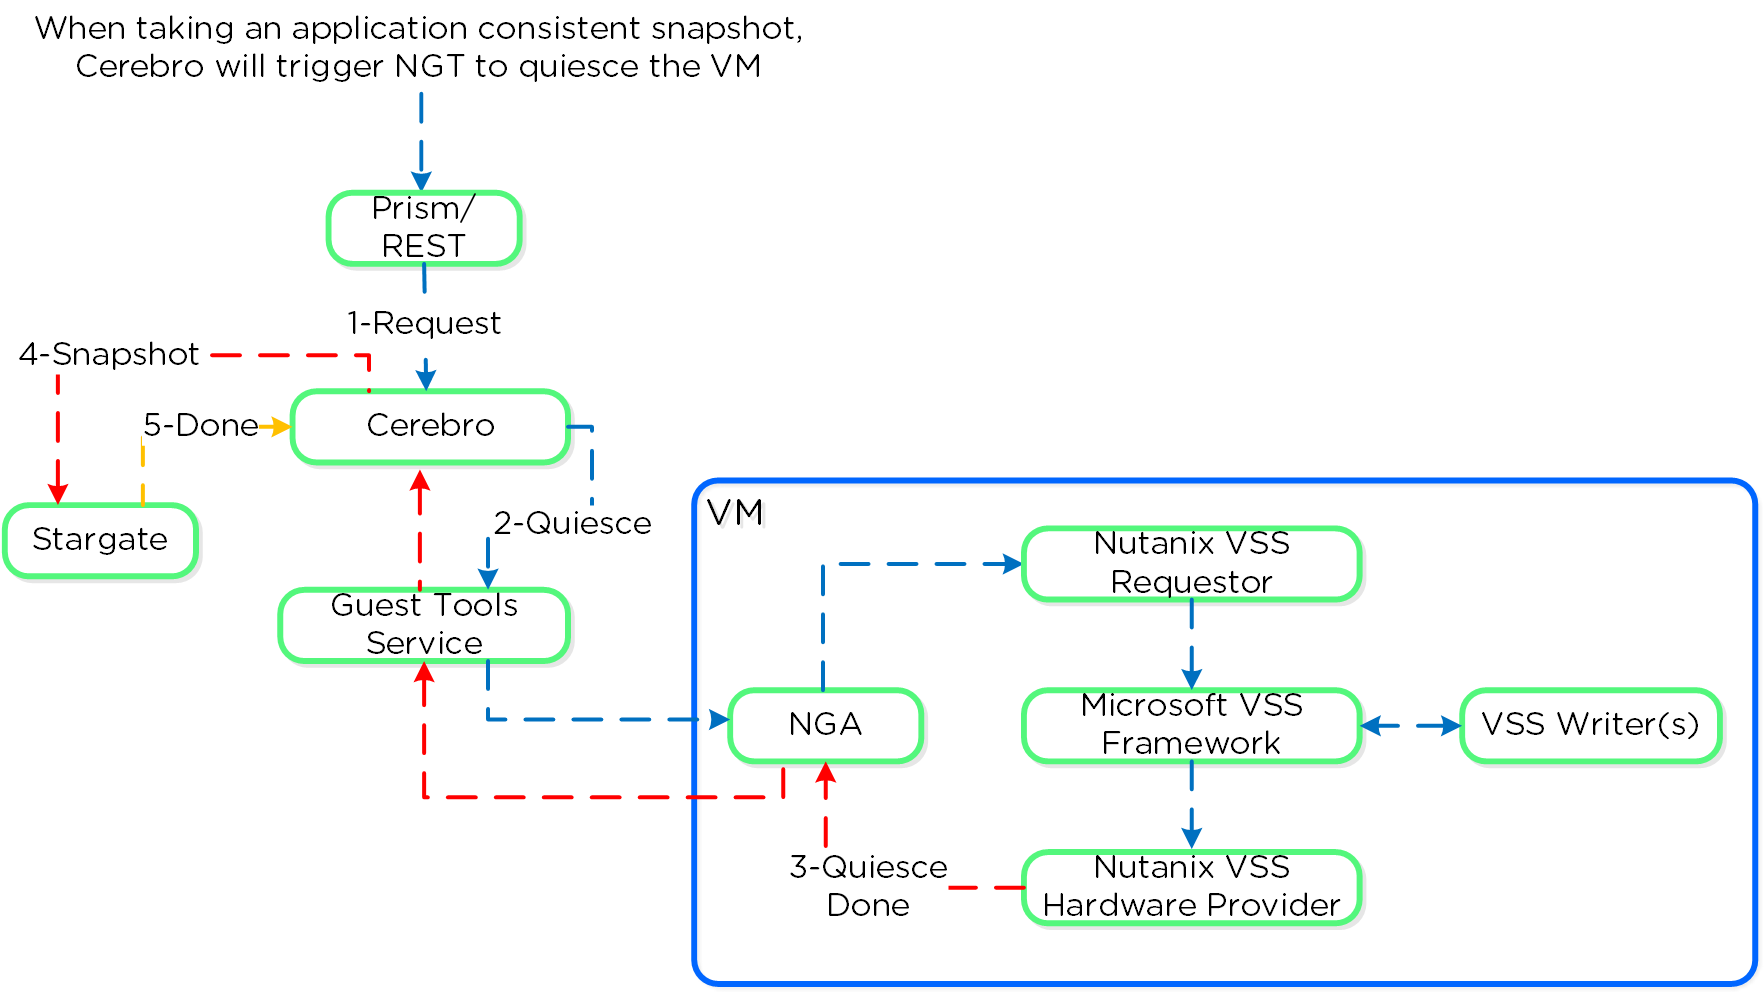 Nutanix VSS - Windows Architecture
Once NGT is installed you can see the NGT Agent and VSS Hardware Provider services:
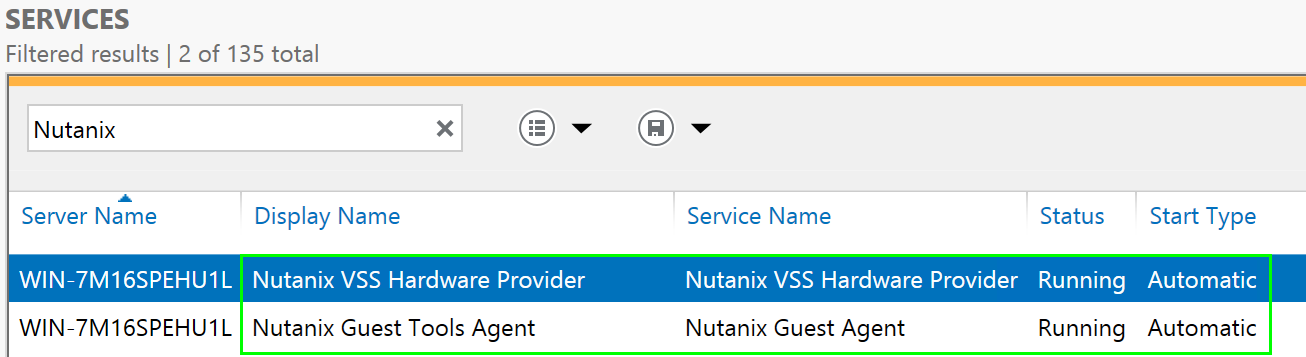 VSS Hardware Provider
Linux VSS Architecture
The Linux solution works similar to the Windows solution, however scripts are leveraged instead of the Microsoft VSS framework as it doesn’t exist in Linux distros.
The Nutanix VSS solution is integrated with the Windows VSS framework. The following shows a high-level view of the architecture:
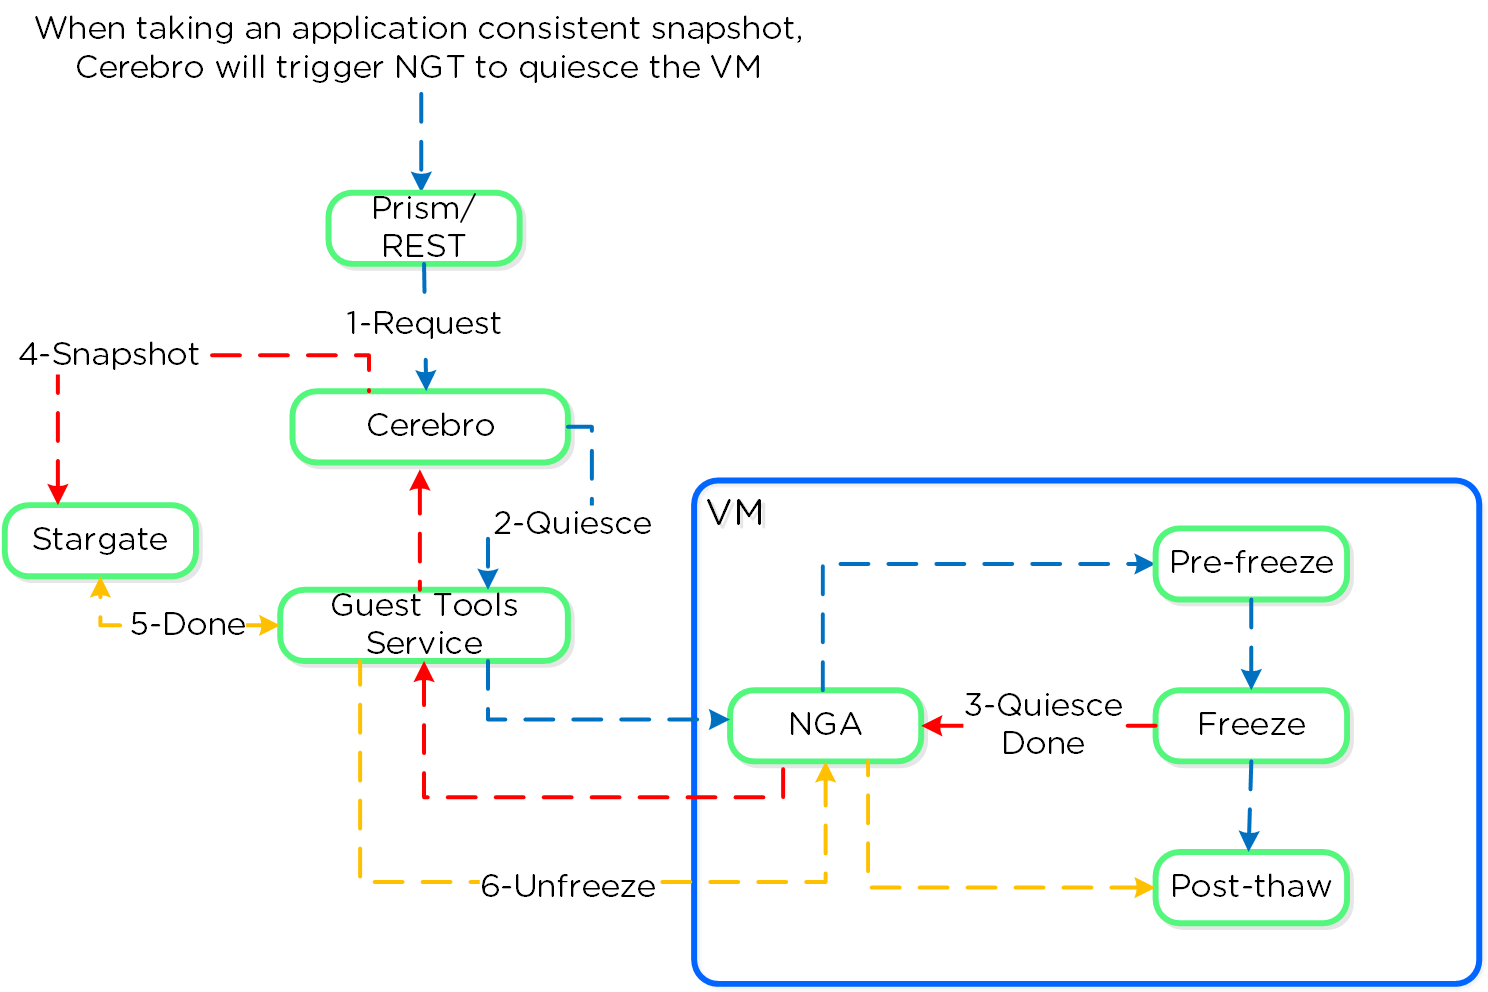 Nutanix VSS - Linux Architecture
The pre-freeze and post-thaw scripts are located in the following directories:
- Pre-freeze: /sbin/pre_freeze
- Post-thaw: /sbin/post-thaw
Note
Eliminating ESXi Stun
ESXi has native app consistent snapshot support using VMware guest tools. However, during this process, delta disks are created and ESXi "stuns" the VM in order to remap the virtual disks to the new delta files which will handle the new write IO. Stuns will also occur when a VMware snapshot is deleted.
During this stun process the VM its OS cannot execute any operations and is essentially in a "stuck" state (e.g. pings will fail, no IO). The duration of the stun will depend on the number of vmdks and speed of datastore metadata operations (e.g. create new delta disks, etc.)
By using Nutanix VSS we completely bypass the VMware snapshot / stun process and have little to no impact to performance or VM / OS availability.
Replication and Disaster Recovery (DR)
For a visual explanation, you can watch the following video: LINK
Nutanix provides native DR and replication capabilities, which build upon the same features explained in the Snapshots & Clones section. Cerebro is the component responsible for managing the DR and replication in DSF. Cerebro runs on every node and a Cerebro leader is elected (similar to NFS leader) and is responsible for managing replication tasks. In the event the CVM acting as Cerebro leader fails, another is elected and assumes the role. The Cerebro page can be found on
- Replication Topologies
- Replication Lifecycle
- Global Deduplication
Replication Topologies
Traditionally, there are a few key replication topologies: Site to site, hub and spoke, and full and/or partial mesh. Contrary to traditional solutions which only allow for site to site or hub and spoke, Nutanix provides a fully mesh or flexible many-to-many model.
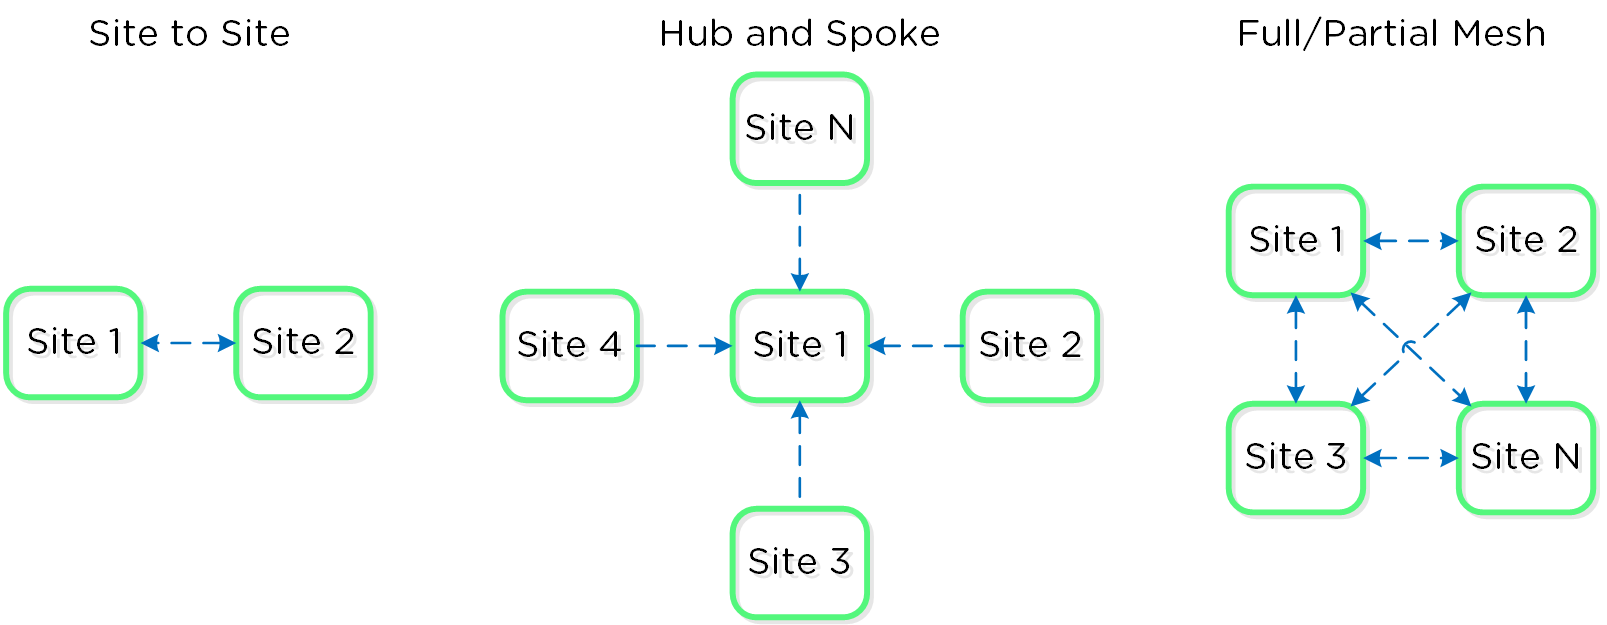 Example Replication Topologies
Essentially, this allows the admin to determine a replication capability that meets their company’s needs.
Replication Lifecycle
Nutanix replication leverages the Cerebro service mentioned above. The Cerebro service is broken into a “Cerebro Leader”, which is a dynamically elected CVM, and Cerebro Workers, which run on every CVM. In the event where the CVM acting as the “Cerebro Leader” fails, a new “Leader” is elected.
The Cerebro Leader is responsible for managing task delegation to the local Cerebro Workers as well as coordinating with remote Cerebro Leader(s) when remote replication is occurring.
During a replication, the Cerebro Leader will figure out which data needs to be replicated, and delegate the replication tasks to the Cerebro Workers which will then tell Stargate which data to replicate and to where.
Replicated data is protected at multiple layers throughout the process. Extent reads on the source are checksummed to ensure consistency for source data (similar to how any DSF read occurs) and the new extent(s) are checksummed at the target (similar to any DSF write). TCP provides consistency on the network layer.
The following figure shows a representation of this architecture:
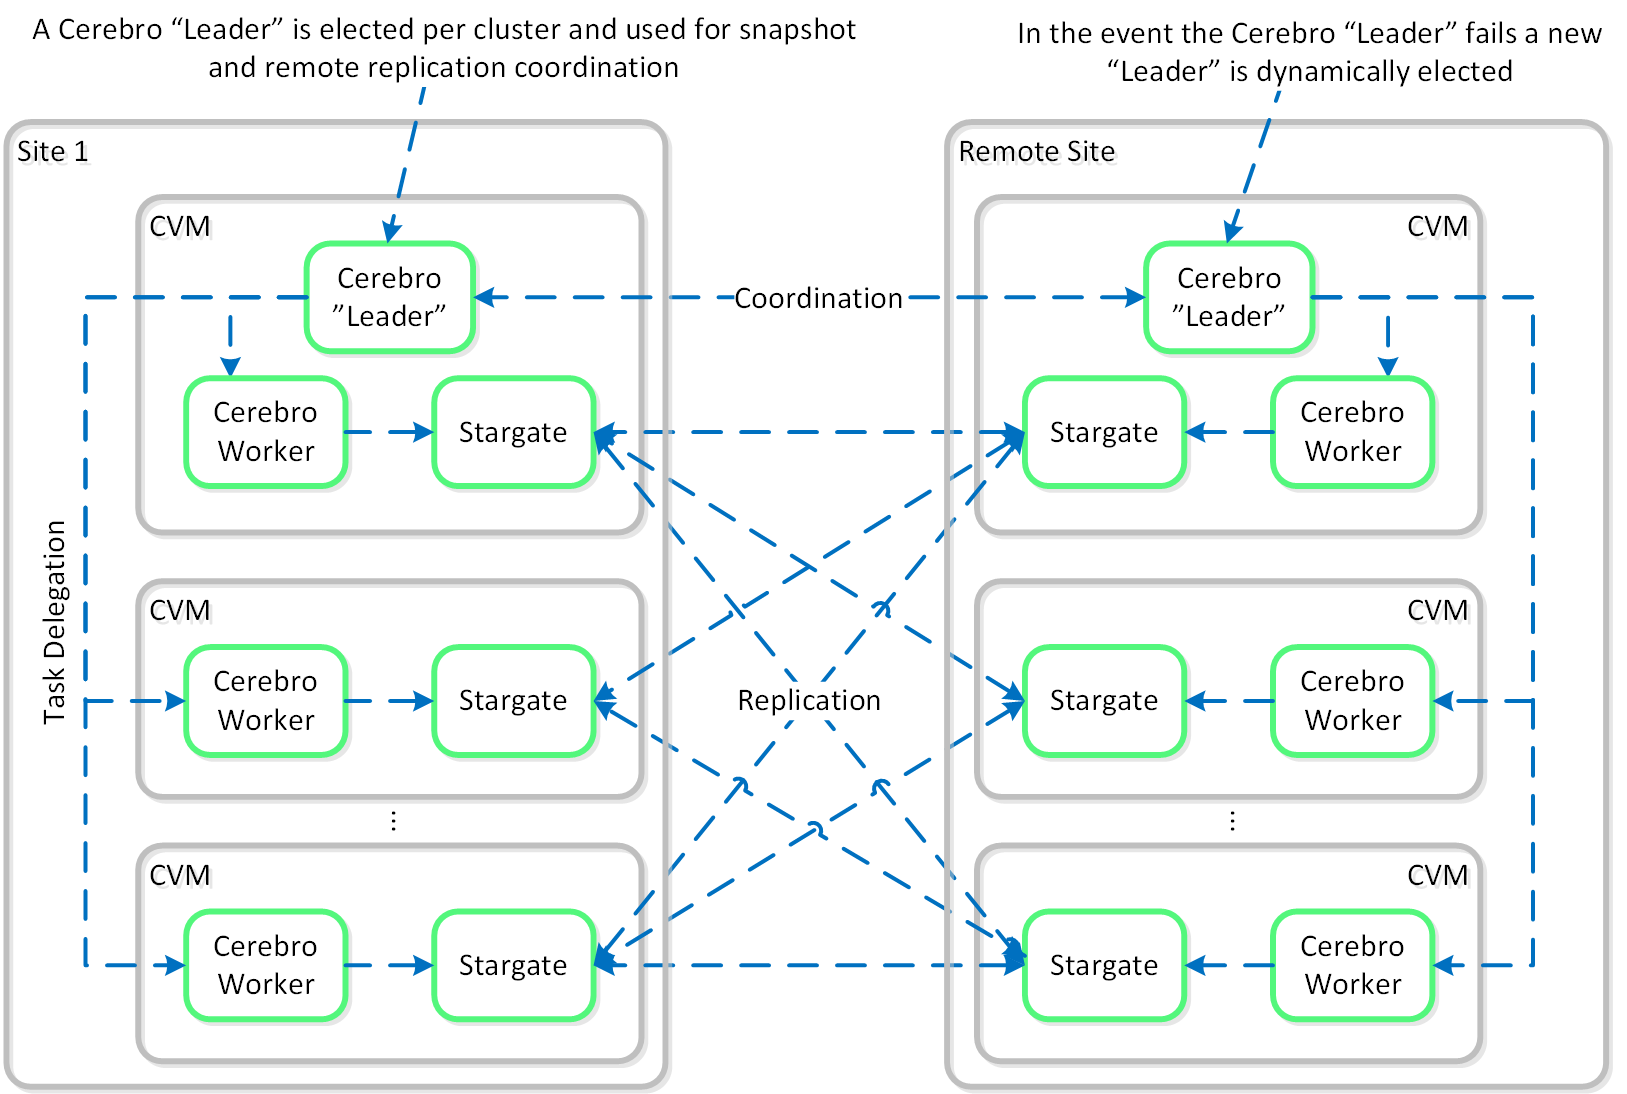 Replication Architecture
It is also possible to configure a remote site with a proxy which will be used as a bridgehead for all coordination and replication traffic coming from a cluster.
Note
Pro tip
When using a remote site configured with a proxy, always utilize the cluster IP as that will always be hosted by the Prism Leader and available, even if CVM(s) go down.
The following figure shows a representation of the replication architecture using a proxy:
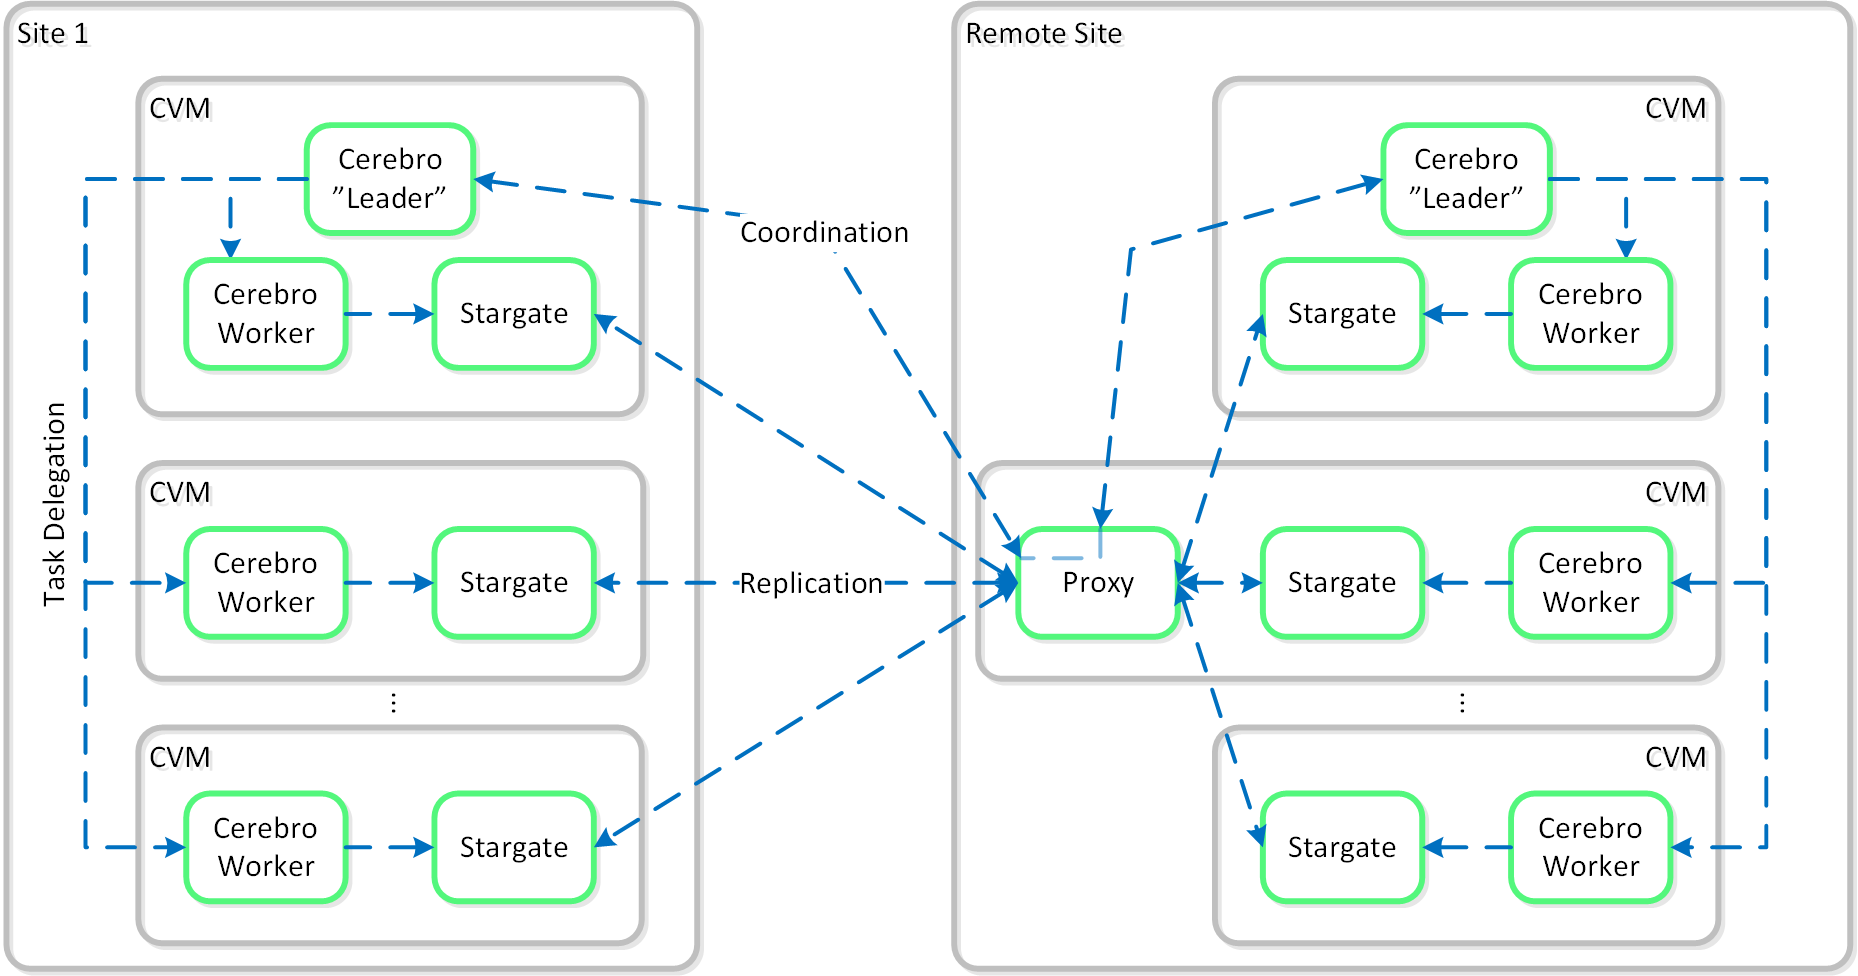 Replication Architecture - Proxy
In certain scenarios, it is also possible to configure a remote site using a SSH tunnel where all traffic will flow between two CVMs.
Note
Note
This should only be used for non-production scenarios and the cluster IPs should be used to ensure availability.The following figure shows a representation of the replication architecture using a SSH tunnel:
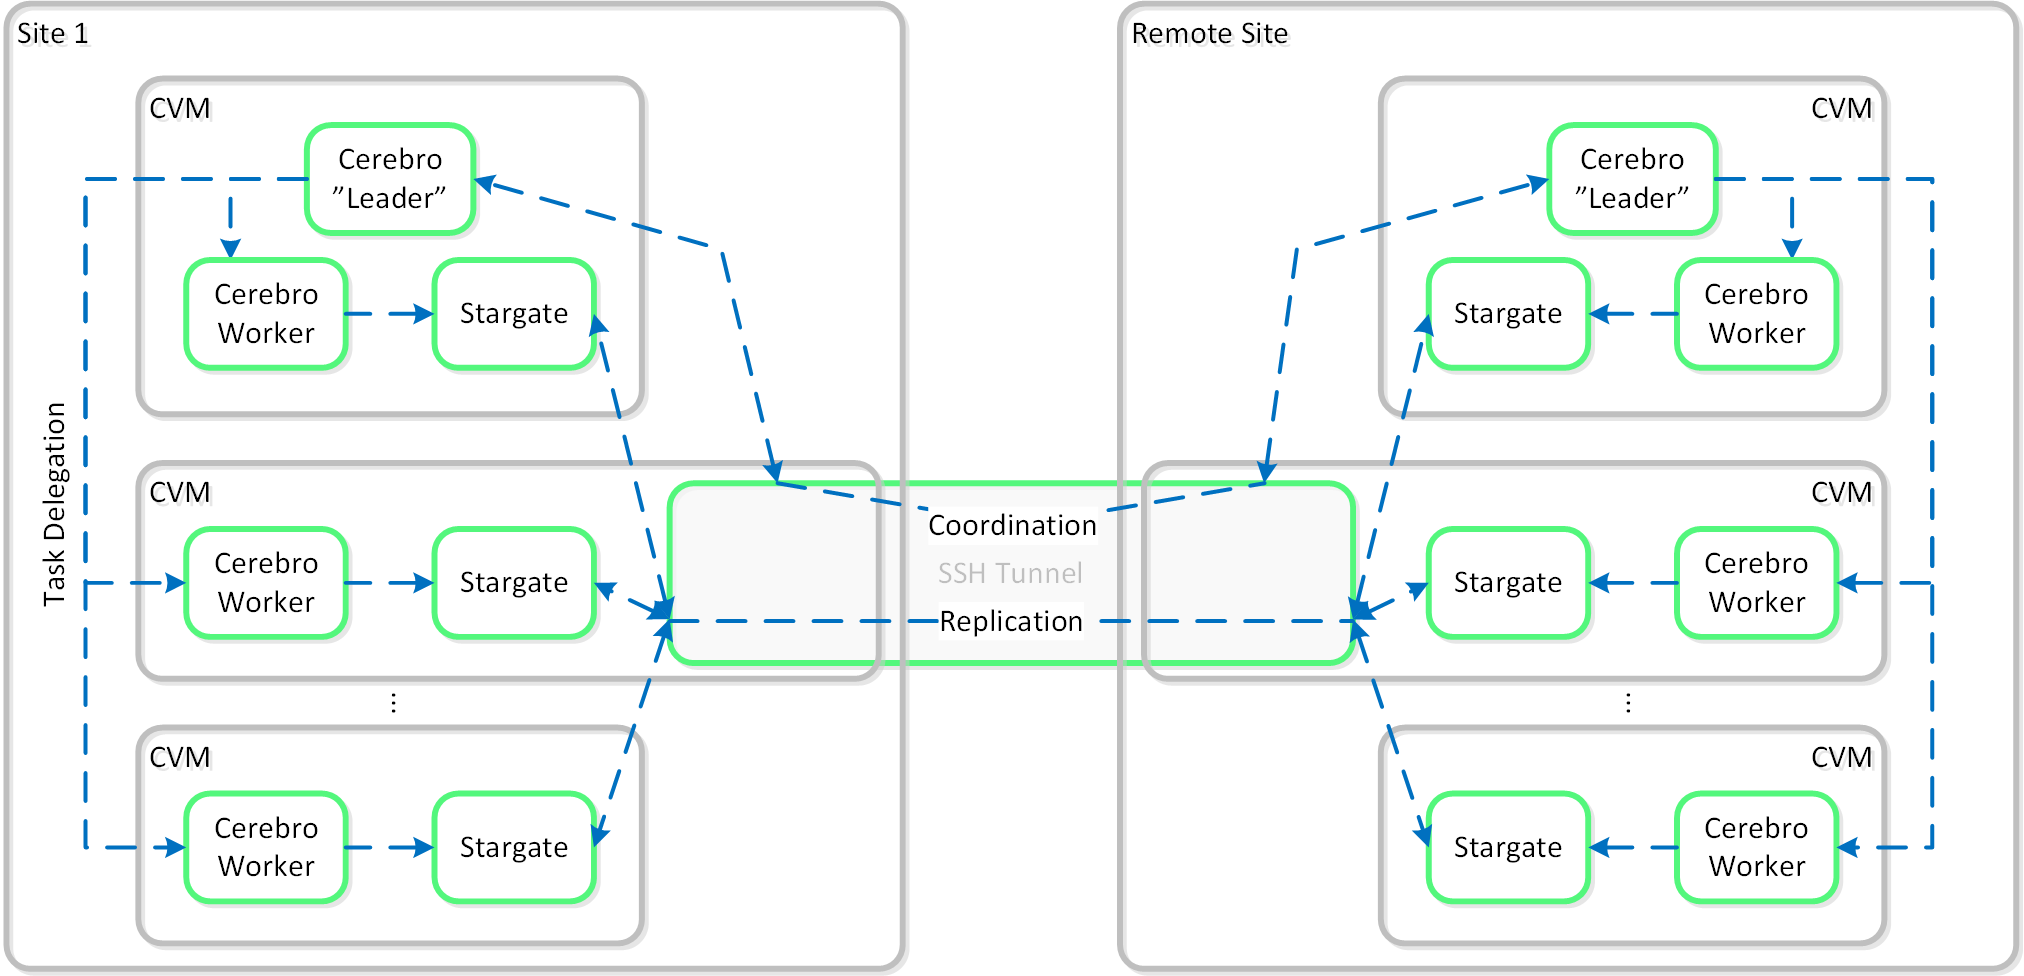 Replication Architecture - SSH Tunnel
Global Deduplication
As explained in the Elastic Deduplication Engine section above, DSF has the ability to deduplicate data by just updating metadata pointers. The same concept is applied to the DR and replication feature. Before sending data over the wire, DSF will query the remote site and check whether or not the fingerprint(s) already exist on the target (meaning the data already exists). If so, no data will be shipped over the wire and only a metadata update will occur. For data which doesn’t exist on the target, the data will be compressed and sent to the target site. At this point, the data existing on both sites is usable for deduplication.
The following figure shows an example three site deployment where each site contains one or more protection domains (PD):
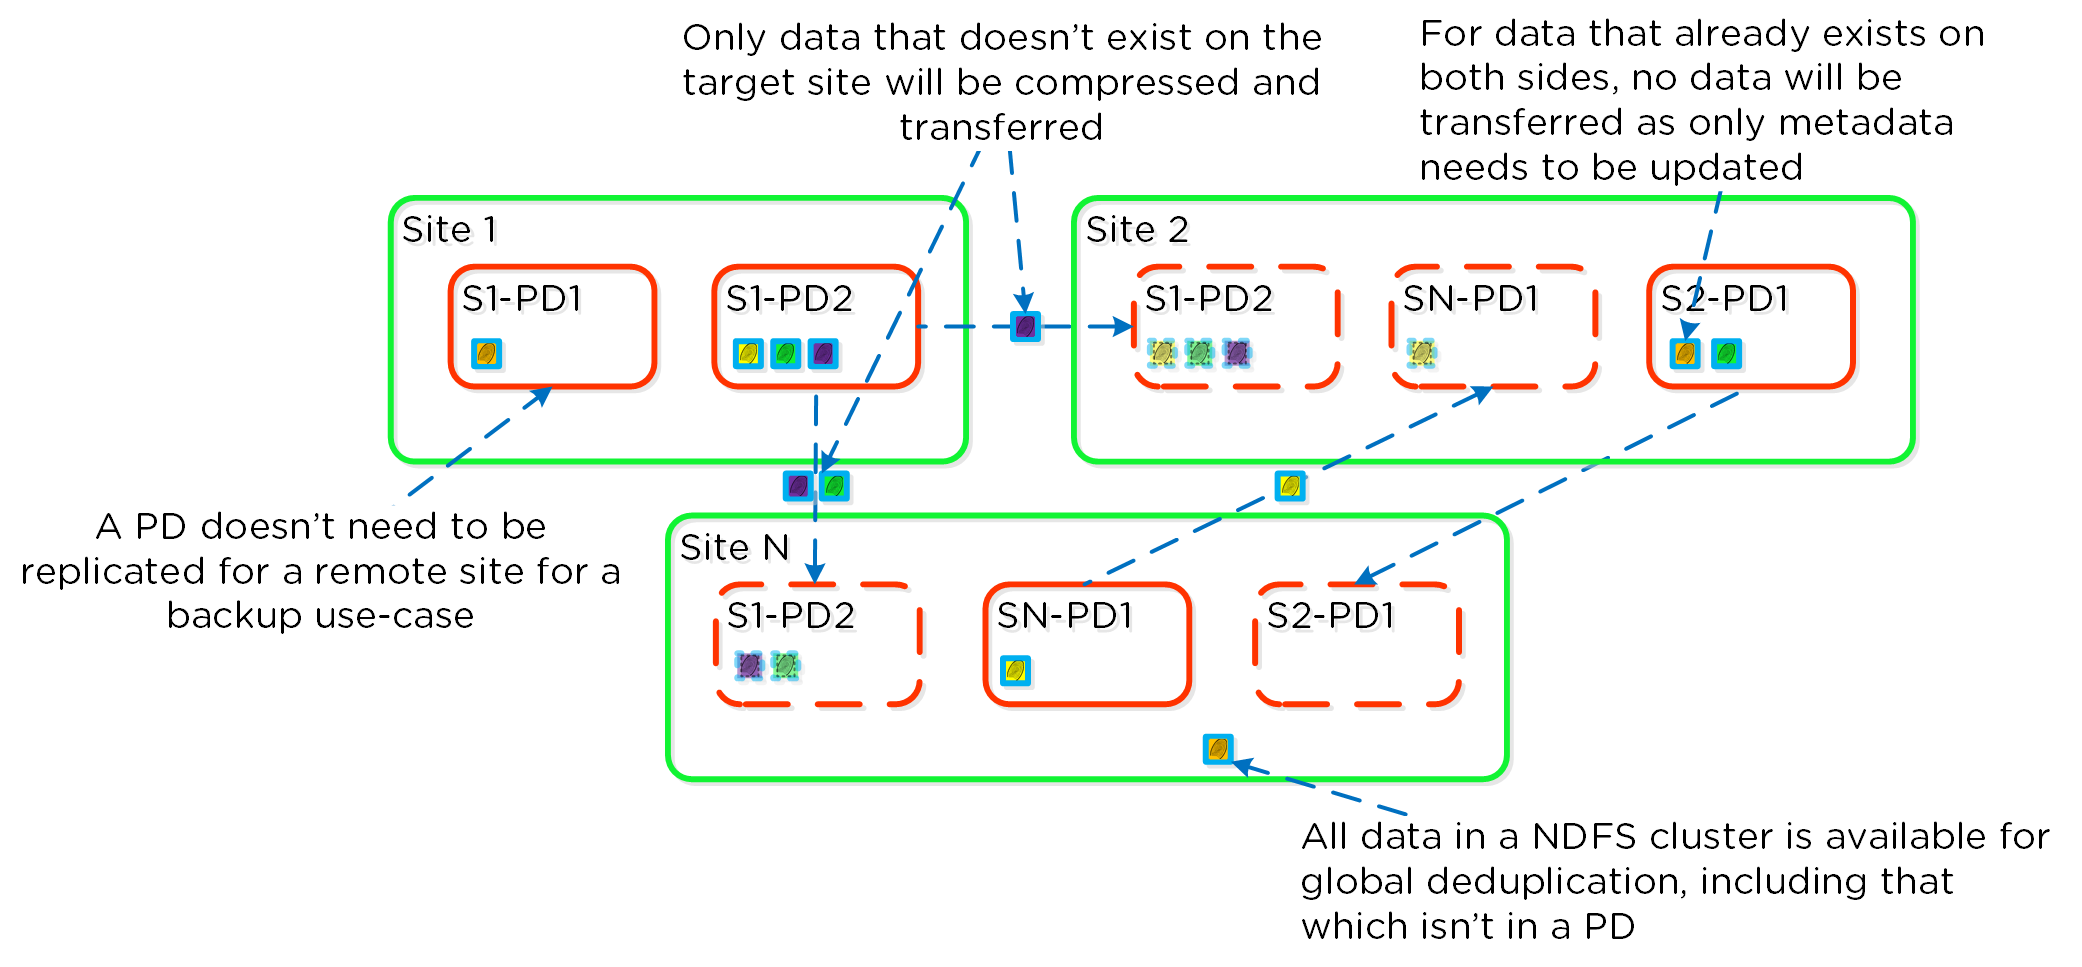 Replication Deduplication
Note
Note
Fingerprinting must be enabled on the source and target container / vstore for replication deduplication to occur.
NearSync
Building upon the traditional asynchronous (async) replication capabilities mentioned previously; Nutanix has introduced support for near synchronous replication (NearSync).
NearSync provides the best of both worlds: zero impact to primary I/O latency (like async replication) in addition to a very low RPO (like sync replication (metro)). This allows users have a very low RPO without having the overhead of requiring synchronous replication for writes.
This capability uses a new snapshot technology called light-weight snapshot (LWS). Unlike the traditional vDisk based snapshots used by async, this leverages markers and is completely OpLog based (vs. vDisk snapshots which are done in the Extent Store).
Mesos is a new service added to manage the snapshot layer and abstract the complexities of the full/incremental snapshots. Cerebro continues to manage the high-level constructs and policies (e.g. consistency groups, etc.) whereas Mesos is responsible for interacting with Stargate and controlling the LWS lifecycle.
The following figure shows an example of the communication between the NearSync components:
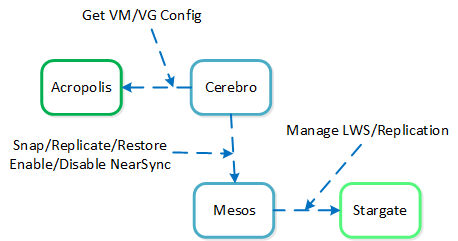 NearSync Component Interaction
When a user configures a snapshot frequency <= 15 minutes, NearSync is automatically leveraged. Upon this, an initial seed snapshot is taken then replicated to the remote site(s). Once this completes in < 60 minutes (can be the first or n later), another seed snapshot is immedatly taken and replicated in addition to LWS snapshot replication starting. Once the second seed snapshot finishes replication, all already replicated LWS snapshots become valid and the system is in stable NearSync.
The following figure shows an example timeline from enabling NearSync to execution:
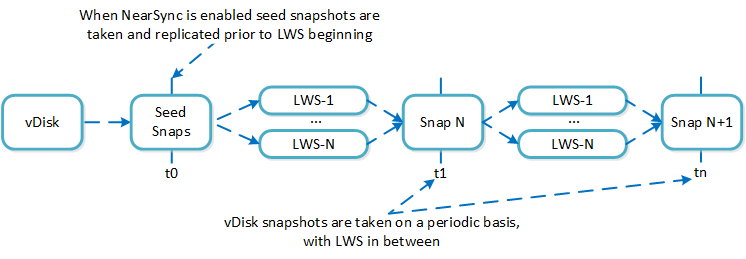 NearSync Replication Lifecycle
During a steady run state vDisk snapshots are taken every hour. Rather than sending the snapshot over to the remote site in addition to the LWS, the remote site composes the vDisk snapshot based upon the prior vDisk snapshot and the LWS from that time.
In the event NearSync falls out of sync (e.g. network outage, WAN latency, etc.) causing the LWS replication to take > 60 minutes, the system will automatically switch back to vDisk based snapshots. When one of these completes in < 60 minutes, the system will take another snapshot immediately as well as start replicating LWS. Once the full snapshot completes, the LWS snapshots become valid and the system is in stable NearSync. This process is similar to the initial enabling of NearSync.
When a LWS based snap is restored (or cloned), the system will take a clone of the latest vDisk snapshot and apply the LWS incrementally until the desired LWS is reached.
The following figure shows an example of how a LWS based snapshot is restored:
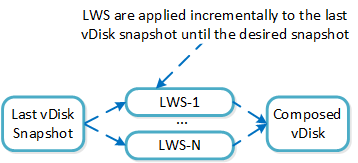 vDisk Restore from LWS
Metro Availability
Nutanix provides native “stretch clustering” capabilities which allow for a compute and storage cluster to span multiple physical sites. In these deployments, the compute cluster spans two locations and has access to a shared pool of storage.
This expands the VM HA domain from a single site to between two sites providing a near 0 RTO and a RPO of 0.
In this deployment, each site has its own Nutanix cluster, however the containers are “stretched” by synchronously replicating to the remote site before acknowledging writes.
The following figure shows a high-level design of what this architecture looks like:
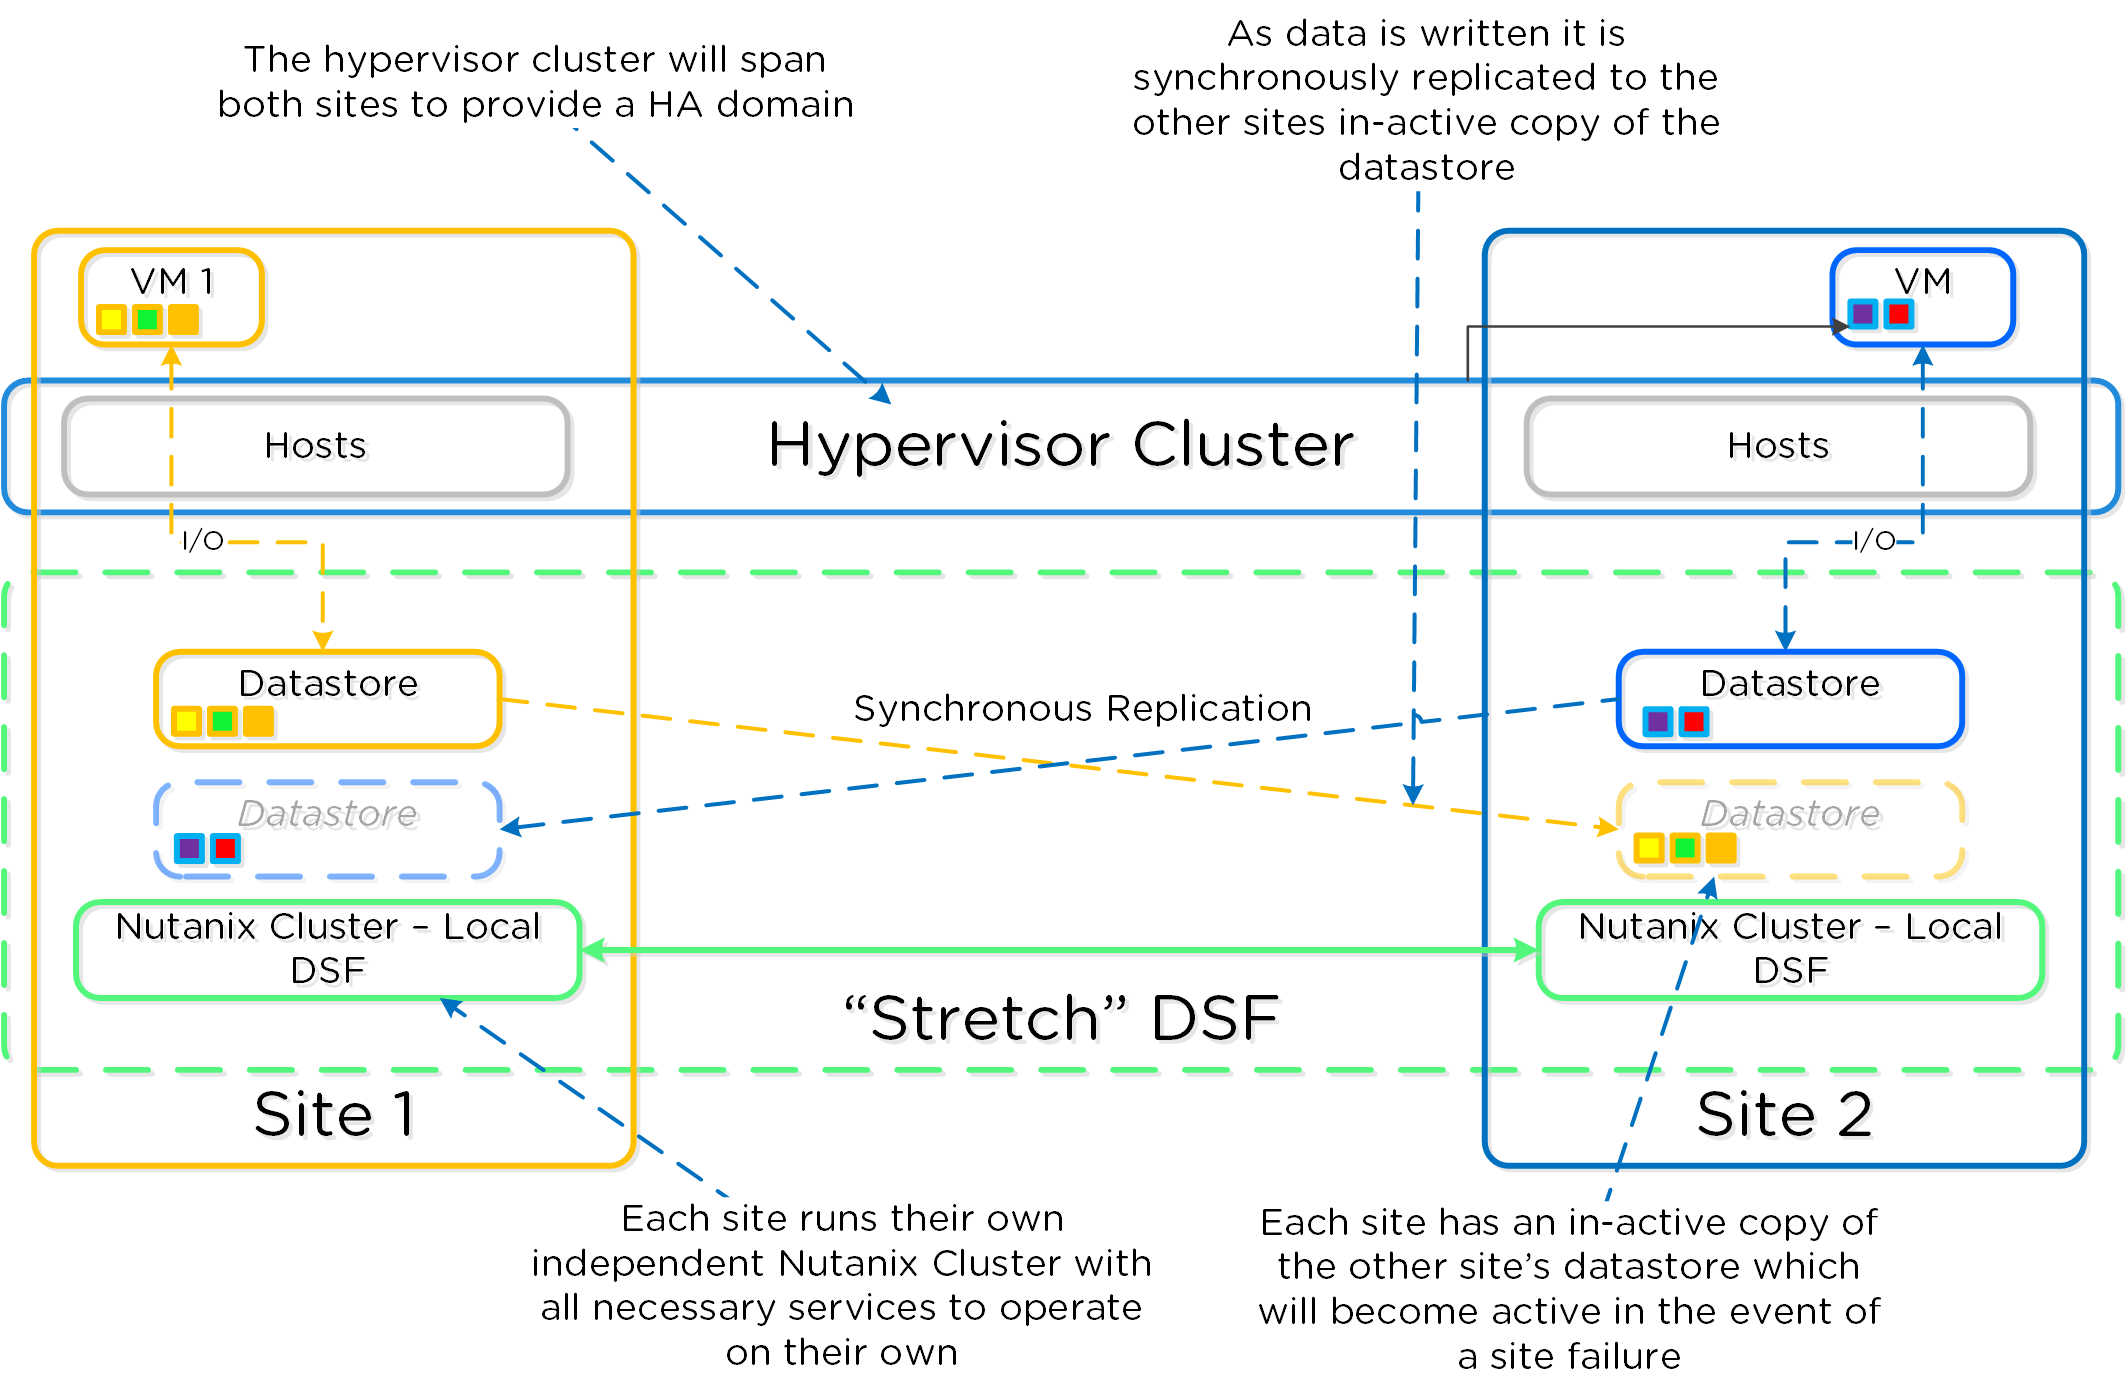 Metro Availability - Normal State
In the event of a site failure, an HA event will occur where the VMs can be restarted on the other site. The failover process is typically a manual process. With the AOS 5.0 release a Metro Witness can be configured which can automate the failover. The witness can be downloaded via the Portal and is configured via Prism.
The following figure shows an example site failure:
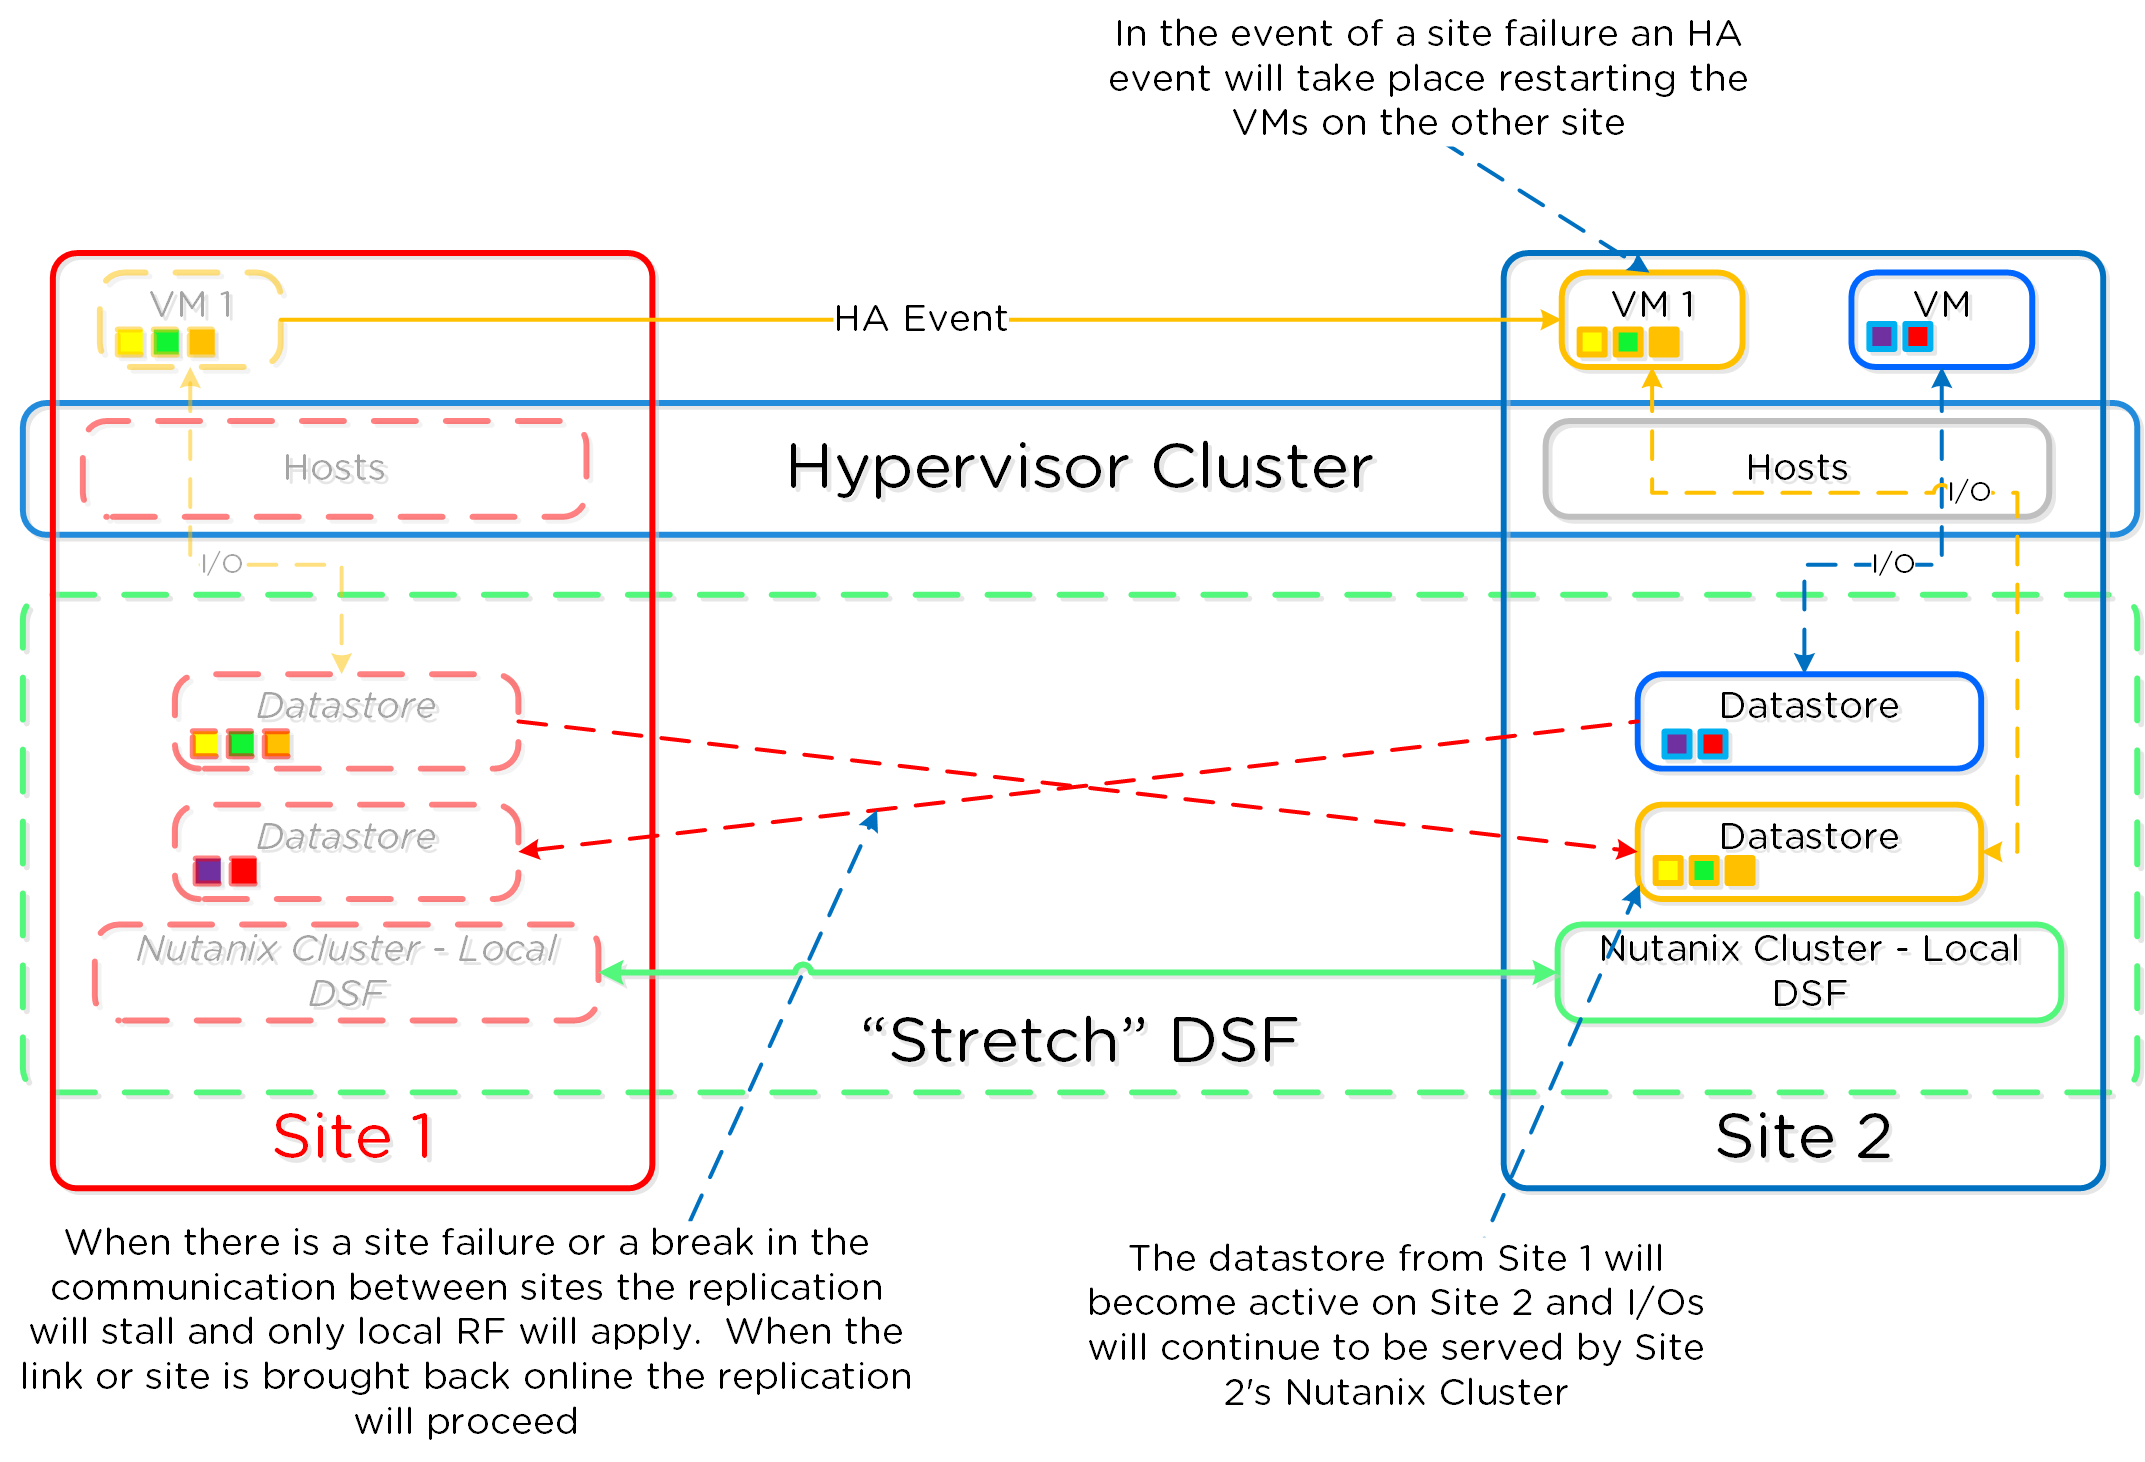 Metro Availability - Site Failure
In the event where there is a link failure between the two sites, each cluster will operate independently. Once the link comes back up, the sites will be re-synchronized (deltas-only) and synchronous replication will start occurring.
The following figure shows an example link failure:
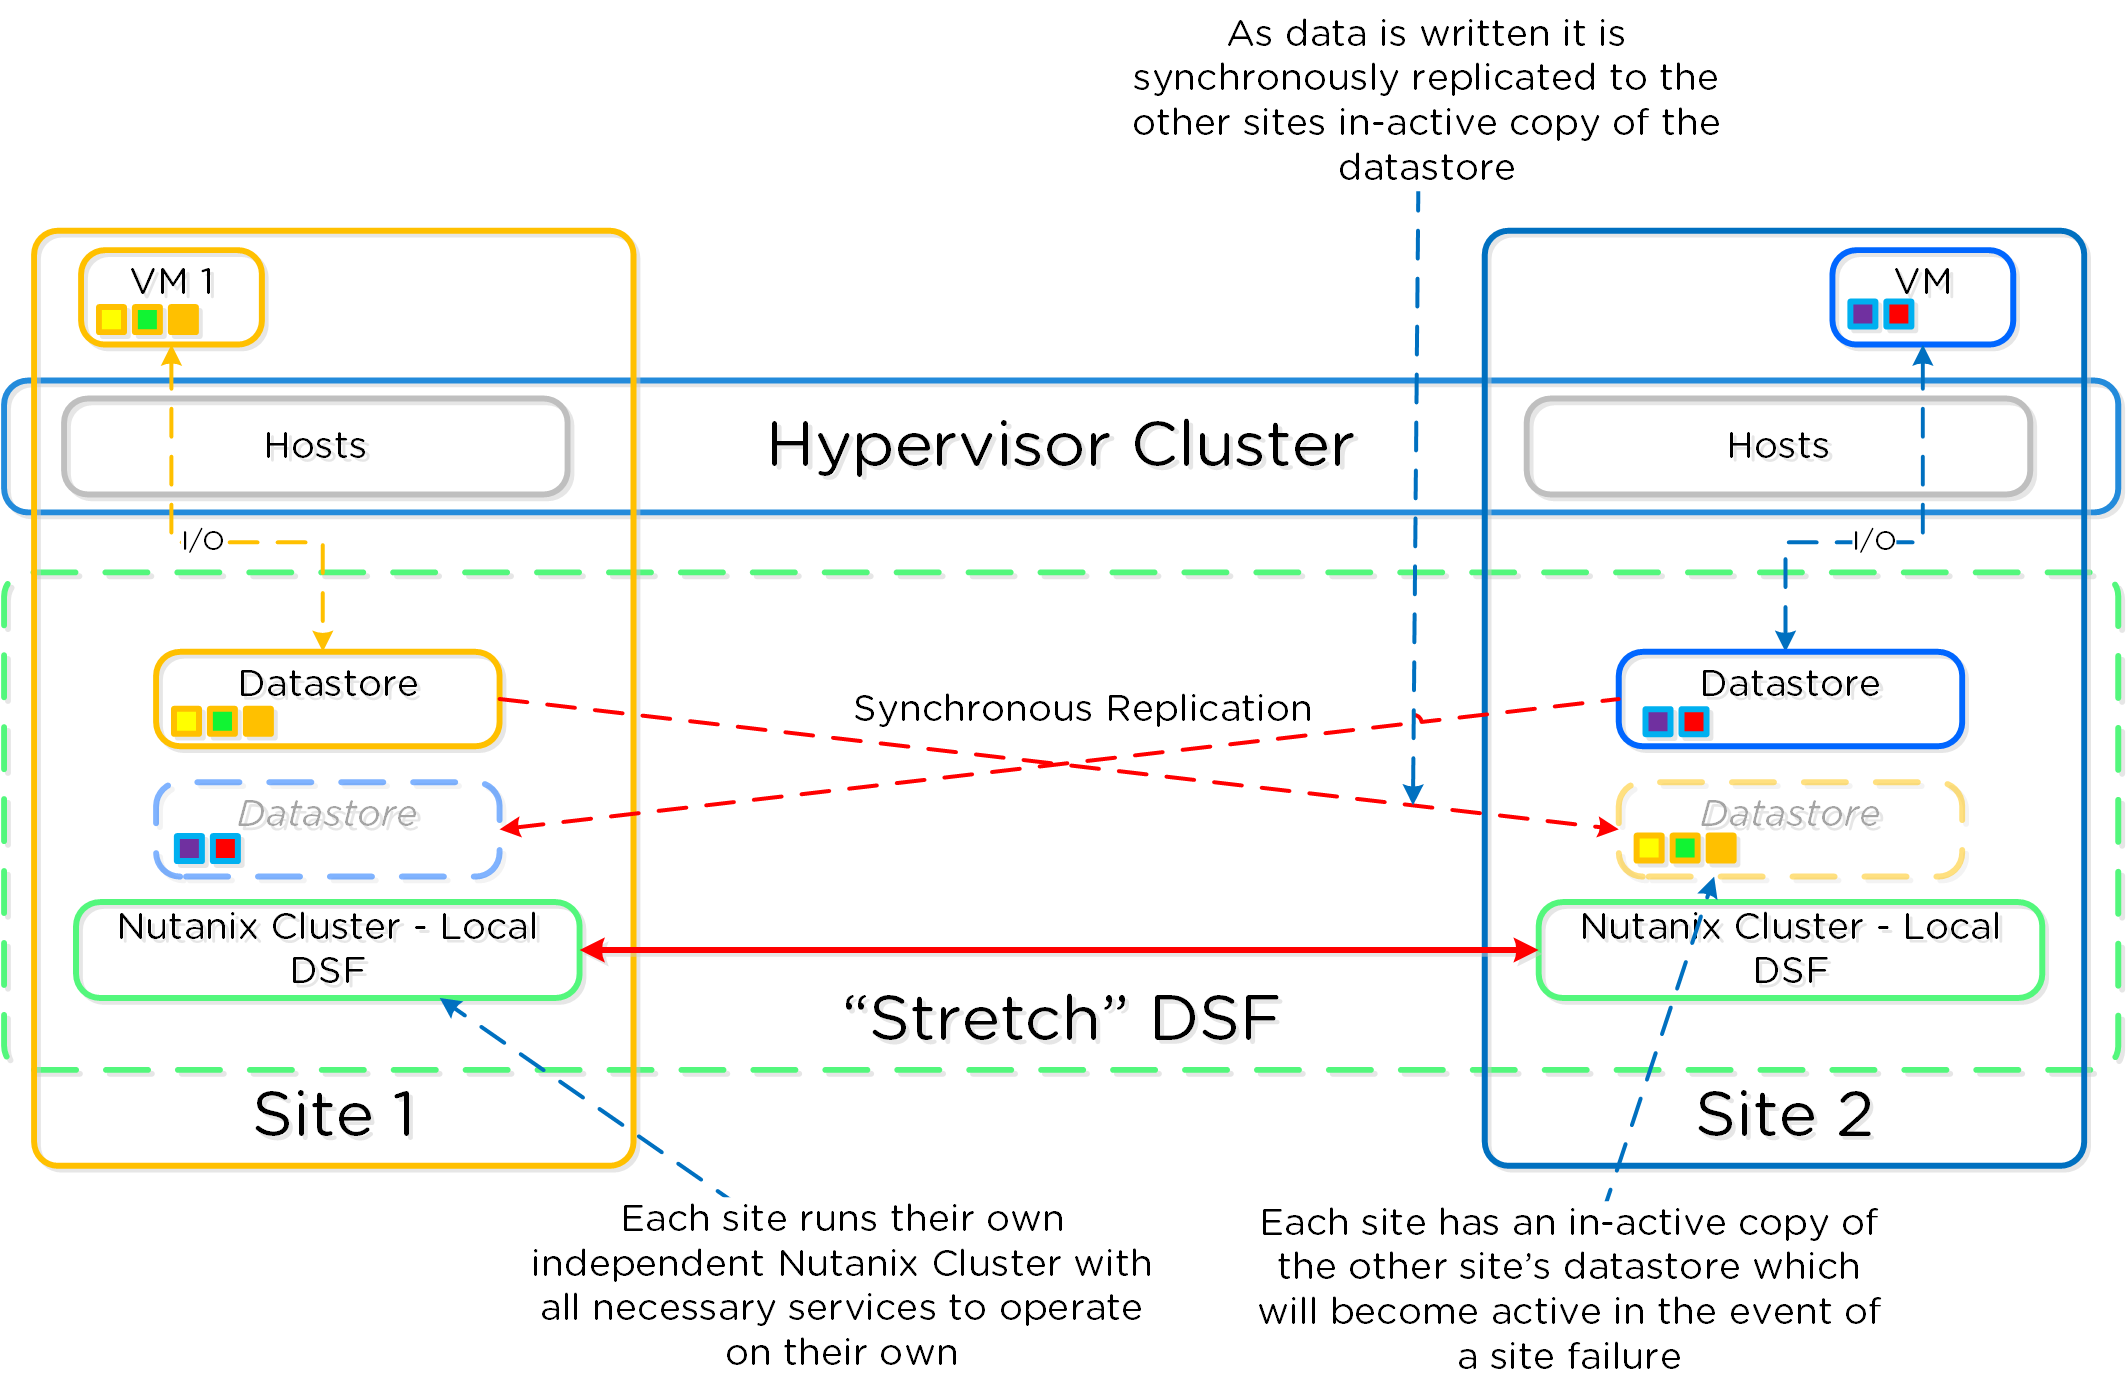 Metro Availability - Link Failure
» Download this section as PDF (opens in a new tab/window)
Important Pages
These are advanced Nutanix pages besides the standard user interface that allow you to monitor detailed stats and metrics. The URLs are formatted in the following way: http://<Nutanix CVM IP/DNS>:<Port/path (mentioned below)> Example: http://MyCVM-A:2009 NOTE: if you’re on a different subnet IPtables will need to be disabled on the CVM to access the pages.
2009 Page
This is a Stargate page used to monitor the back end storage system and should only be used by advanced users. I’ll have a post that explains the 2009 pages and things to look for.
2009/latency Page
This is a Stargate page used to monitor the back end latency.
2009/vdisk_stats Page
This is a Stargate page used to show various vDisk stats including histograms of I/O sizes, latency, write hits (e.g., OpLog, eStore), read hits (cache, SSD, HDD, etc.) and more.
2009/h/traces Page
This is the Stargate page used to monitor activity traces for operations.
2009/h/vars Page
This is the Stargate page used to monitor various counters.
2010 Page
This is the Curator page which is used for monitoring Curator runs.
2010/master/control Page
This is the Curator control page which is used to manually start Curator jobs
2011 Page
This is the Chronos page which monitors jobs and tasks scheduled by Curator.
2020 Page
This is the Cerebro page which monitors the protection domains, replication status and DR.
2020/h/traces Page
This is the Cerebro page used to monitor activity traces for PD operations and replication.
2030 Page
This is the main Acropolis page and shows details about the environment hosts, any currently running tasks and networking details.
2030/sched Page
This is an Acropolis page used to show information about VM and resource scheduling used for placement decisions. This page shows the available host resources and VMs running on each host.
2030/tasks Page
This is an Acropolis page used to show information about Acropolis tasks and their state. You can click on the task UUID to get detailed JSON about the task.
2030/vms Page
This is an Acropolis page used to show information about Acropolis VMs and details about them. You can click on the VM Name to connect to the console.
Cluster Commands
Check cluster status
Description: Check cluster status from the CLI
cluster status
Check local CVM service status
Description: Check a single CVM’s service status from the CLI
genesis status
Check upgrade status
upgrade_status
Perform manual / cli upgrade
download NUTANIXINSTALLERPACKAGE.tar.gz into ~/tmp
tar xzf NUTANIXINSTALLERPACKAGE.tar.gz
cd ~/tmp
./install/bin/cluster -i ./install upgrade
Node(s) upgrade
Hypervisor upgrade status
Description: Check hypervisor upgrade status from the CLI on any CVM
host_upgrade_status
Detailed logs (on every CVM)
~/data/logs/host_upgrade.out
Restart cluster service from CLI
Description: Restart a single cluster service from the CLI
Stop service
cluster stop ServiceName
Start stopped services
cluster start #NOTE: This will start all stopped services
Start cluster service from CLI
Description: Start stopped cluster services from the CLI
Start stopped services
cluster start #NOTE: This will start all stopped services
OR
Start single service
Start single service: cluster start ServiceName
Restart local service from CLI
Description: Restart a single cluster service from the CLI
Stop Service
genesis stop ServiceName
Start Service
cluster start
Start local service from CLI
Description: Start stopped cluster services from the CLI
cluster start #NOTE: This will start all stopped services
Cluster add node from cmdline
Description: Perform cluster add-node from CLI
ncli cluster discover-nodes | egrep “Uuid” | awk ‘{print $4}’ | xargs -I UUID ncli cluster add-node node-uuid=UUID </pre>
Find cluster id
Description: Find the cluster ID for the current cluster
zeus_config_printer | grep cluster_id
Open port
Description: Enable port through IPtables
sudo vi /etc/sysconfig/iptables -A INPUT -m state --state NEW -m tcp -p tcp --dport PORT -j ACCEPT
sudo service iptables restart
Check for Shadow Clones
Description: Displays the shadow clones in the following format: name#id@svm_id
vdisk_config_printer | grep '#'
Reset Latency Page Stats
Description: Reset the Latency Page (CVM IP):2009/latency) counters
allssh "wget 127.0.0.1:2009/latency/reset"
Find vDisk information
Description: Find vDisk information and details including name, id, size, iqn and others
vdisk_config_printer
Find Number of vDisks
Description: Find the current number of vDisks (files) on DSF
vdisk_config_printer | grep vdisk_id | wc -l
Get detailed vDisk information
Description: Displays a provided vDisks egroup IDs, size, transformation and savings, garbage and replica placement
vdisk_usage_printer -vdisk_id=VDISK_ID
Start Curator scan from CLI
Description: Starts a Curator scan from the CLI
Full Scan
allssh "wget -O - "http://localhost:2010/master/api/client/StartCuratorTasks?task_type=2";"
Partial Scan
allssh "wget -O - "http://localhost:2010/master/api/client/StartCuratorTasks?task_type=3";"
Refresh Usage
allssh "wget -O - "http://localhost:2010/master/api/client/RefreshStats";"
Check under replicated data via CLI
Description: Check for under replicated data using curator_cli
curator_cli get_under_replication_info summary=true
Compact ring
Description: Compact the metadata ring
allssh "nodetool -h localhost compact"
Find NOS version
Description: Find the NOS version (NOTE: can also be done using NCLI)
allssh "cat /etc/nutanix/release_version"
Find CVM version
Description: Find the CVM image version
allssh "cat /etc/nutanix/svm-version"
Manually fingerprint vDisk(s)
Description: Create fingerprints for a particular vDisk (For dedupe) NOTE: dedupe must be enabled on the container
vdisk_manipulator –vdisk_id=vDiskID --operation=add_fingerprints
Manually fingerprint all vDisk(s)
Description: Create fingerprints for all vDisk(s) (For dedupe) NOTE: dedupe must be enabled on the container
for vdisk in `vdisk_config_printer | grep vdisk_id | awk {'print $2'}`; do vdisk_manipulator -vdisk_id=$vdisk --operation=add_fingerprints; done
Echo Factory_Config.json for all cluster nodes
Description: Echos the factory_config.jscon for all nodes in the cluster
allssh "cat /etc/nutanix/factory_config.json"
Upgrade a single Nutanix node’s NOS version
Description: Upgrade a single node’s NOS version to match that of the cluster
~/cluster/bin/cluster -u NEW_NODE_IP upgrade_node
List files (vDisk) on DSF
Description: List files and associated information for vDisks stored on DSF
Nfs_ls
Get help text
Nfs_ls --help
Install Nutanix Cluster Check (NCC)
Description: Installs the Nutanix Cluster Check (NCC) health script to test for potential issues and cluster health
Download NCC from the Nutanix Support Portal (portal.nutanix.com)
SCP .tar.gz to the /home/nutanix directory
Untar NCC .tar.gz
tar xzmf ncc.tar.gz --recursive-unlink
Run install script
./ncc/bin/install.sh -f ncc.tar.gz
Create links
source ~/ncc/ncc_completion.bash
echo "source ~/ncc/ncc_completion.bash" >> ~/.bashrc
Run Nutanix Cluster Check (NCC)
Description: Runs the Nutanix Cluster Check (NCC) health script to test for potential issues and cluster health. This is a great first step when troubleshooting any cluster issues.
Make sure NCC is installed (steps above)
Run NCC health checks
ncc health_checks run_all
List tasks using progress monitor cli
progress_monitor_cli -fetchall
Remove task using progress monitor cli
progress_monitor_cli --entity_id=ENTITY_ID --operation=OPERATION --entity_type=ENTITY_TYPE --delete
# NOTE: operation and entity_type should be all lowercase with k removed from the begining
Metrics and Thresholds
The following section will cover specific metrics and thresholds on the Nutanix back end. More updates to these coming shortly!
Gflags
More coming soon!
Troubleshooting & Advanced Administration
Find Acropolis logs
Description: Find Acropolis logs for the cluster
allssh "cat ~/data/logs/Acropolis.log"
Find cluster error logs
Description: Find ERROR logs for the cluster
allssh "cat ~/data/logs/COMPONENTNAME.ERROR"
Example for Stargate
allssh "cat ~/data/logs/Stargate.ERROR"
Find cluster fatal logs
Description: Find FATAL logs for the cluster
allssh "cat ~/data/logs/COMPONENTNAME.FATAL"
Example for Stargate
allssh "cat ~/data/logs/Stargate.FATAL"
Using the 2009 Page (Stargate)
In most cases Prism should be able to give you all of the information and data points you require. However, in certain scenarios, or if you want some more detailed data you can leverage the Stargate aka 2009 page. The 2009 page can be viewed by navigating to CVMIP:2009.
Note
Accessing back-end pages
If you're on a different network segment (L2 subnet) you'll need to add a rule in IP tables to access any of the back-end pages.
At the top of the page is the overview details which show various details about the cluster:
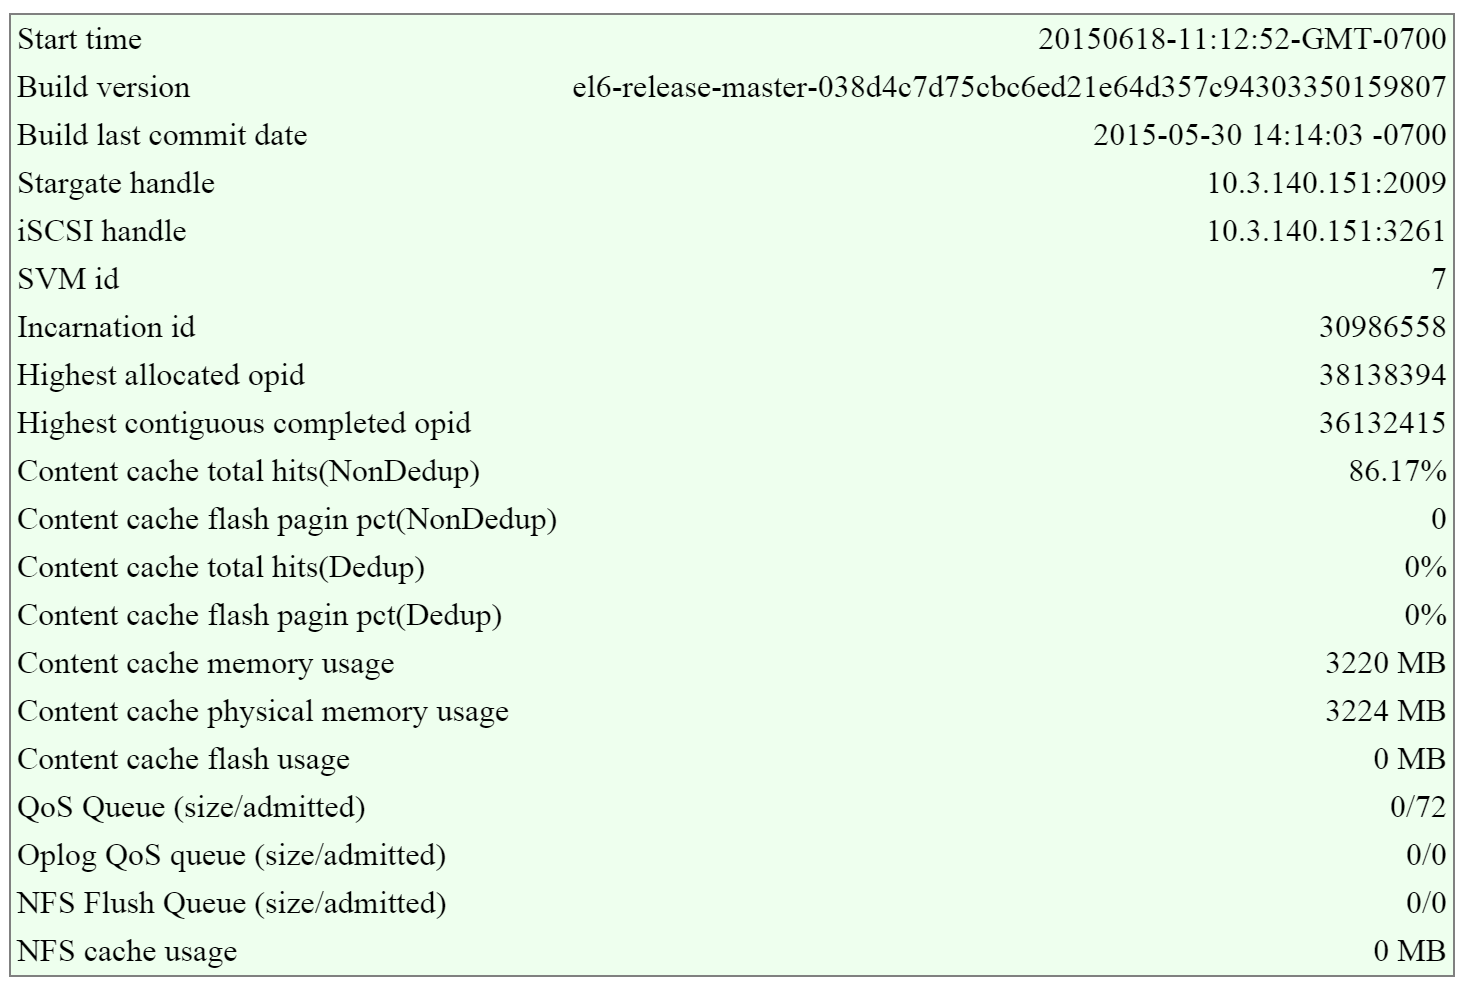 2009 Page - Stargate Overview
In this section there are two key areas to look out for, the first being the I/O queues that shows the number of admitted / outstanding operations.
The figure shows the queues portion of the overview section:
 2009 Page - Stargate Overview - Queues
The second portion is the unified cache details that shows information on cache sizes and hit rates.
The figure shows the unified cache portion of the overview section:
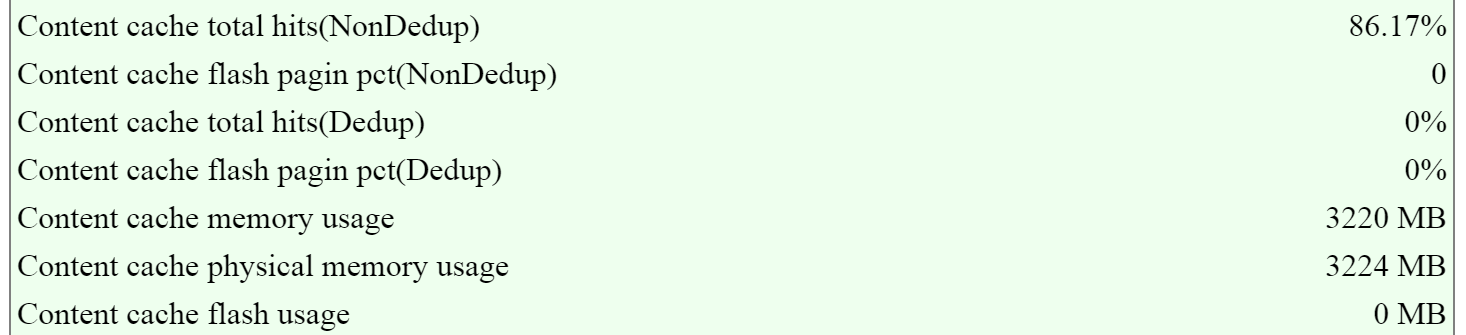 2009 Page - Stargate Overview - Unified Cache
Note
Pro tip
In ideal cases the hit rates should be above 80-90%+ if the workload is read heavy for the best possible read performance.
NOTE: these values are per Stargate / CVM
The next section is the ‘Cluster State’ that shows details on the various Stargates in the cluster and their disk usages.
The figure shows the Stargates and disk utilization (available/total):
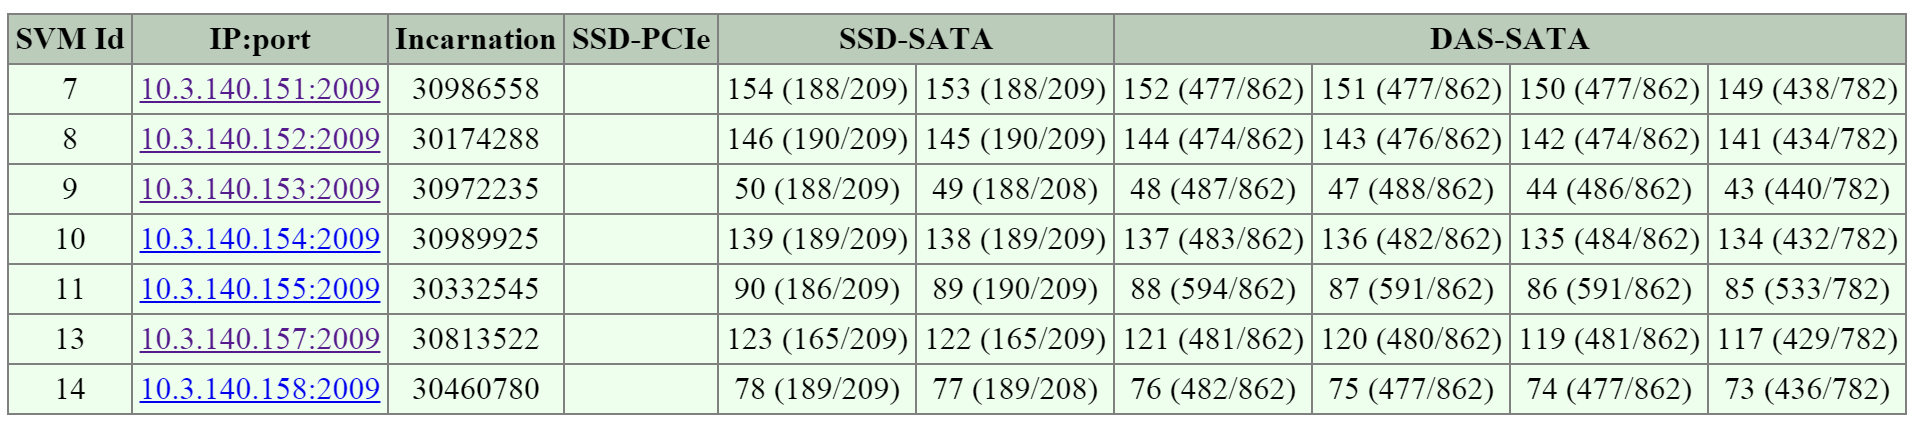 2009 Page - Cluster State - Disk Usage
The next section is the ‘NFS Worker’ section which will show various details and stats per vDisk.
The figure shows the vDisks and various I/O details:
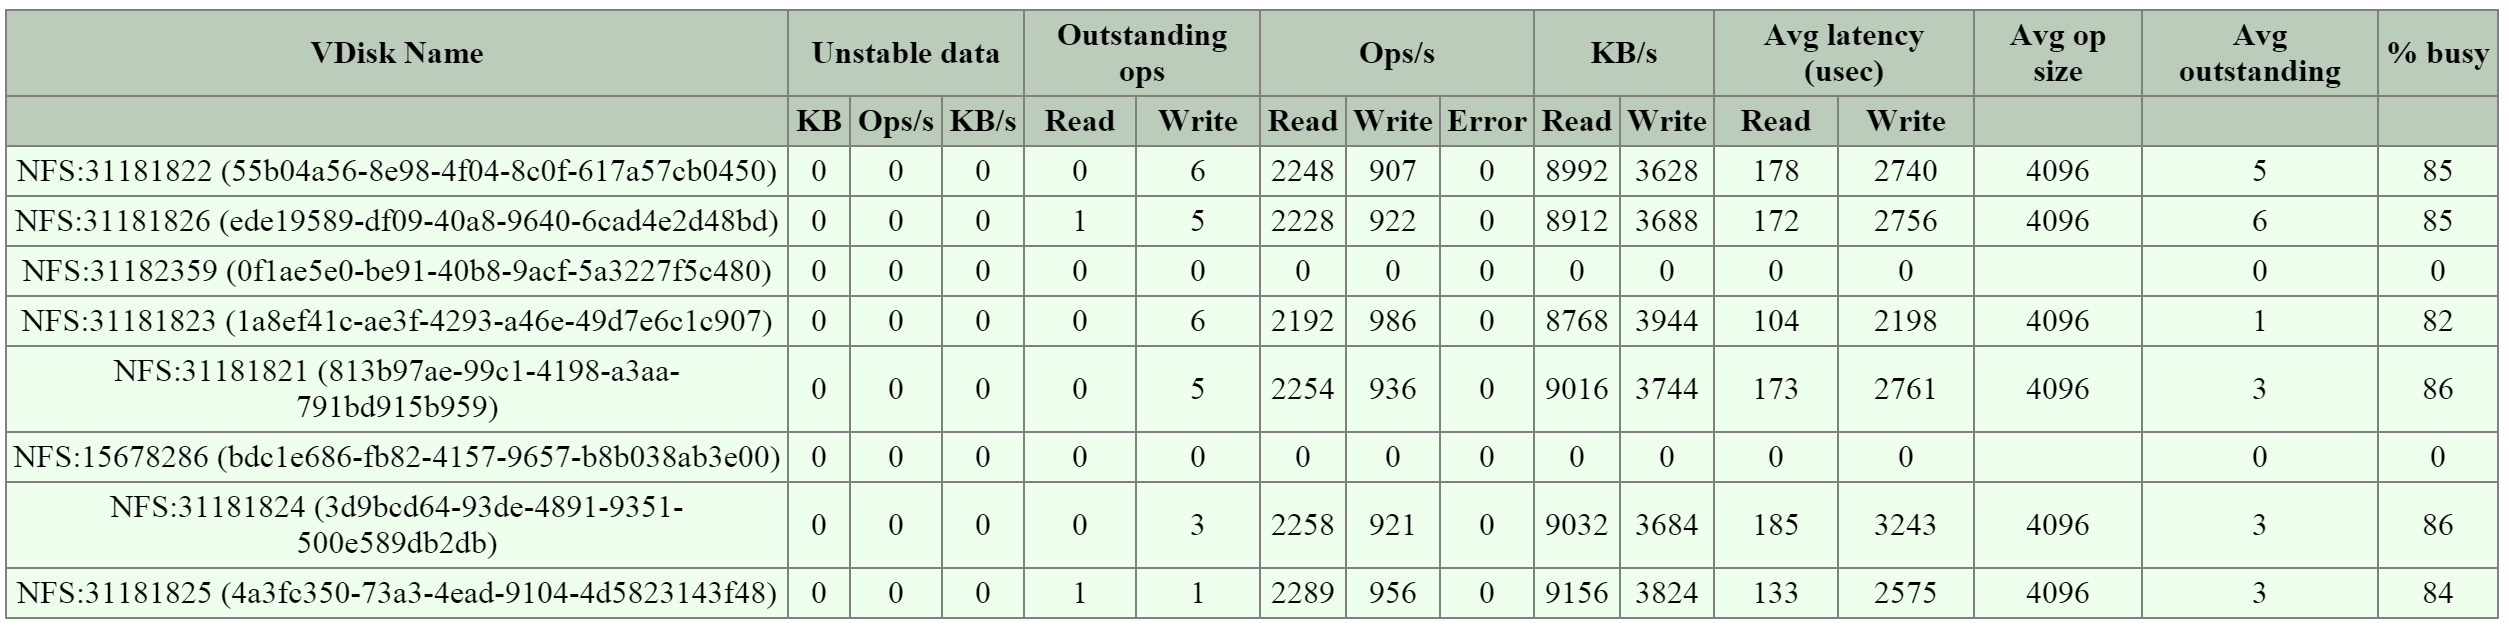 2009 Page - NFS Worker - vDisk Stats
Note
Pro tip
When looking at any potential performance issues the following metrics should be looked at:
- Avg. latency
- Avg. op size
- Avg. outstanding
For more specific details the vdisk_stats page holds a plethora of information.
Using the 2009/vdisk_stats Page
The 2009 vdisk_stats page is a detailed page which provides even further data points per vDisk. This page includes details and a histogram of items like randomness, latency histograms, I/O sizes and working set details.
You can navigate to the vdisk_stats page by clicking on the ‘vDisk Id’ in the left hand column.
The figure shows the section and hyperlinked vDisk Id:
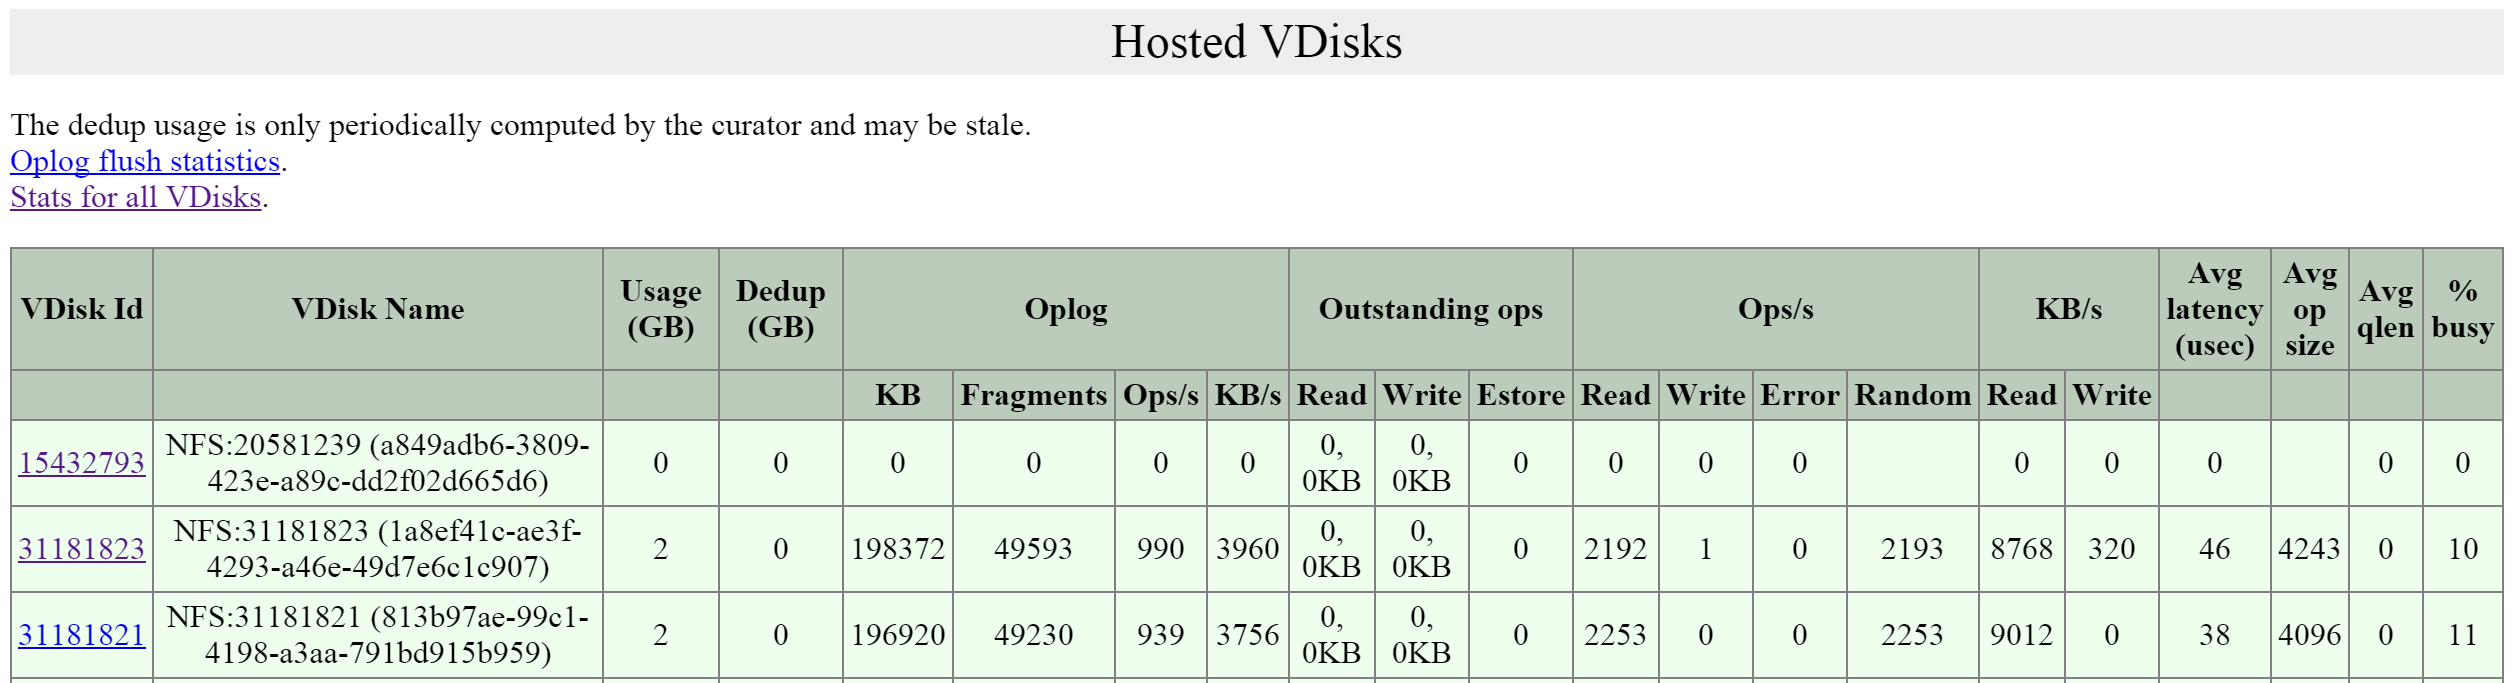 2009 Page - Hosted vDisks
This will bring you to the vdisk_stats page which will give you the detailed vDisk stats. NOTE: These values are real-time and can be updated by refreshing the page.
The first key area is the ‘Ops and Randomness’ section which will show a breakdown of whether the I/O patterns are random or sequential in nature.
The figure shows the ‘Ops and Randomness’ section:
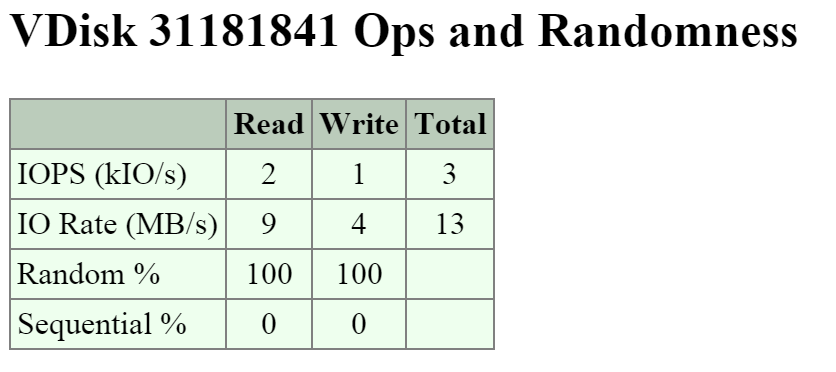 2009 Page - vDisk Stats - Ops and Randomness
The next area shows a histogram of the frontend read and write I/O latency (aka the latency the VM / OS sees).
The figure shows the ‘Frontend Read Latency’ histogram:
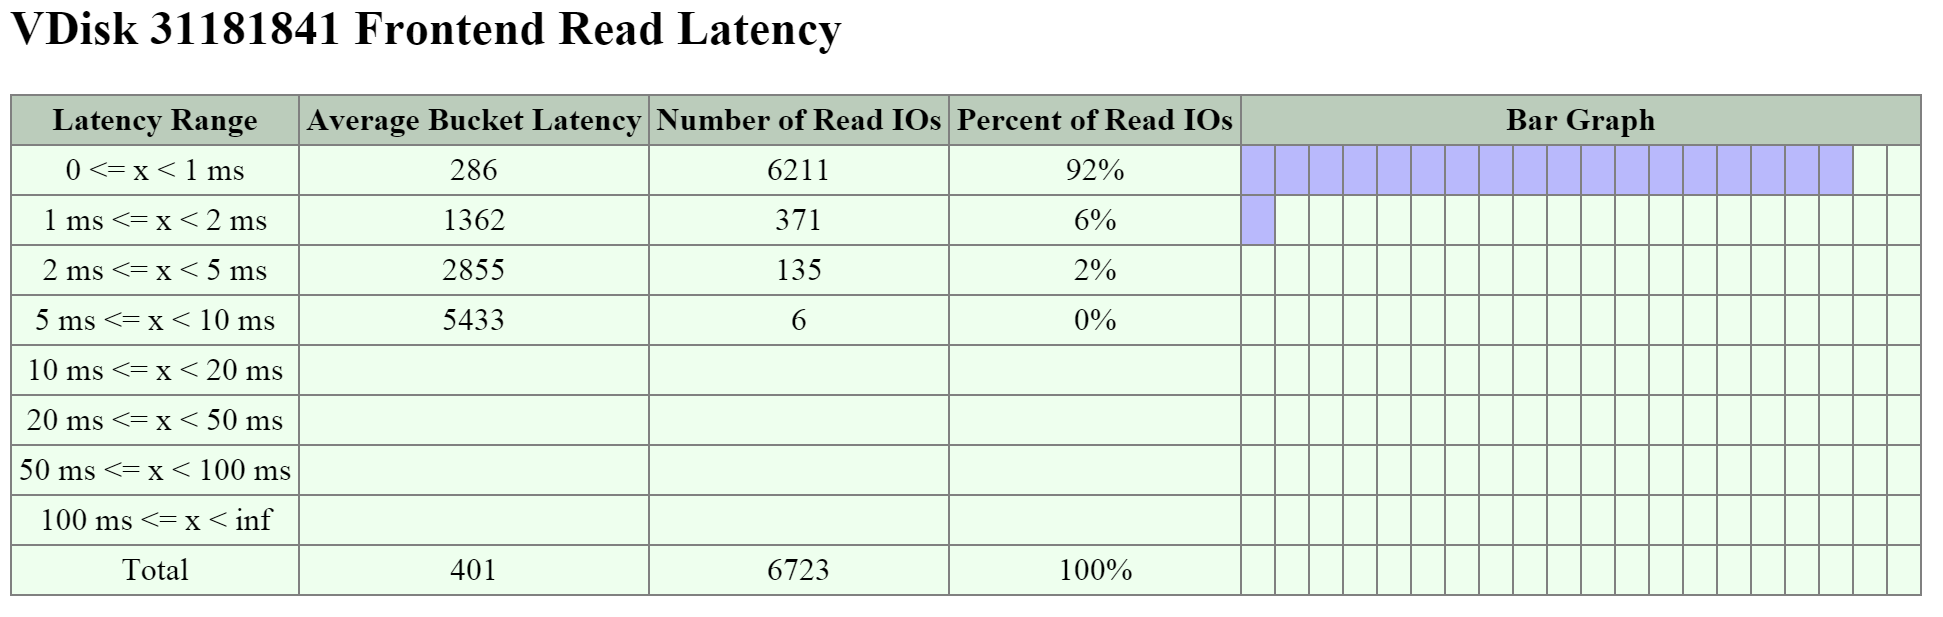 2009 Page - vDisk Stats - Frontend Read Latency
The figure shows the ‘Frontend Write Latency’ histogram:
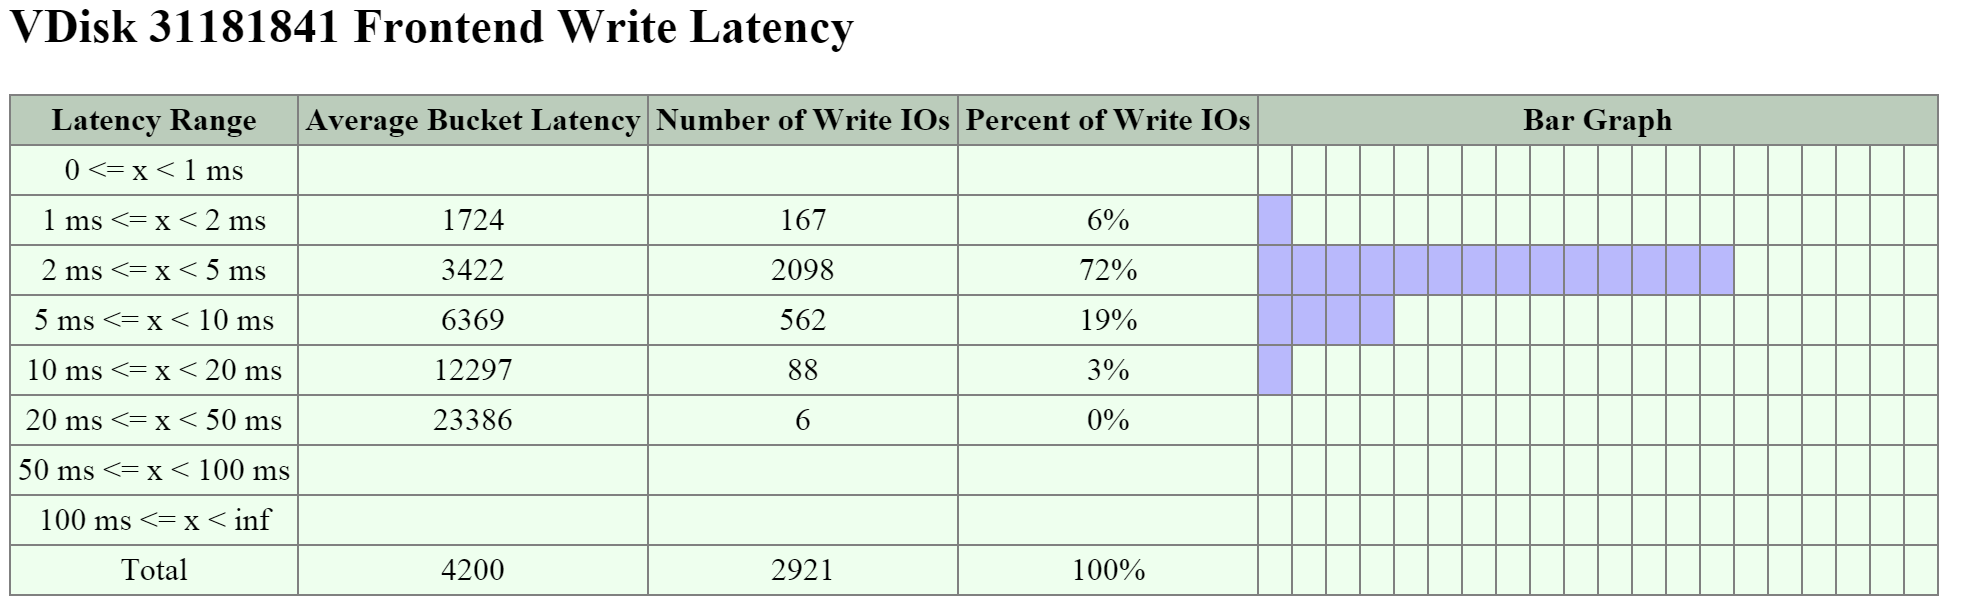 2009 Page - vDisk Stats - Frontend Write Latency
The next key area is the I/O size distribution that shows a histogram of the read and write I/O sizes.
The figure shows the ‘Read Size Distribution’ histogram:
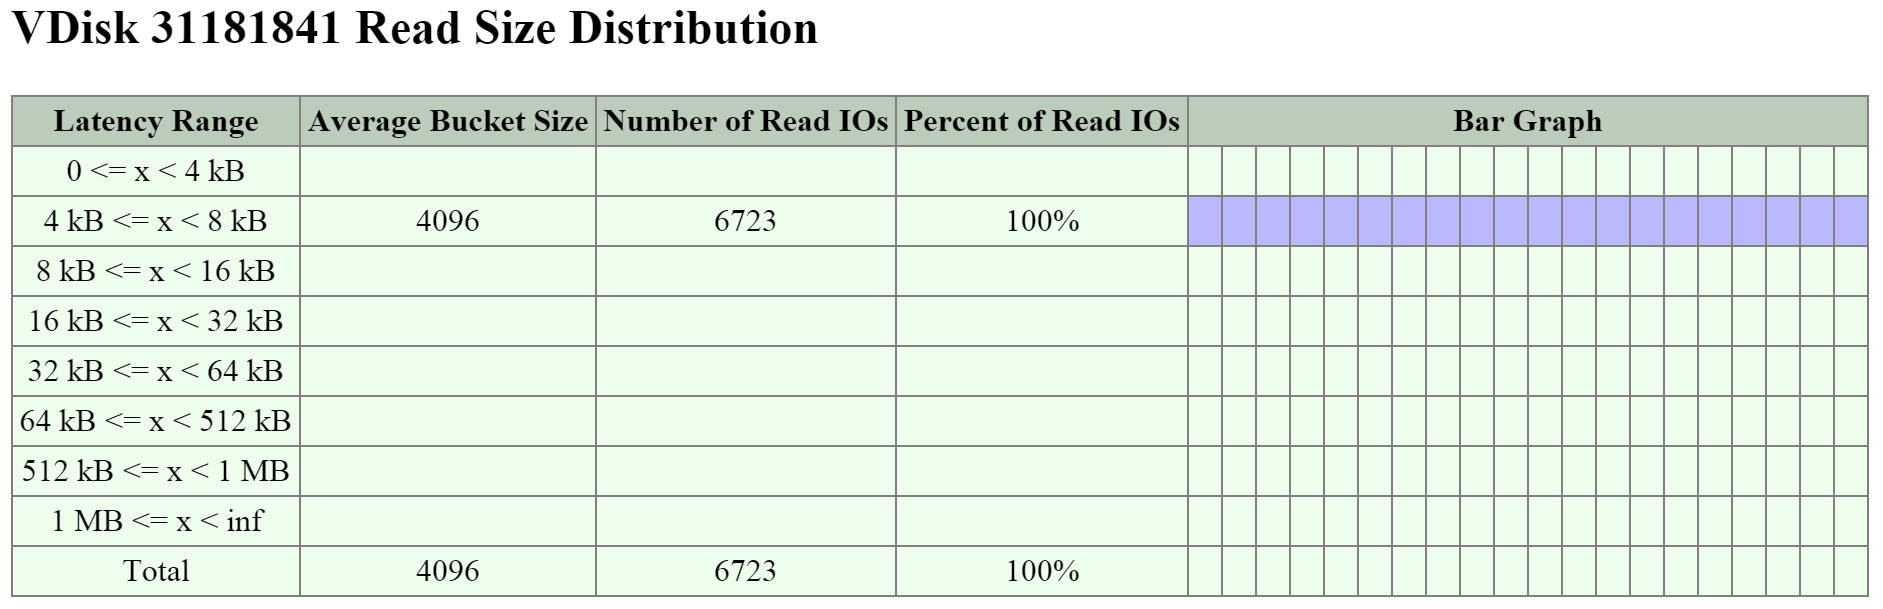 2009 Page - vDisk Stats - Read I/O Size
The figure shows the ‘Write Size Distribution’ histogram:
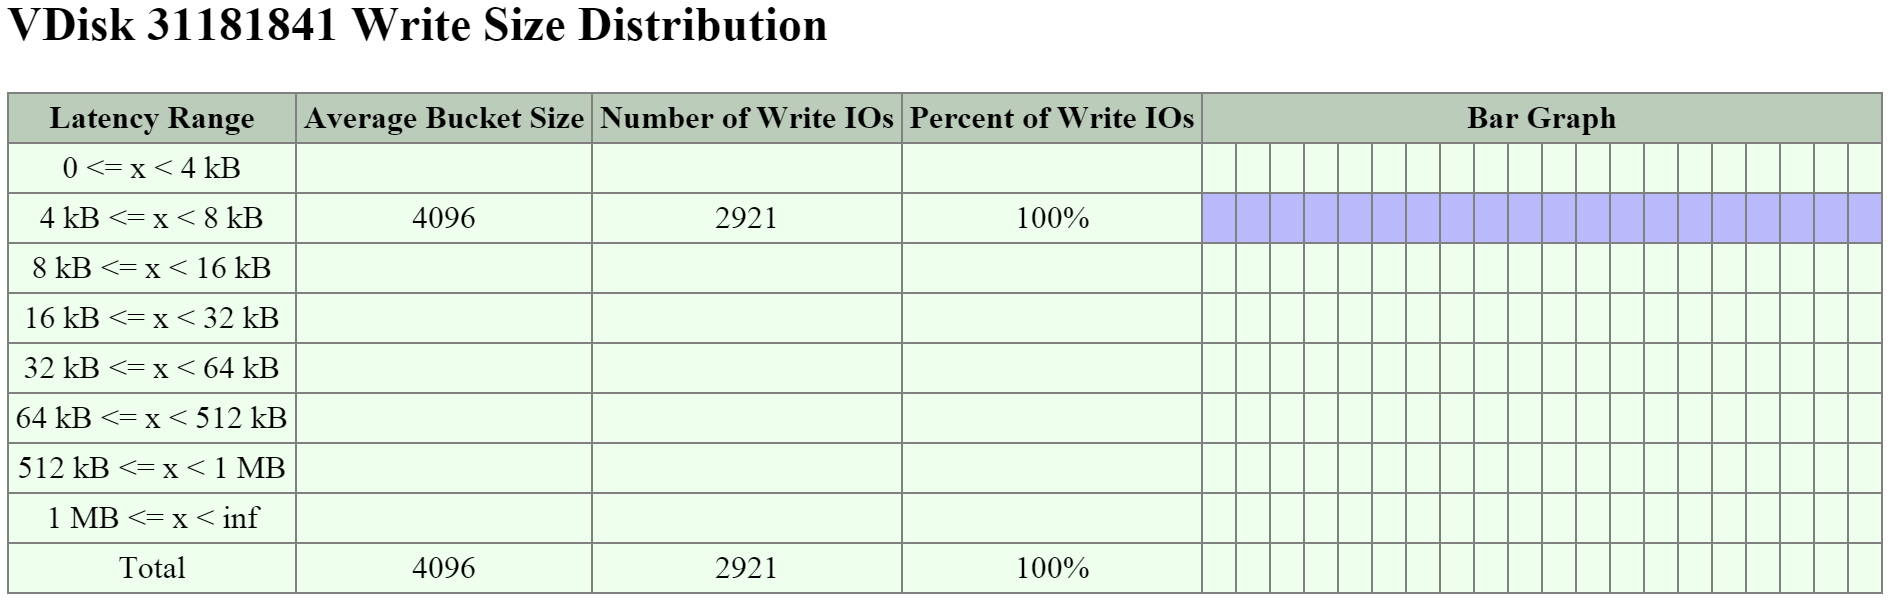 2009 Page - vDisk Stats - Write I/O Size
The next key area is the ‘Working Set Size’ section which provides insight on working set sizes for the last 2 minutes and 1 hour. This is broken down for both read and write I/O.
The figure shows the ‘Working Set Sizes’ table:
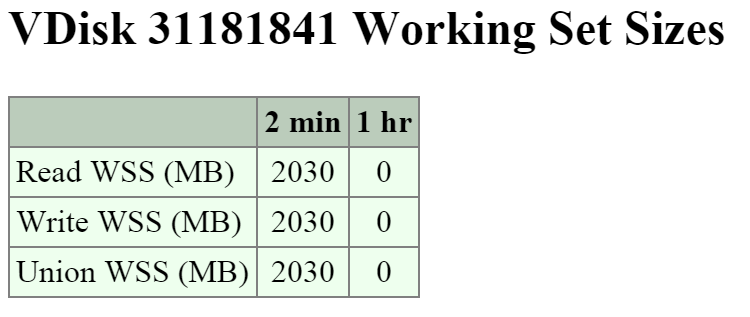 2009 Page - vDisk Stats - Working Set
The ‘Read Source’ provides details on which tier or location the read I/Os are being served from.
The figure shows the ‘Read Source’ details:
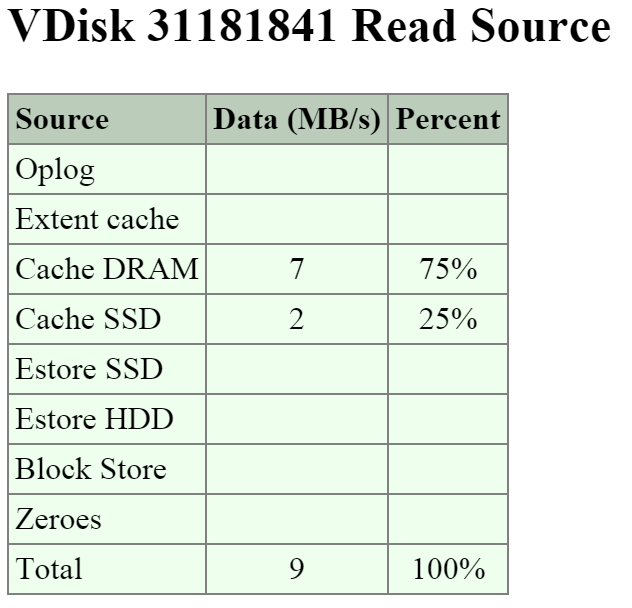 2009 Page - vDisk Stats - Read Source
Note
Pro tip
If you're seeing high read latency take a look at the read source for the vDisk and take a look where the I/Os are being served from. In most cases high latency could be caused by reads coming from HDD (Estore HDD).
The ‘Write Destination’ section will show where the new write I/O are coming in to.
The figure shows the ‘Write Destination’ table:
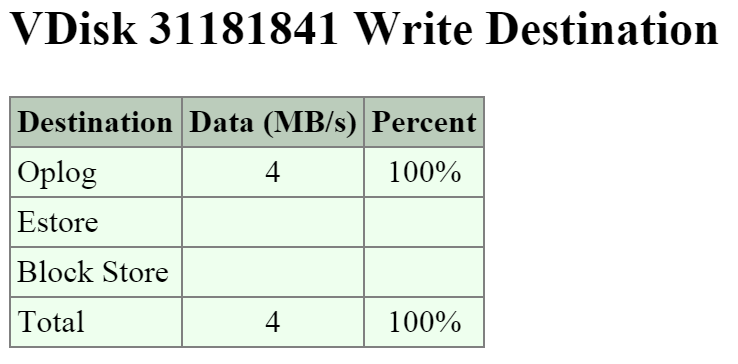 2009 Page - vDisk Stats - Write Destination
Note
Pro tip
Random I/Os will be written to the Oplog, sequential I/Os will bypass the Oplog and be directly written to the Extent Store (Estore).
Another interesting data point is what data is being up-migrated from HDD to SSD via ILM. The ‘Extent Group Up-Migration’ table shows data that has been up-migrated in the last 300, 3,600 and 86,400 seconds.
The figure shows the ‘Extent Group Up-Migration’ table:
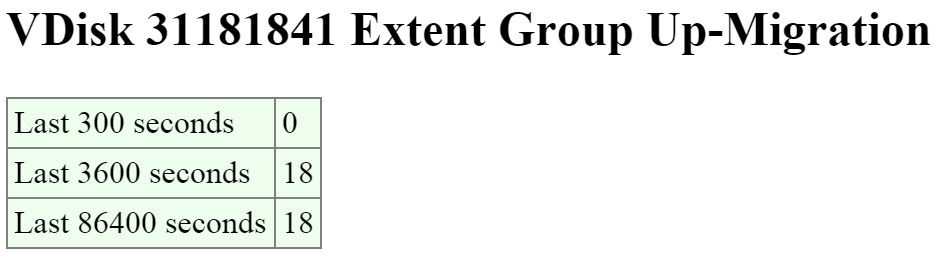 2009 Page - vDisk Stats - Extent Group Up-Migration
Using the 2010 Page (Curator)
The 2010 page is a detailed page for monitoring the Curator MapReduce framework. This page provides details on jobs, scans, and associated tasks.
You can navigate to the Curator page by navigating to http://
The top of the page will show various details about the Curator Leader including uptime, build version, etc.
The next section is the ‘Curator Nodes’ table that shows various details about the nodes in the cluster, the roles, and health status. These will be the nodes Curator leverages for the distributed processing and delegation of tasks.
The figure shows the ‘Curator Nodes’ table:
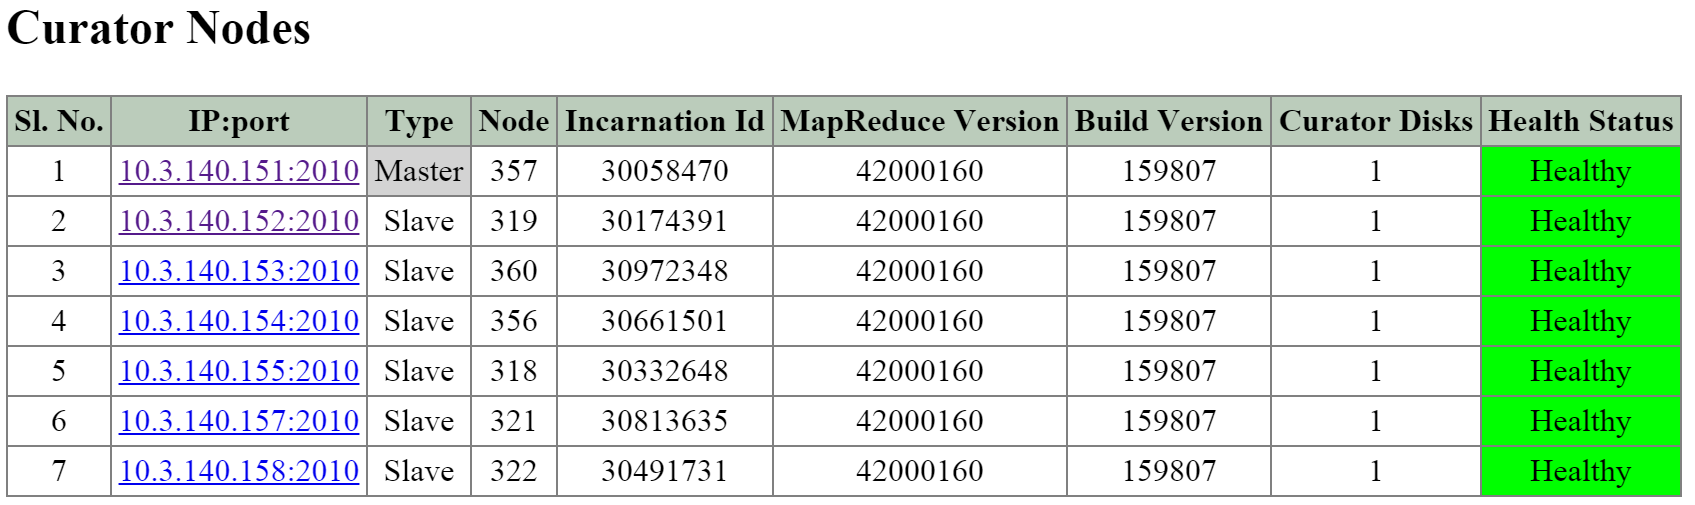 2010 Page - Curator Nodes
The next section is the ‘Curator Jobs’ table that shows the completed or currently running jobs.
There are two main types of jobs which include a partial scan which is eligible to run every 60 minutes and a full scan which is eligible to run every 6 hours. NOTE: the timing will be variable based upon utilization and other activities.
These scans will run on their periodic schedules however can also be triggered by certain cluster events.
Here are some of the reasons for a jobs execution:
- Periodic (normal state)
- Disk / Node / Block failure
- ILM Imbalance
- Disk / Tier Imbalance
The figure shows the ‘Curator Jobs’ table:
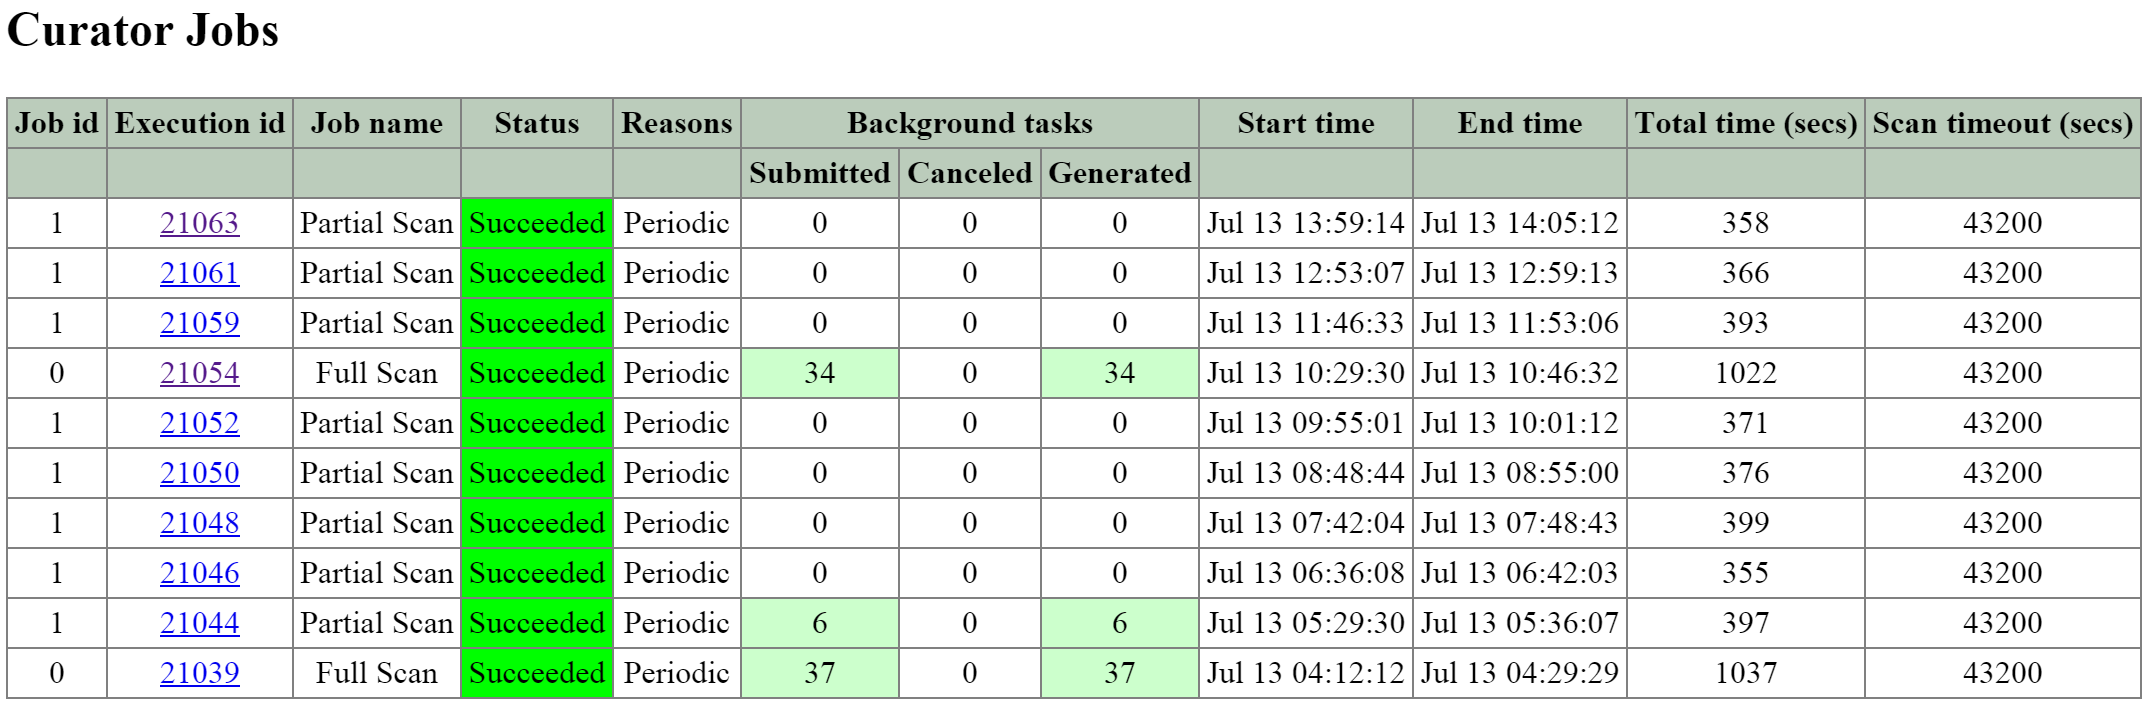 2010 Page - Curator Jobs
The table shows some of the high-level activities performed by each job:
| Activity | Full Scan | Partial Scan |
|---|---|---|
| ILM | X | X |
| Disk Balancing | X | X |
| Compression | X | X |
| Deduplication | X | |
| Erasure Coding | X | |
| Garbage Cleanup | X |
Clicking on the ‘Execution id’ will bring you to the job details page which displays various job stats as well as generated tasks.
The table at the top of the page will show various details on the job including the type, reason, tasks and duration.
The next section is the ‘Background Task Stats’ table which displays various details on the type of tasks, quantity generated and priority.
The figure shows the job details table:
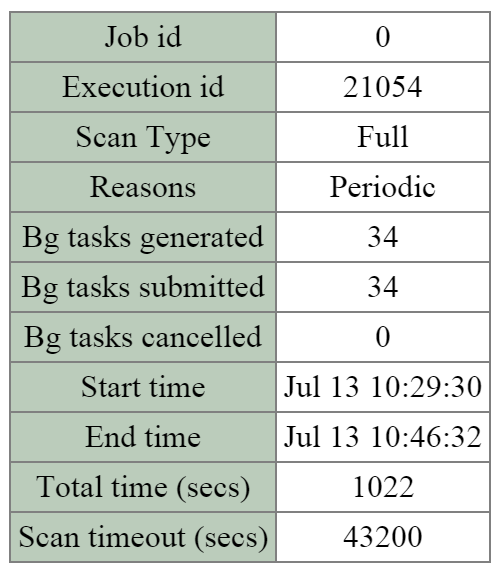 2010 Page - Curator Job - Details
The figure shows the ‘Background Task Stats’ table:
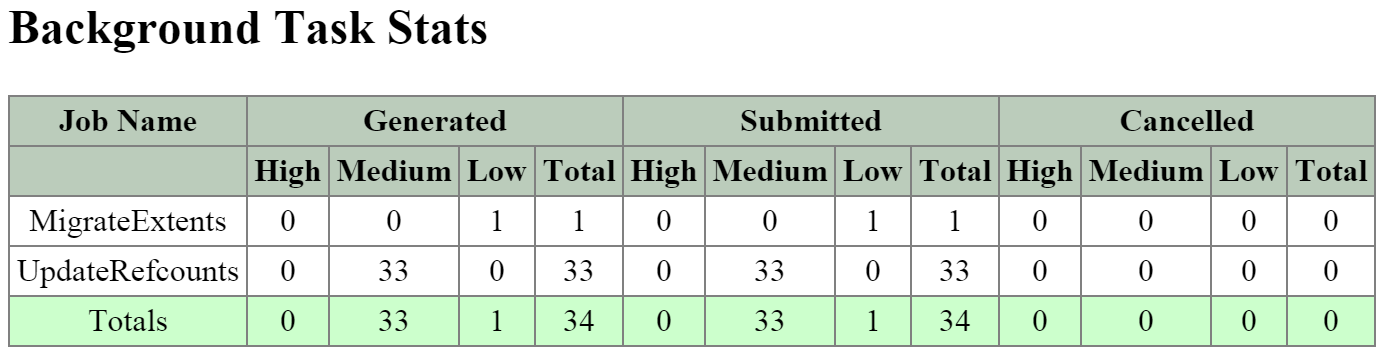 2010 Page - Curator Job - Tasks
The next section is the ‘MapReduce Jobs’ table that shows the actual MapReduce jobs started by each Curator job. Partial scans will have a single MapReduce Job, full scans will have four MapReduce Jobs.
The figure shows the ‘MapReduce Jobs’ table:
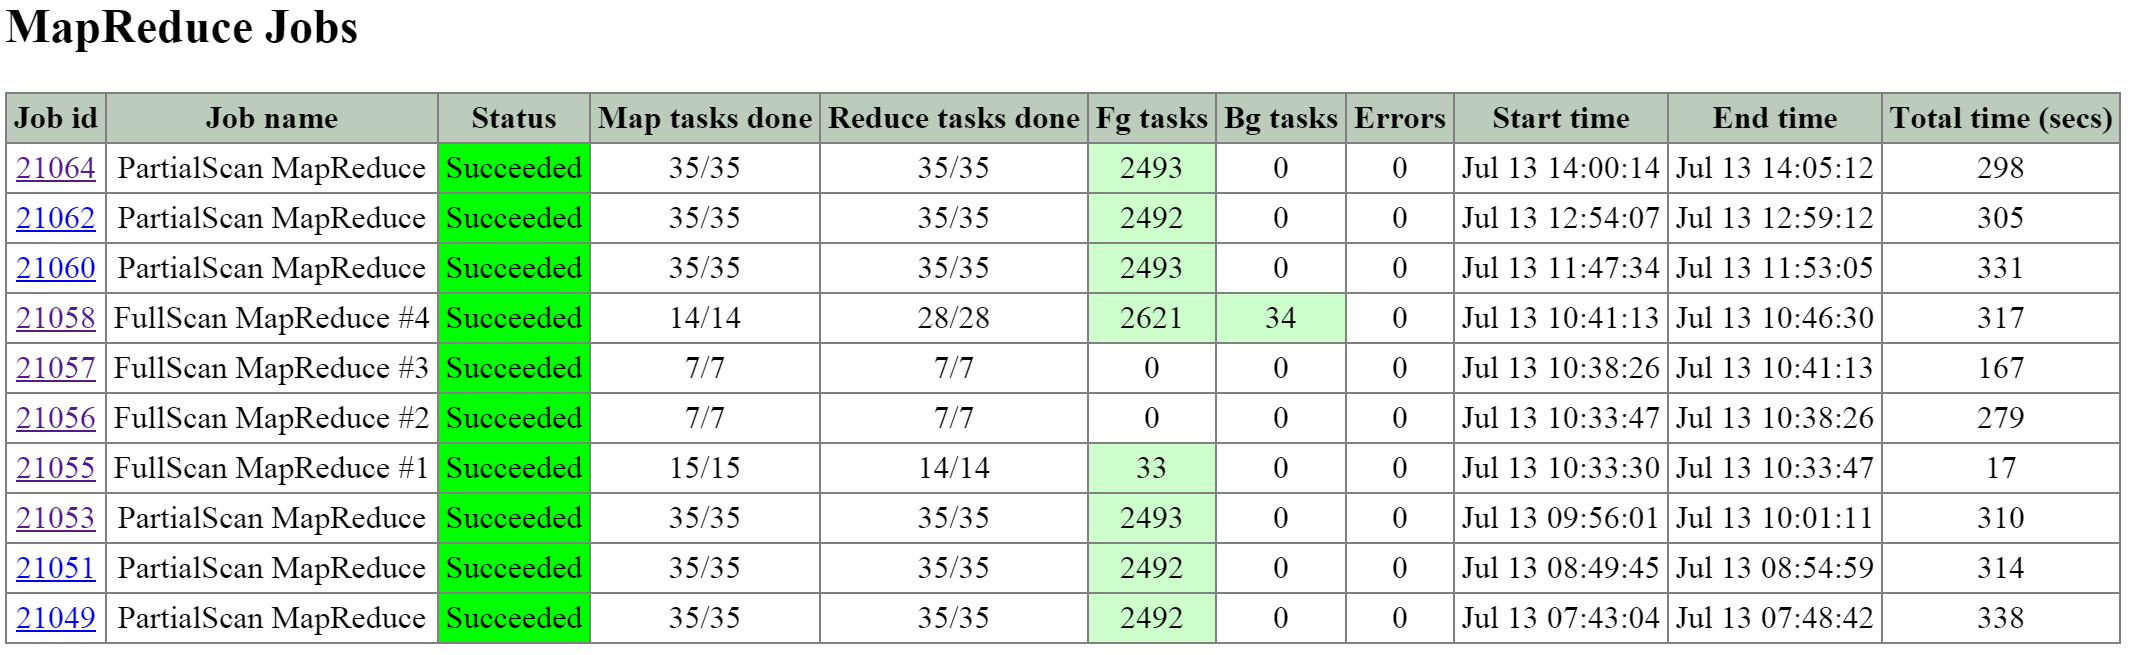 2010 Page - MapReduce Jobs
Clicking on the ‘Job id’ will bring you to the MapReduce job details page which displays the tasks status, various counters and details about the MapReduce job.
The figure shows a sample of some of the job counters:
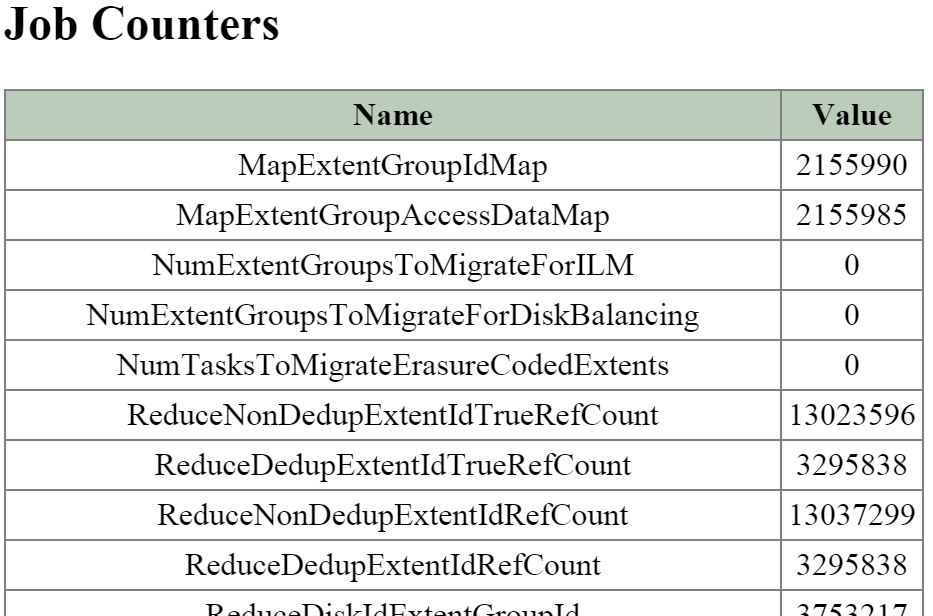 2010 Page - MapReduce Job - Counters
The next section on the main page is the ‘Queued Curator Jobs’ and ‘Last Successful Curator Scans’ section. These tables show when the periodic scans are eligible to run and the last successful scan’s details.
The figure shows the ’Queued Curator Jobs’ and ‘Last Successful Curator Scans’ section:
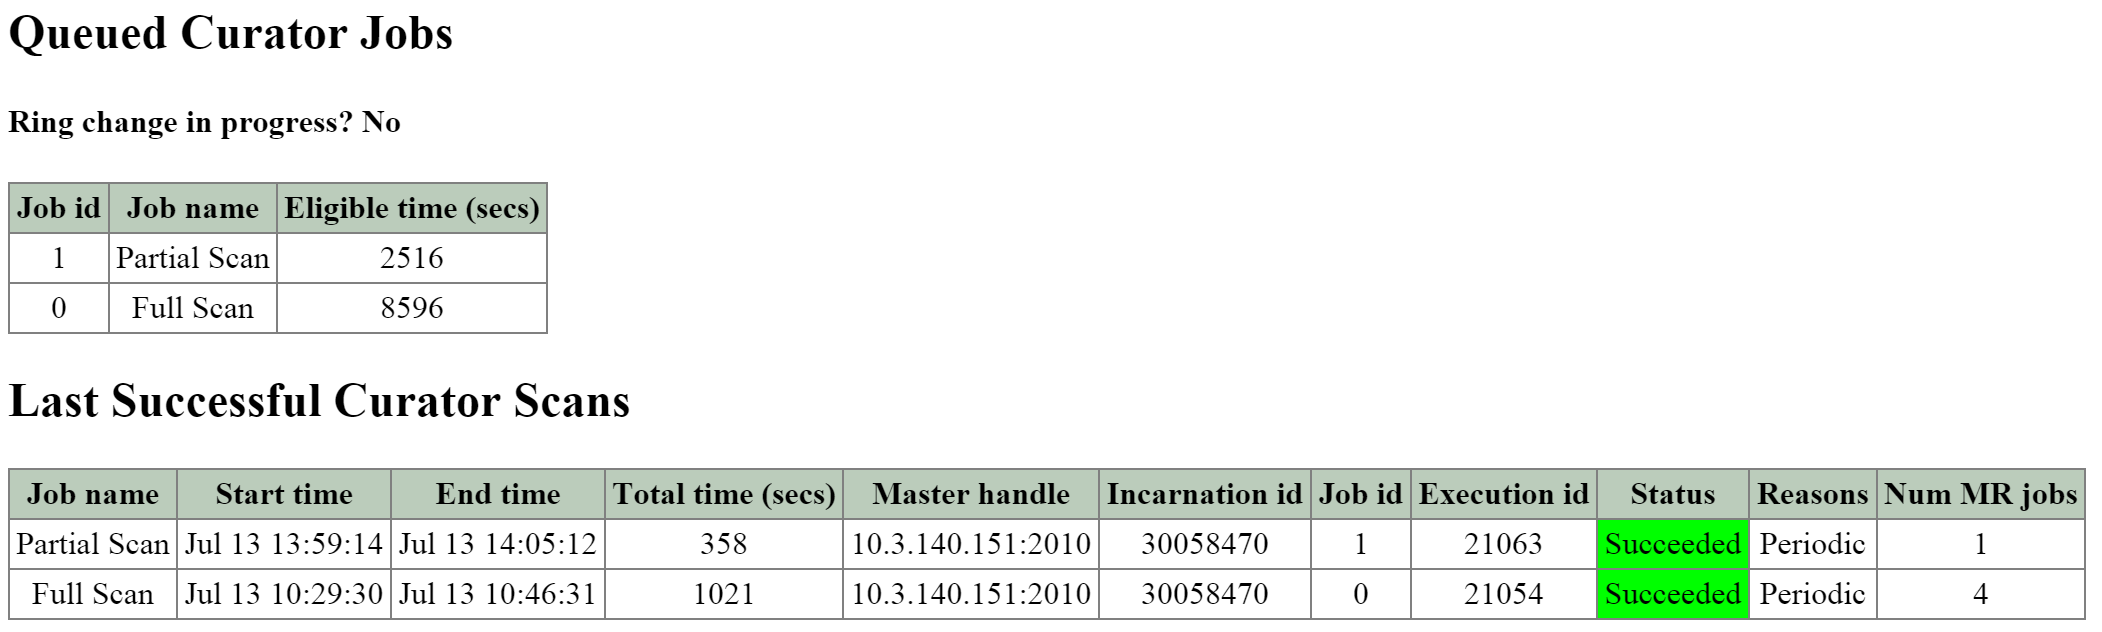 2010 Page - Queued and Successful Scans
Advanced CLI Information
Prism should provide all that is necessary in terms of normal troubleshooting and performance monitoring. However, there may be cases where you want to get more detailed information which is exposed on some of the backend pages mentioned above, or the CLI.
vdisk_config_printer
The vdisk_config_printer command will display a list of vdisk information for all vdisk on the cluster.
I’ve highlighted some of the important fields below:
- Vdisk ID
- Vdisk name
- Parent vdisk ID (if clone or snapshot)
- Vdisk size (Bytes)
- Container id
- To remove bool (to be cleaned up by curator scan)
- Mutability state (mutable if active r/w vdisk, immutable if snapshot)
The following shows example command output:
nutanix@NTNX-13SM35210012-A-CVM:~$ vdisk_config_printer | more
...
vdisk_id: 1014400
vdisk_name: "NFS:1314152"
parent_vdisk_id: 16445
vdisk_size: 40000000000
container_id: 988
to_remove: true
creation_time_usecs: 1414104961926709
mutability_state: kImmutableSnapshot
closest_named_ancestor: "NFS:852488"
vdisk_creator_loc: 7
vdisk_creator_loc: 67426
vdisk_creator_loc: 4420541
nfs_file_name: "d12f5058-f4ef-4471-a196-c1ce8b722877"
may_be_parent: true
parent_nfs_file_name_hint: "d12f5058-f4ef-4471-a196-c1ce8b722877"
last_modification_time_usecs: 1414241875647629
...
vdisk_usage_printer -vdisk_id=
The vdisk_usage_printer is used to get detailed information for a vdisk, its extents and egroups.
I’ve highlighted some of the important fields below:
- Egroup ID
- Egroup extent count
- Untransformed egroup size
- Transformed egroup size
- Transform ratio
- Transformation type(s)
- Egroup replica locations (disk/cvm/rack)
The following shows example command output:
nutanix@NTNX-13SM35210012-A-CVM:~$ vdisk_usage_printer -vdisk_id=99999
 Egid # eids UT Size T Size ... T Type Replicas(disk/svm/rack)
 1256878 64 1.03 MB 1.03 MB ... D,[73 /14/60][184108644/184108632/60]
 1256881 64 1.03 MB 1.03 MB ... D,[73 /14/60][152/7/25]
 1256883 64 1.00 MB 1.00 MB ... D,[73 /14/60][184108642/184108632/60]
 1055651 4 4.00 MB 4.00 MB ... none[76 /14/60][184108643/184108632/60]
 1056604 4 4.00 MB 4.00 MB ... none[74 /14/60][184108642/184108632/60]
 1056605 4 4.00 MB 4.00 MB ... none[73 /14/60][152/7/25]
 ...
NOTE: Notice the egroup size for deduped vs. non-deduped egroups (1 vs. 4MB). As mentioned in the ‘Data Structure’ section, for deduped data, a 1MB egroup size is preferred to negate any potential fragmention cause by de-duplicating the data.
curator_cli display_data_reduction_report
The curator_cli display_data_reduction_report is used to get detailed information on the storage savings per container by transform (e.g. clone, snap, dedup, compression, erasure coding, etc.)
I’ve highlighted some of the important fields below:
- Container ID
- Technique (transform applied)
- Pre reduction Size
- Post reduction size
- Saved space
- Savings ratio
The following shows example command output:
CVM:~$ curator_cli display_data_reduction_report
Using curator leader: 99.99.99.99:2010
Using execution id 68188 of the last successful full scan
+---------------------------------------------------------------------------+
| Container| Technique | Pre | Post | Saved | Ratio |
| Id | | Reduction | Reduction | | |
+---------------------------------------------------------------------------+
| 988 | Clone | 4.88 TB | 2.86 TB | 2.02 TB | 1.70753 |
| 988 | Snapshot | 2.86 TB | 2.22 TB | 656.92 GB | 1.28931 |
| 988 | Dedup | 2.22 TB | 1.21 TB | 1.00 TB | 1.82518 |
| 988 | Compression | 1.23 TB | 1.23 TB | 0.00 KB | 1 |
| 988 | Erasure Coding | 1.23 TB | 1.23 TB | 0.00 KB | 1 |
| 26768753 | Clone | 764.26 GB | 626.25 GB | 138.01 GB | 1.22038 |
| 26768753 | Snapshot | 380.87 GB | 380.87 GB | 0.00 KB | 1 |
| 84040 | Snappy | 810.35 GB | 102.38 GB | 707.97 GB | 7.91496 |
| 6853230 | Snappy | 3.15 TB | 1.09 TB | 2.06 TB | 2.88713 |
| 12199346 | Snappy | 872.42 GB | 109.89 GB | 762.53 GB | 7.93892 |
| 12736558 | Snappy | 9.00 TB | 1.13 TB | 7.87 TB | 7.94087 |
| 15430780 | Snappy | 1.23 TB | 89.37 GB | 1.14 TB | 14.1043 |
| 26768751 | Snappy | 339.00 MB | 45.02 MB | 293.98 MB | 7.53072 |
| 27352219 | Snappy | 1013.8 MB | 90.32 MB | 923.55 MB | 11.2253 |
+---------------------------------------------------------------------------+
curator_cli get_vdisk_usage lookup_vdisk_ids=<COMMA SEPARATED VDISK ID(s)>
The curator_cli get_vdisk_usage lookup_vdisk_ids command is used to get various stats about the space used by each of the specified vdisks.
I’ve highlighted some of the important fields below:
- Vdisk ID
- Exclusive usage (Data referred to by only this vdisk)
- Logical uninherited (Data written to vdisk, may be inherited by a child in the event of clone)
- Logical dedup (Amount of vdisk data that has been deduplicated)
- Logical snapshot (Data not shared across vdisk chains)
- Logical clone (Data shared across vdisk chains)
The following shows example command output:
Using curator leader: 99.99.99.99:2010
VDisk usage stats:
+------------------------------------------------------------------------+
| VDisk Id | Exclusive | Logical | Logical | Logical | Logical |
| | usage | Uninherited | Dedup | Snapshot | Clone |
+------------------------------------------------------------------------+
| 254244142 | 596.06 MB | 529.75 MB | 6.70 GB | 11.55 MB | 214 MB |
| 15995052 | 599.05 MB | 90.70 MB | 7.14 GB | 0.00 KB | 4.81 MB |
| 203739387 | 31.97 GB | 31.86 GB | 24.3 MB | 0.00 KB | 4.72 GB |
| 22841153 | 147.51 GB | 147.18 GB | 0.00 KB | 0.00 KB | 0.00 KB |
...
curator_cli get_egroup_access_info
The curator_cli get_egroup_access_info is used to get detailed information on the number of egroups in each bucket based upon last access (read) / modify ([over]write). This information can be used to estimate the number of egroups which might be eligible candidates to leverage erasure coding.
I’ve highlighted some of the important fields below:
- Container ID
- Access \ Modify (secs)
The following shows example command output:
Using curator leader: 99.99.99.99:2010
Container Id: 988
+----------------------------------------------------------------------------..
| Access \ Modify (secs) | [0,300) | [300,3600) | [3600,86400) | [86400,60480..
+----------------------------------------------------------------------------..
| [0,300) | 345 | 1 | 0 | 0 ..
| [300,3600) | 164 | 817 | 0 | 0 ..
| [3600,86400) | 4 | 7 | 3479 | 7 ..
| [86400,604800) | 0 | 0 | 81 | 7063 ..
| [604800,2592000) | 0 | 0 | 15 | 22 ..
| [2592000,15552000) | 1 | 0 | 0 | 10 ..
| [15552000,inf) | 0 | 0 | 0 | 1 ..
+----------------------------------------------------------------------------..
...
External StorageLearn about how Nutanix Cloud Infrastructure integrates with external storage.
» Download this section as PDF (opens in a new tab/window)
Nutanix pioneered Hyperconverged Infrastructure (HCI), bringing a unique way to deploy infrastructure. Over time Nutanix has become a platform company that provides choice and flexibility to customers in how the use their infrastructure. The motivation behind integrating Nutanix with external storage providers is to extend that choice to storage and provide best of both worlds to customers: the operational simplicity, VM-centricity, and robust virtualization of Nutanix Cloud Platform and Prism, combined with the dedicated performance, specific data services, and independent scaling of modern external storage arrays. The goal is to preserve the frictionless Prism experience while opening the Nutanix Cloud Platform (NCP) to the broader storage ecosystem.
The integration of external storage addresses three primary motivations:
- Flexible and Independent Administration: Decoupling compute and storage allows flexible administration, allowing organizations the choice to budget, plan and administer them independently.
- Leveraging Existing Investments: The market reality is that significant capital investments exist in external storage arrays (e.g., Dell PowerFlex, Pure Storage, Dell PowerStore, NetApp). This integration allows migration to the Nutanix Cloud Platform without abandoning existing storage hardware.
- Operational and Control Plane Uniformity: By integrating external storage into the AOS control plane, Nutanix now provides the same VM-centric operations and single pane of glass for management, snapshot orchestration, and disaster recovery, regardless of the underlying storage.
» Download this section as PDF (opens in a new tab/window)
High Level Design
When designing the external storage integration, an important goal was to make sure it requires minimal changes and modifications in the workflows and platform capabilities provided by Nutanix. The external storage integration still has a Nutanix cluster called Nutanix compute cluster or Nutanix Cloud Infrastructure (NCI) compute cluster. Unlike HCI, this cluster is created on boot devices or boot drives on the nodes. The nodes in the cluster are still created with a Controller Virtual Machine (CVM) acting as brains of the cluster with its various shared cluster services.
CVM in Compute Nodes
In a Nutanix compute cluster, the nodes still have a CVM that runs on every node just like in an HCI deployment. The difference with external storage integration compared to HCI is that the CVM does not manage any local disk drives.
Instead:
- The CVM boots from the host’s local boot device such as M.2 cards or BOSS cards.
- All persistent data for user VMs is stored on the external array.
- The CVM retains its role as the brains of the node and cluster, handling I/O orchestration, metadata management, networking, background operations and DR workflows.
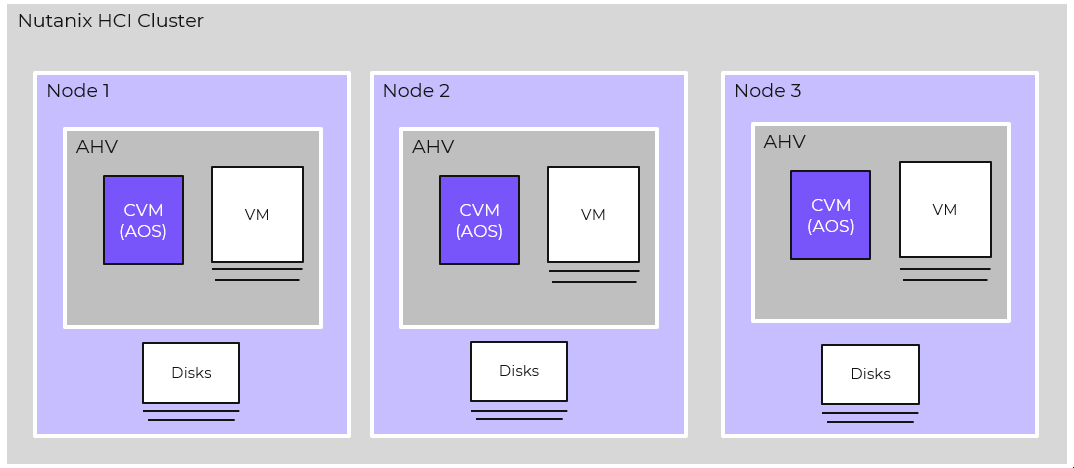 HCI Cluster
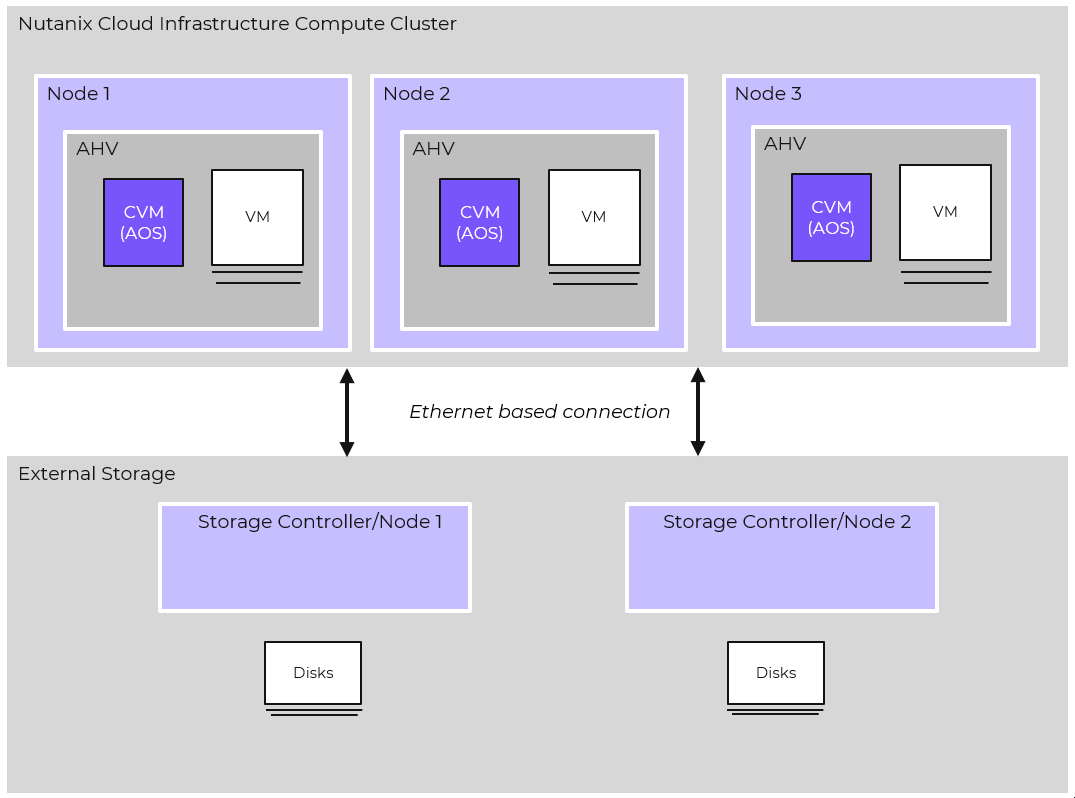 Nutanix Compute Cluster with External Storage
Design Choices
When architecting this integration, the engineers had to make some design choices with respect to the architecture and integration.
- Protocol Selection: When architecting the data path between the Nutanix compute cluster and external storage, the foundational decision revolved around the choice of transport protocol. Ethernet-based transport provides standards-based simplicity and frictionless deployment of the solution. This approach allows leveraging datacenter networking and avoids the complexity of specialized, legacy storage fabrics. While Ethernet provides the underlying foundation, the specific storage protocol is dynamically tailored to align natively with the target storage array:
- Dell PowerFlex: Utilizes a proprietary Ethernet-based protocol that uses Dell SDC(Storage Data Client) optimized for the PowerFlex architecture.
- Everpure and Dell PowerStore: Leverages NVMe/TCP to deliver highly parallelized, ultra-low latency block I/O over standard networks.
- NetApp: Will utilize NFSv3, capitalizing on its proven maturity and efficient file-based access.
- API-Driven Provisioning over Manual LUN Creation and Masking: Instead of provisioning individual LUNs on an array and manually mapping them to hosts, Nutanix integrates the storage vendor’s APIs directly into AOS and Prism. When a VM or vDisk is created in Prism, the control plane programmatically communicates with the external array to automatically provision and map the corresponding resources.
- 1:1 vDisk-to-Volume Mapping : To maintain Nutanix’s core tenet of VM-centric operations, the architecture enforces a granular mapping between a Nutanix virtual disk and a thin provisioned native volume on the external array. This 1:1 mapping bypasses the need for a complex file system layer on top of the external block device.
- Offloaded Data Services : Storage related features like compression, deduplication, and encryption are offloaded to the external array, leveraging the external array’s capability to provide those functionalities.
- Simplified Network and DR : Nutanix Flow Virtual Networking and Flow Network Security work the same leveraging the same CVM services, simplifying network management and security. Additionally, Nutanix Disaster Recovery continues to orchestrate snapshots and replication, leveraging snapshot capabilities of the external array via APIs, providing a consistent DR workflow the same way as HCI.
» Download this section as PDF (opens in a new tab/window)
Architecture Details
Components and Services
The architecture for external storage introduces new services and components and modifies existing AOS components to handle external storage:
- ExternalStorage Entity: A new entity type which is basically a configuration structure called ExternalStorage was introduced in AOS and Prism that captures vendor specific details. This new entity type acts as a management layer that abstracts vendor specific details like API endpoints, credentials and storage details.
- Castor: Castor is a cluster service running in CVM that does management for external storage. A Castor instance runs on every CVM in the cluster, but there is an elected Castor Leader that is responsible for handling operations. If the Castor Leader fails, a new leader is automatically elected via Zookeeper. Castor handles the lifecycle of the ExternalStorage entity, credentials, and initial cluster bootstrapping.
- Hades: In HCI, Hades is responsible for local disk drive management in every node. Hades has an expanded and very important role with external storage. Hades manages per-node “service volumes” which are needed for cluster creation.
- Service Volumes: The service volumes are cluster services that are present in HCI as well but with external storage are provisioned as volumes. Their roles and functionality are similar to what they do in HCI. The service volumes are:
- Cassandra: Acts as cluster’s metadata store and manages cluster level metadata
- Zookeeper: Responsible for and maintains cluster configuration management and distributed coordination
- Curator: Responsible for cluster background operations and maintenance tasks.
- Stargate: Still responsible for datapath and I/O operations but how it does the operations depends on the storage.
- Dell PowerFlex: PowerFlex uses a proprietary Dell protocol that uses Dell Storage Data Client (SDC) in CVM to manage and create PowerFlex volumes. These volumes are represented as SCSI devices that Stargate consumes.
- Everpure and Dell PowerStore: They both use NVMe/TCP protocol. The protocol requires an initiator and target. Stargate leverages nvmf support in SPDK as a user-space NVMe initiator in the CVM and target is external storage array.
- B-Trees and Forest: With HCI, when Stargate writes to local drives, the metadata for those writes was stored in global Cassandra and also local within the node with the data. Cassandra still stores cluster metadata with external storage but metadata for user data vdisk is stored in an external metadata or Change Block Tracking (CBT) volume that resides on external storage. This metadata is stored in B-trees. Forest is the hierarchical metadata management system (or library) that orchestrates the lifecycle, hosting, and reading/writing of these B-Trees.
Cluster Setup
A Nutanix compute cluster is initialized and set up the same way as a HCI cluster using Nutanix Foundation. The difference is instead of installing AHV and AOS on local drives, Foundation installs AHV and AOS on the boot device. AHV then puts the boot device in a Volume Group, carves out space for itself and then gives a virtual NVMe device to the CVM. The CVM next creates these 3 services on the vNVMe data partition like HCI:
- Cassandra
- Curator
- Zookeeper
All the CVMs and these services then form the Nutanix compute cluster.
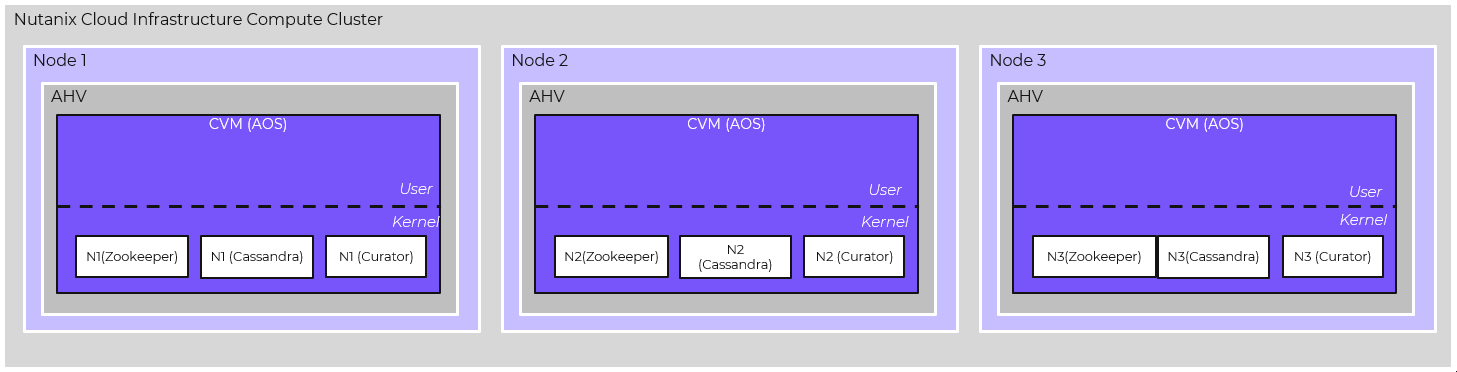 Compute Cluster Creation (boot device)
All storage and VM related operations are blocked on the cluster at this point. The administrator on logging into Prism is first prompted to connect to External Storage. Once an external storage array is connected, the node specific service volumes are created on external storage by Hades. Once these volumes are created, Cassandra, Curator and Zookeeper data is then migrated over to these volumes. At this point the cluster creation is complete and the cluster is ready for VM provisioning with their associated vdisks that will be created on external storage.
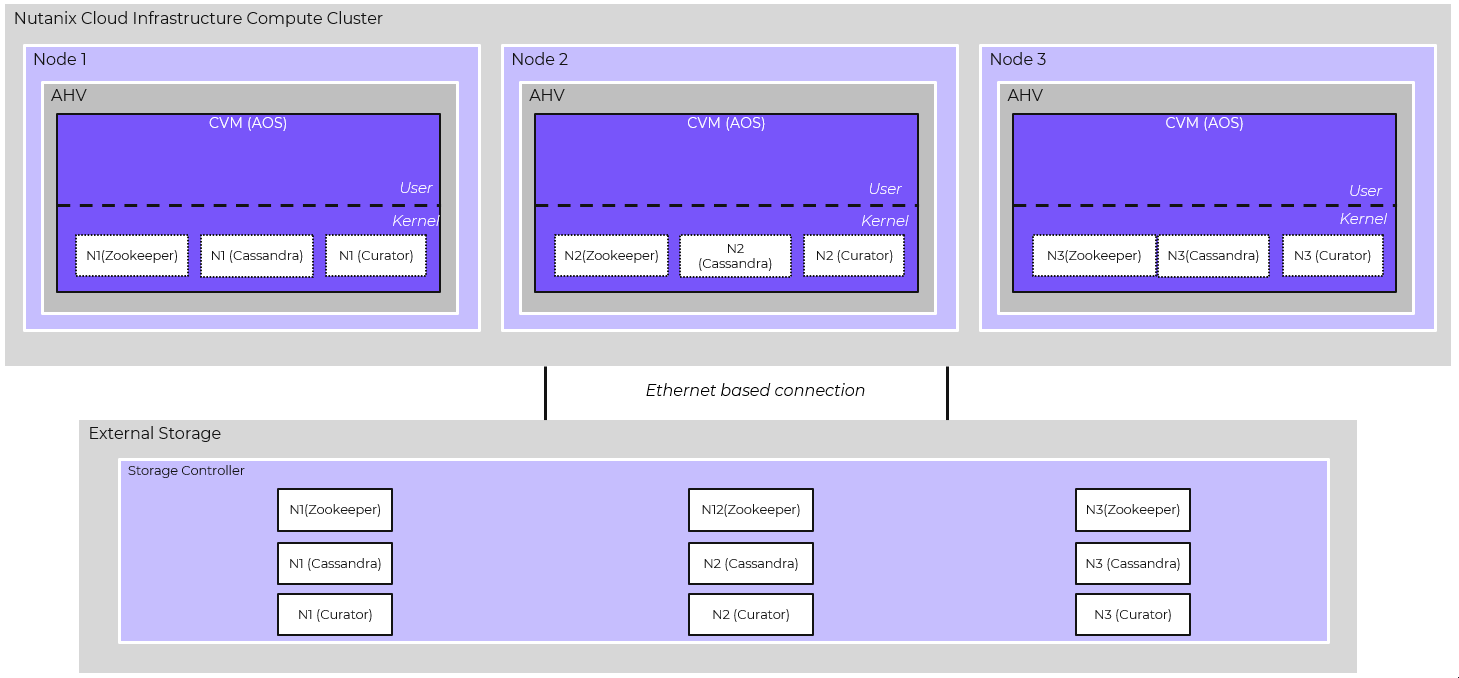 Compute Cluster connected to External Storage
The protocol setup for the data path between compute and storage and its associated settings like multipathing and queue depth policy is entirely done in software by Nutanix and the storage vendor. No manual protocol network configuration is required.
Data and Metadata Volumes
Once the external storage array is connected, VMs with vdisks can now be created in Prism the same way as HCI. The VM provisioning can be done through GUI, APIs or automation tools like Self-Service just like HCI. There is no file-system or logical container on which the vdisks are created. There is a direct 1:1 mapping between a VM vdisk and volume on external storage providing granular control and preserving VM and vdisk centric operations. A vdisk in Nutanix corresponds to a data volume and a metadata or CBT volume on external storage as mentioned above. When a VM with a vdisk is created, the CVM on the node where the VM is created will acquire a vdisk lock that allows only that CVM to make modifications to the vdisk. The CVM will then map to the data and metadata volume from external storage corresponding to that vdisk. The CVM will issue a SCSI-3/NVMe Persistent Reservation ensuring I/O to volumes is fenced and only the Stargate holding the lock can perform I/O against the volumes.
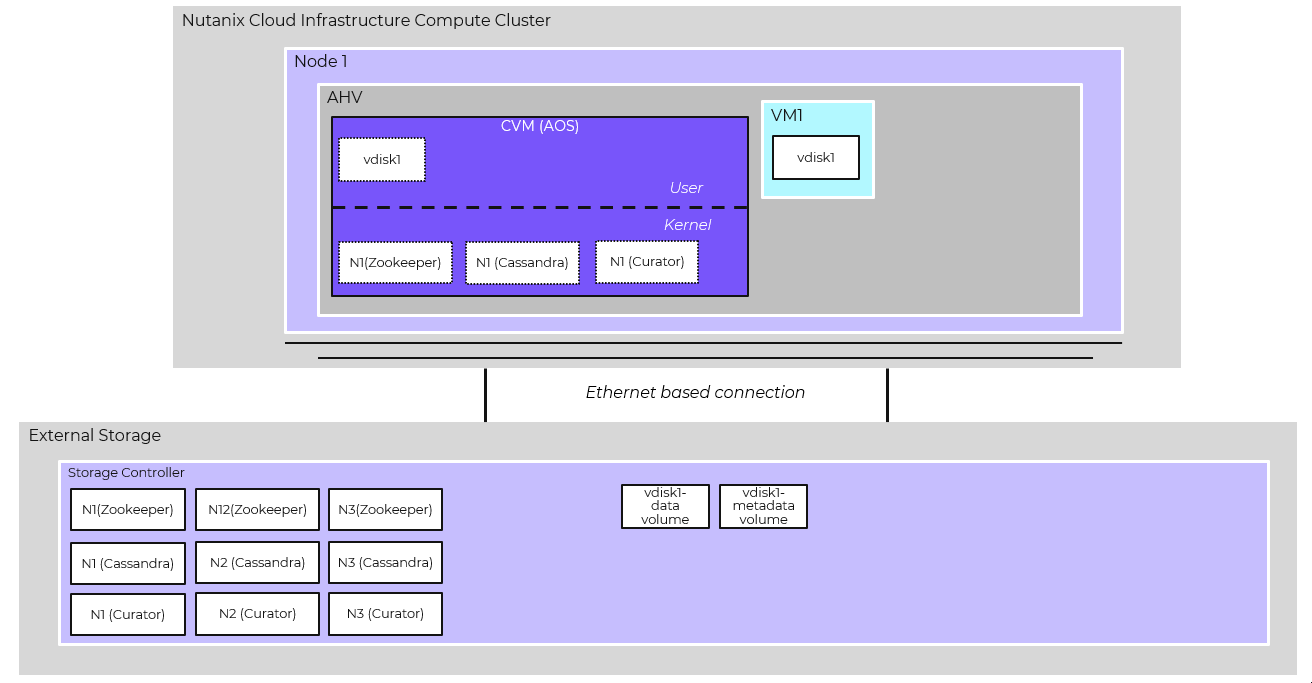 Data and Metadata Volumes
Snapshots and Clones
As mentioned before, leveraging the Nutanix platform capabilities for external storage was a key goal when architecting the integration. Prism still acts as the main control plane through which users create, delete, modify snapshots and clones similar to HCI. When a user does an operation like creating a snapshot or clone, Nutanix uses the external storage vendor’s snapshot and clone APIs to take on-disk storage snapshots and clones. A snapshot results in creation of a new entity on the external storage array. That entity is classified as a volume or a snapshot depending on the storage array. Every snapshot in a snapshot chain gets its own separate B-tree which resides in the per-snapshot chain metadata (CBT) volume. The B-trees for all snapshots of a vdisk in a single snapshot chain are stored in the same CBT volume. A clone results in creation of a new snapshot chain and therefore a new data and metadata (CBT) volume on external storage that becomes its own entity with its own B-tree(s) for the new snapshot chain. The B-Tree(s) reside on this new metadata volume.
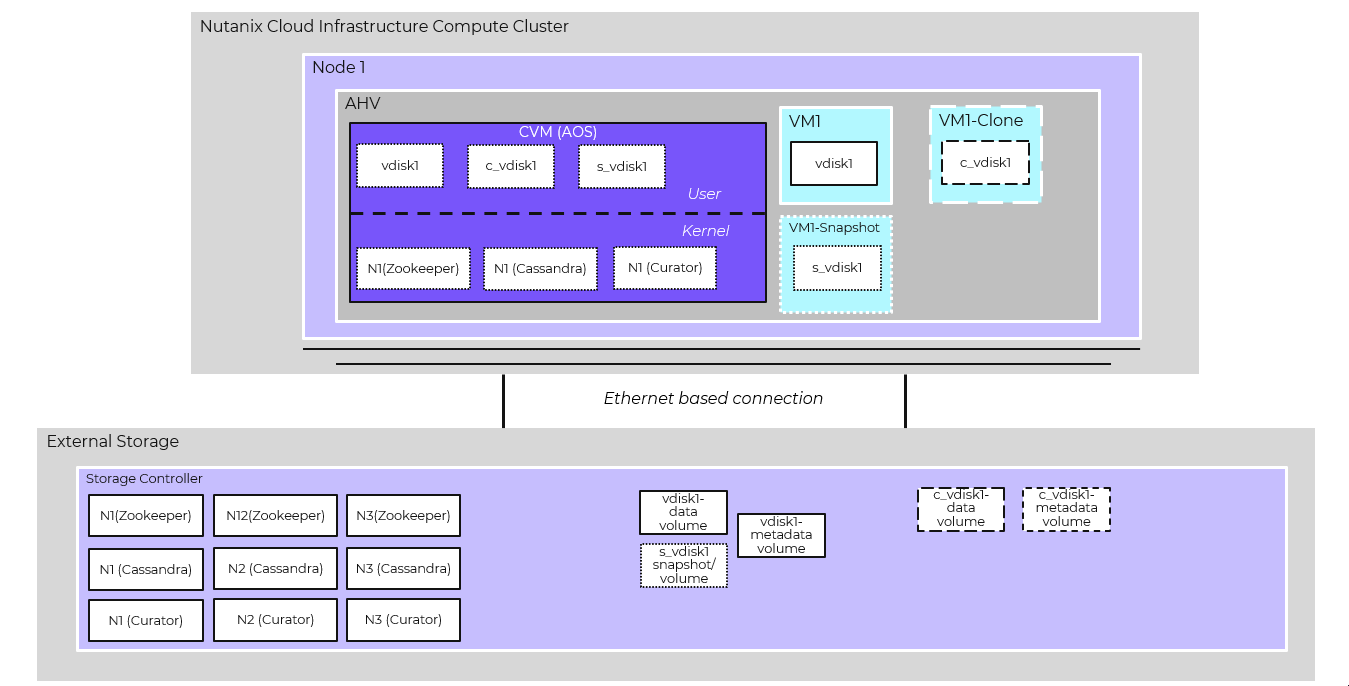 Snapshots and clones on External Storage
Nutanix DR which depends on Nutanix platform taking and maintaining snapshots works the same taking snapshots as described above. With external storage, Nutanix supports a spectrum of RPOs such as sync (0 RPO), async (>60 minutes RPO) and as well as automatic failover between sites using AHV Metro.
Since the entire orchestration and replication is driven by the Nutanix control plane, DR can be done between Nutanix compute clusters connected to external storage as well as between a Nutanix compute cluster connected to external storage and a HCI cluster.
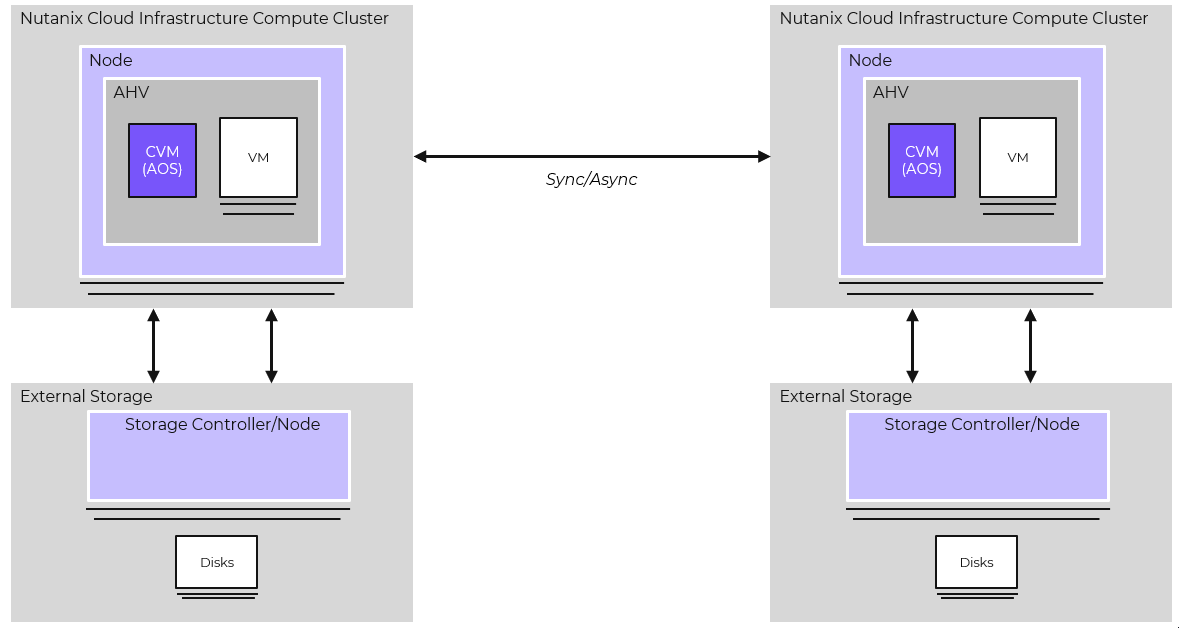 DR between Nutanix Compute Clusters with External storage
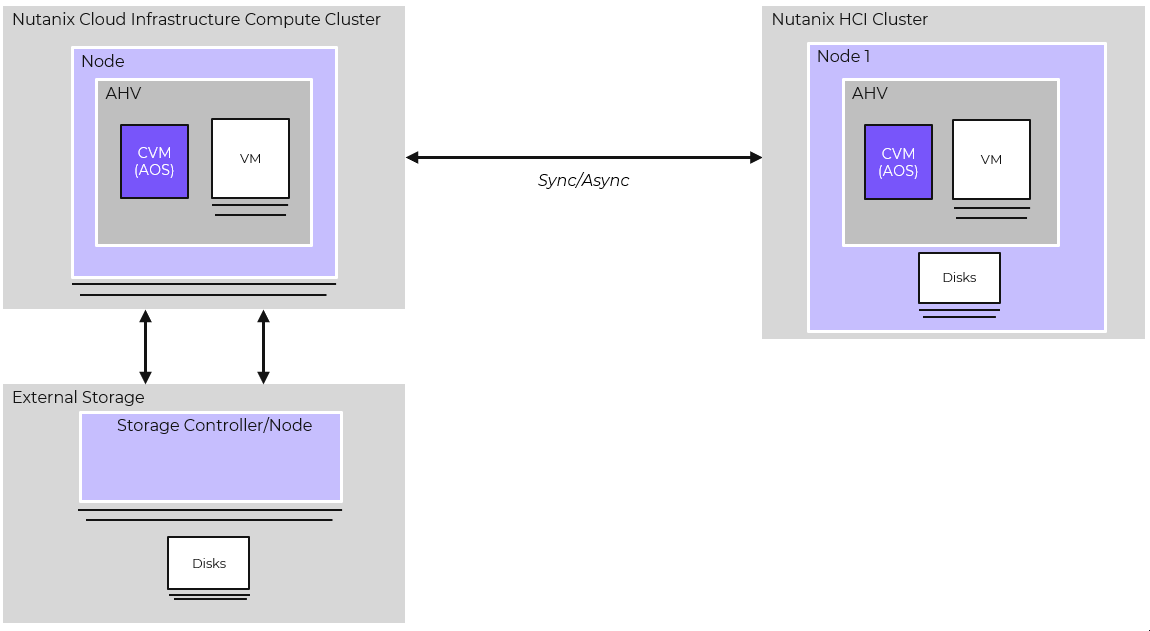 DR between Nutanix Compute Cluster with External storage and HCI Cluster
Networking
Network ServicesLearn about the services that provide network security and virtual networking.
» Download this section as PDF (opens in a new tab/window)
Flow Network Security is a distributed, stateful firewall that enables granular network monitoring and enforcement between VMs running on the AHV platform as well as external entities they communicate with.
Supported Configurations
The solution applies to the configurations below:
Core Use Case(s):
- Microsegmentation
Management interfaces(s):
- Prism Central (PC)
Supported Environment(s):
- On-Premises:
- AHV
- Cloud:
- Nutanix Cloud Clusters on AWS
Upgrades:
- Included in LCM as Flow
Compatible Features:
- Service Chaining
- Security Central
- Calm
Flow Network Security configuration is done via Prism Central by defining policies and assigning categories to VMs. Prism Central can define the security policies and categories of many connected AHV clusters in one place. Each AHV host implements the rules using OVS and OpenFlow as required for distributed enforcement.
Implementation Constructs
Within Flow Network Security, there are a few key constructs:
Categories
Categories are simple text key value pairs used to define groups of VMs that policies are applied to. Typical categories are environment, application type, and application tier. Any key and value tag that is helpful to identify a VM can be used as a category, but some categories such as AppType and AppTier are required for application security policies.
- Category: “Key: Value” or Tag
- Examples Keys: AppType, AppTier, Group, Location
For example, a VM providing production database services may have the following assigned categories:
- AppTier: Database
- AppType: Billing
- Environment: Production
These categories can then be leveraged by security policies to determine what rules or actions to apply. Categories aren’t only for Flow Network Security, you can also use these same categories for protection policies.
Security Policies
Security policies are made of defined rules that determine what is allowed between a source and a destination. A rule inside an application policy includes all the inbound and outbound traffic for a specific application tier. A single rule can include multiple sources and multiple destinations. In the following example, there is one single defined rule for AppTier: Web. If we added allowed traffic to and from AppTier: Database, there would then be two rules.
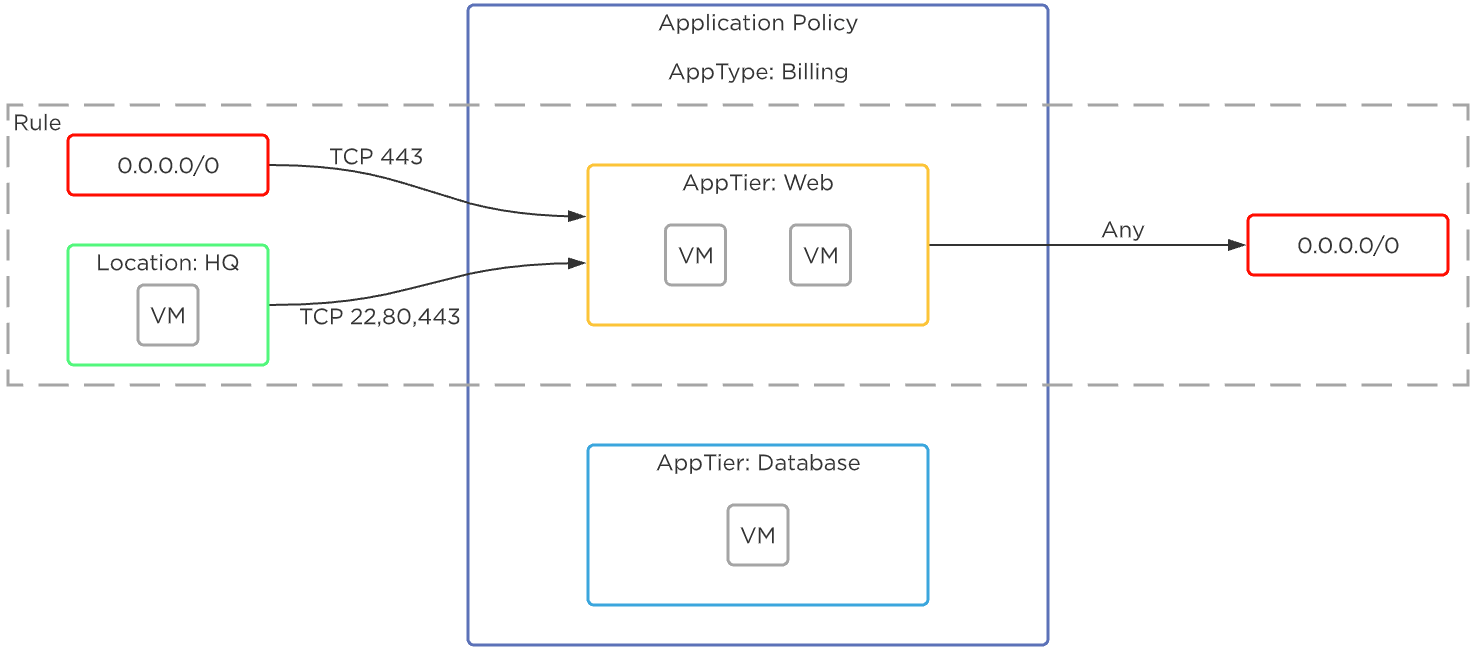 Flow Network Security - Rules
There are a few types of security policies, and they’re evaluated in the following order:
- Quarantine Policy
- Deny All traffic for specified VM(s): Strict
- Deny All traffic except specific traffic for investigation: Forensic
- Example 1: VMs A,B,C infected with a virus, isolate them to stop the virus from further infecting the network
- Example 2: VMs A,B,C infected. Quarantine them but allow security team to connect to the VMs for analysis
- Isolation Policy
- Deny traffic between two categories, allow traffic within category
- Example: separate tenant A from tenant B, clone environment and allow to run in parallel without affecting normal network communication.
- Application Policy
- This is your common 5-tuple rule allowing you to define what transport (TCP/UDP), Port, and source/destination is allowed.
- Allow Transport: Port(s) To,From
- Example: Allow TCP 443 from VMs with category Location:HQ to VMs with category AppTier:Web
- VDI Policy
- Identity-based firewall to apply a category to a VDI VM based on the AD Groups of the logged-in user.
- Implement policy based on the assigned AD groups
The following shows an example using Flow Network Security to control traffic in a sample application:
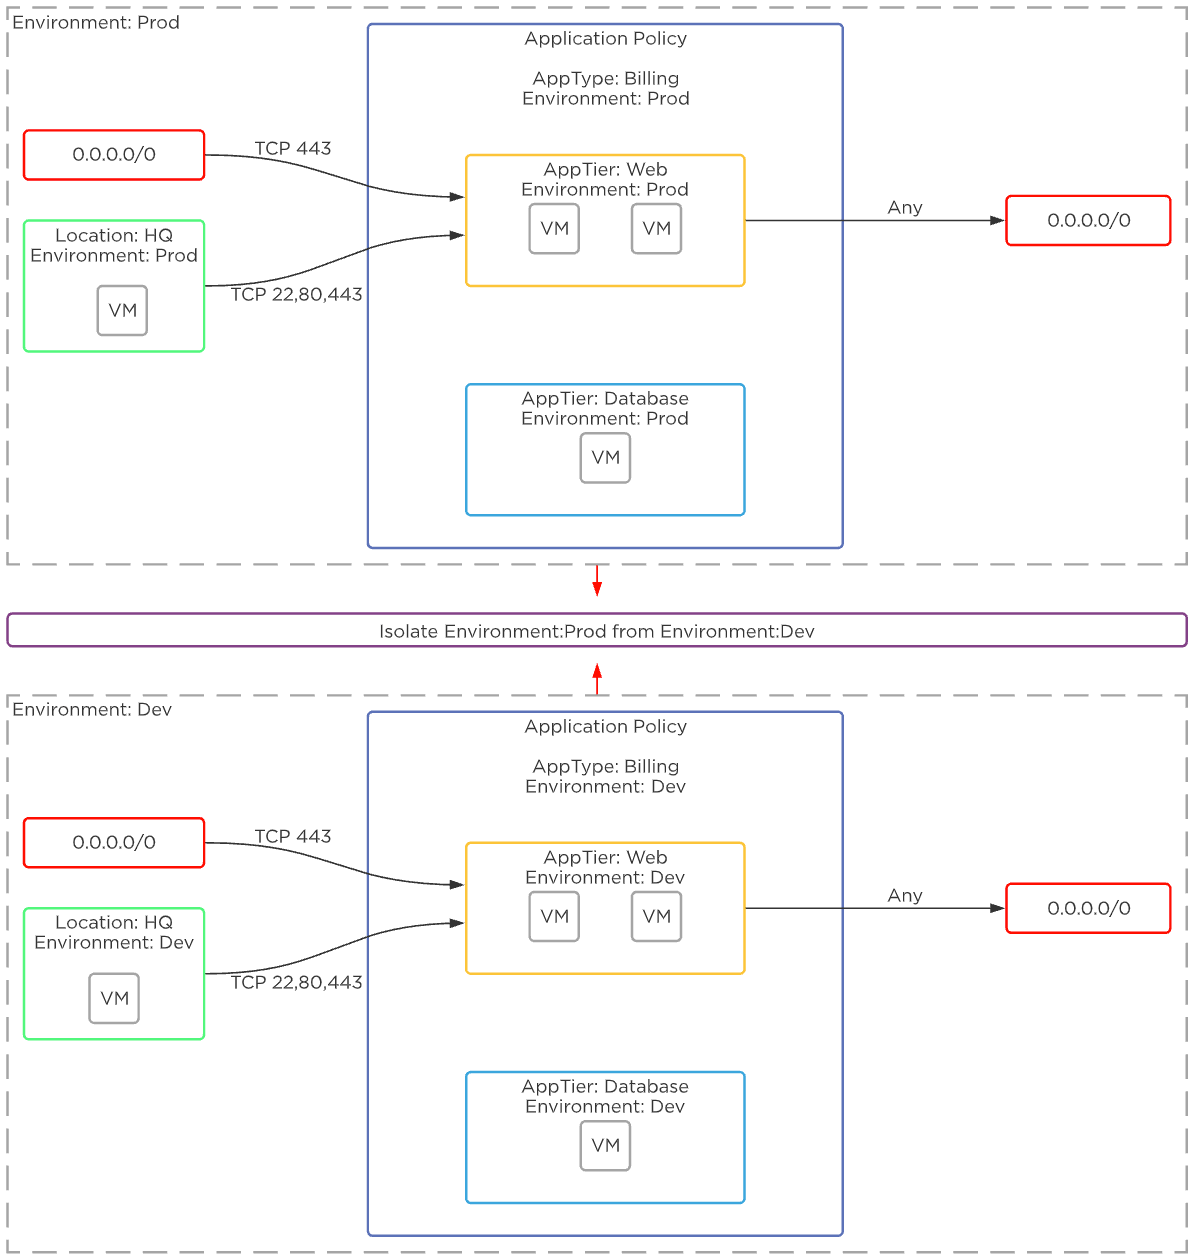 Flow Network Security - Example Application
Policy State
The policy state determines what action is taken when a rule is matched. With Flow Network Security there are two main states:
- Enforce
- Enforce the policy by allowing only defined flows and dropping all others.
- Monitor
- Allow all flows, but highlight any packets that would have violated the policy in the policy visualization page.
Rule Enforcement
Flow Network Security policies are applied to a packet once it leaves the UVM, and before it gets to any other VM. This occurs in the microsegmentation bridge (br.microseg) on the AHV host.
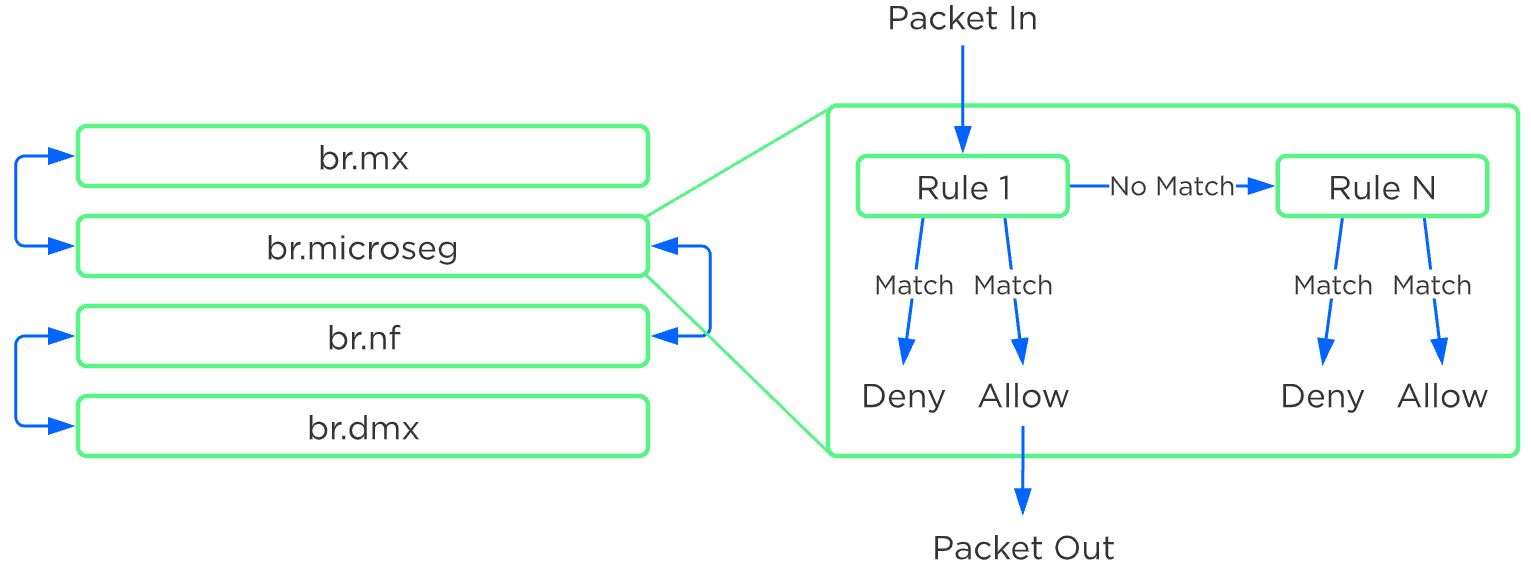 Flow Network Security - Rule Order Overview
Policies are built based on categories, but rule enforcement happens based on the detected VM IP address. The job of Flow Network Security is to evaluate the categories and policies assigned to all the VMs, and then program the right rules into the br.microseg bridge on the host or hosts where protected VMs run. VMs that use Nutanix AHV IPAM have a known IP address as soon as their NIC is provisioned and the rules are programmed when the VM is powered on. The Nutanix Acropolis process intercepts DHCP and ARP messages to detect the IP address of any VM with static IPs or external DHCP. For these VMs, rules are enforced as soon as the VM IP is known.
Rule evaluation for Quarantine, Application, and VDI policies is based on the detected IPv4 address.
Rule evaluation for Isolation policies is based on both the IPv4 address and the VM MAC address.
Evaluation order is on a first-match basis in the following order.
- Quarantine
- Isolation
- Application
- VDI
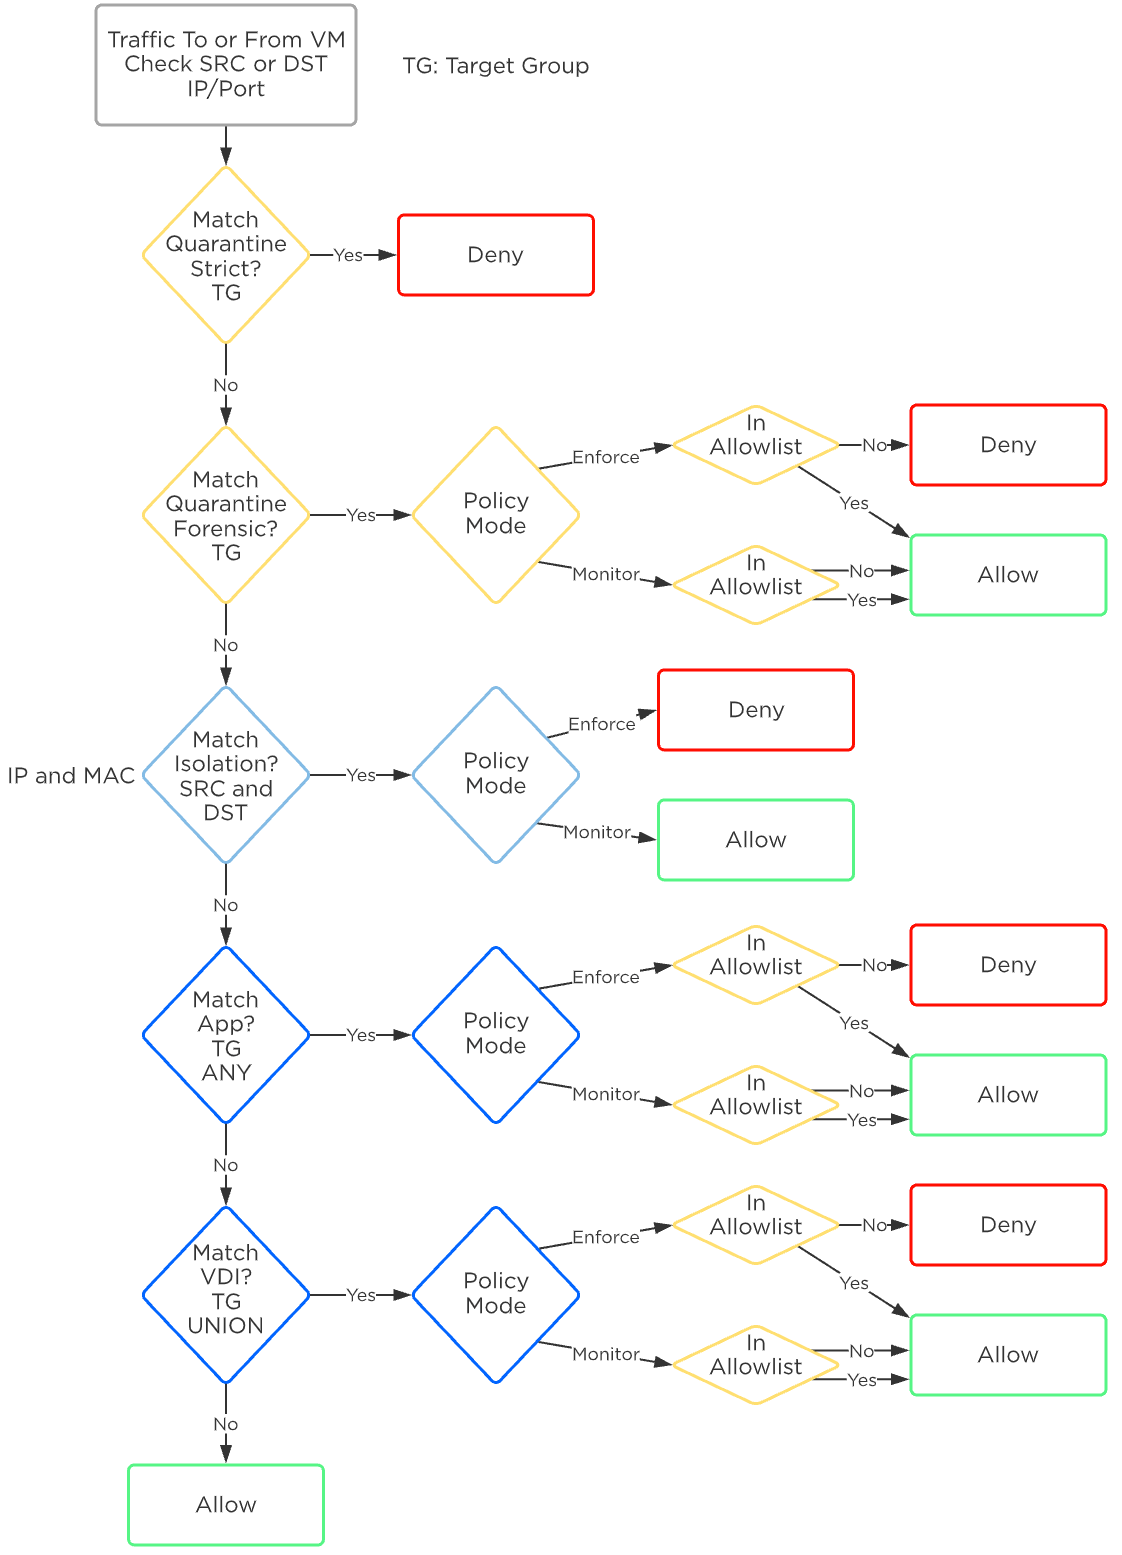 Flow Network Security - Policy Order
The first policy matched has the action taken, and all further processing stops. For example, if traffic encounters an Isolation policy that is in monitor mode, the action taken is to forward the traffic and log it as allowed and monitored. No further rules are evaluated, even if an Application or VDI policy further down the list would have blocked this traffic.
Further, VMs can belong to only one AppType category and on AppType category can be in the target group of only a single AppType policy. This means that any VM can only belong in the target group of one AppType policy. All traffic into and out of the VM must be defined in this single AppType policy. There is currently no concept of a VM being at the center of multiple Application policies, and therefore no conflict or evaluation order happens between Application policies.
Flow Network Security Next-Generation
Flow Network Security Next-Gen (FNS NG) provides a new security policy model that improves security policy flexibility and scalability while enabling new capabilities not found in previous versions of Flow Network Security. Enhancements made to the networking stack with the network controller, allow Nutanix to introduce the next-generation policy model for Flow Network Security.
Supported Configurations
The solution applies to the configurations below:
Core Use Case(s):
- Microsegmentation for network controller-enabled VLAN subnets
- Microsegmentation in VPC overlay subnets
Management interfaces(s):
- Prism Central (PC)
Supported Environment(s):
- On-Premises:
- AHV
Prerequisites:
- Nutanix network controller enabled
- Protected entities must use network controller-enabled VLAN subnets or VPC overlay subnets
Upgrades:
- Included in LCM as Flow Network Security 4.0.1
Compatible Features:
- Security Central
- Calm
Flow Network Security Next-Gen configuration is done via Prism Central by defining policies and assigning categories to VMs. Prism Central can define the security policies and categories of many connected AHV clusters in one place. Prism Central and the network controller implement the configured security rules on the virtual switch of each AHV host.
Implementation Constructs
Within FNS NG, there are a few key constructs:
Categories
Categories are text key-value pairs used to define groups of VMs that policies are applied to. Traditional system-defined categories are environment, application type, and application tier. With FNS NG, administrators can create security policies using any system-defined or user-created categories to protect applications. This enhancement provides flexibility, allowing a user to define categories that align with their application constructs and naming conventions.
- Category: “Key: Value” or Tag
- Examples System defined Keys: AppType, AppTier, Group, Location
- Examples User Defined Keys: AccessType, Service, Team
For example, a VM providing production database services may have the following assigned categories:
- AppTier: Database
- AppType: Billing
- Environment: Production
- AccessType: SecureAdmin
- Service: Monitor
These categories can then be leveraged by security policies to determine what rules or actions to apply. Categories aren’t only for Flow Network Security, you can also use these same categories for protection policies.
FNS NG Security Policies
Security policies are constructed of defined rules that determine what is allowed between a source and a destination. A rule inside an application policy includes all the inbound and outbound traffic for specific secured entities. A single rule can include multiple sources and multiple destinations. With FNS 4.0.1 and later, a VM can be a secured entity in multiple security policies, as opposed to requiring a VM to appear in only a single, monolithic policy in previous FNS versions. This allows users to create broader policies applied to a wide range of VMs to address requirements like shared services, monitoring, and even a default catch-all security policy, while still having a tightly focused security policy to protect applications. Using the multiple-policy approach streamlines security policy management, making it easier to update a policy when requirements or resources change.
For example, here’s how monolithic policies are used in the original FNS policy model. When an organization has 15 different applications to secure, each application has its own security policy for a total of 15 policies. Each of those application security policies contains rules specific to the requirements of the protected application. There are additional rules within each policy to secure VM management access and system monitoring. In this example, a change to the monitoring platform or the method used to monitor the component VMs of an application would require a change to each security policy. There are 15 security policies that would need to be updated. Each policy change increases the risk of a configuration error that could introduce an unwanted security exposure. Applying multiple security policies to a VM helps reduce or eliminate this risk.
Policy Interaction
Let’s investigate the multiple combined policy capabilities in FNS NG. Using the same example scenario previously mentioned, the applications are each protected with security policies specific to the requirements of the application, these are now 15 specific policies. In addition, the component VMs that make up the application could have a security policy applied that addresses management access and another security policy used for monitoring. With this method, a change to the monitoring platform or the method used to monitor the component VMs of an application would only require an update to the security policy that is used to restrict monitoring access. This is a change to only one security policy, monitoring, leaving the 15 security policies for the applications unaltered.
In the following example, we have a VM that is a secured entity in three separate security policies, Shared Services, MyHR App, and Enterprise Monitoring. It’s important to note that this same VM is protected with three separate categories. A single category can’t appear as a security entity in multiple policies.
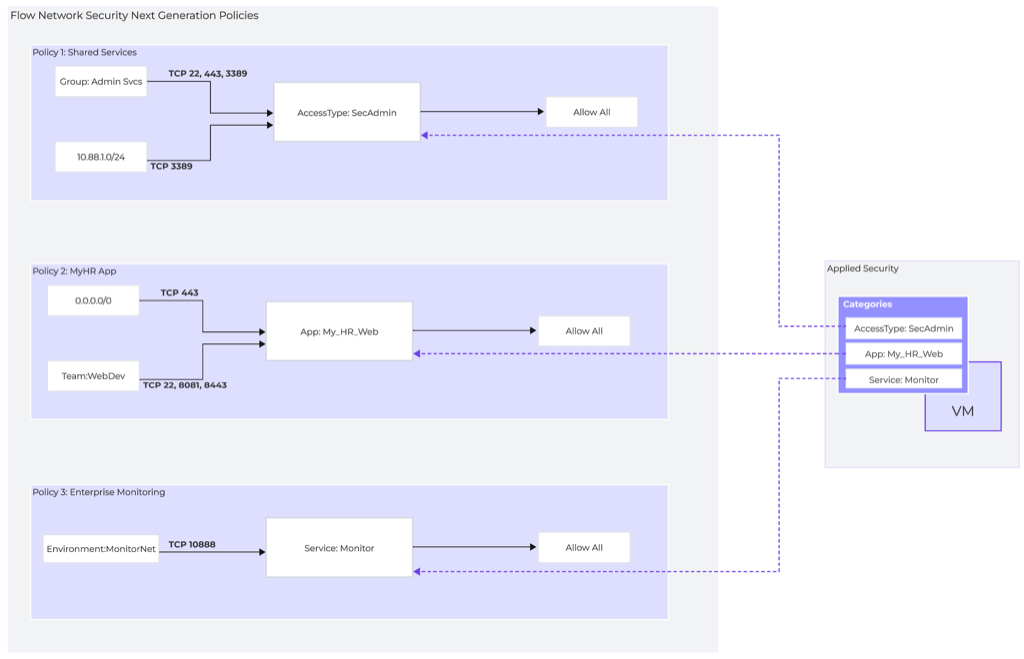 Flow Network Security Next Generation - Security Policies
Policy 1: Shared Services
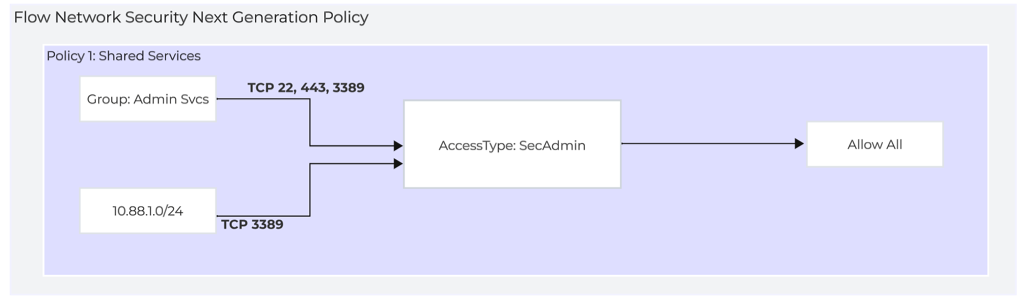 Flow Network Security Next Generation - Policy 1: Shared Services
This example Shared Services policy is used to permit secure administrative access to VMs that are in the category AccessType:SecAdmin This policy can be applied to multiple VMs and used as a default secure administrative access policy.
Policy 2: MyHR App
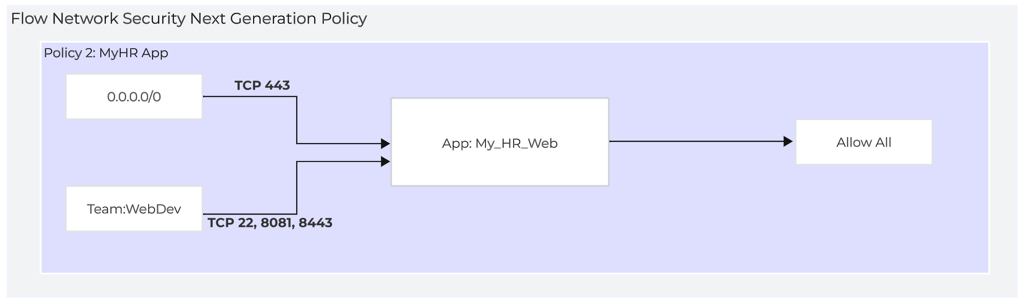 Flow Network Security Next Generation - Policy 2: MyHR App
The example MyHR App policy is used to restrict access to a specific application. VMs in the category App: HR_Web are protected by this policy.
Policy 3: Enterprise Monitoring
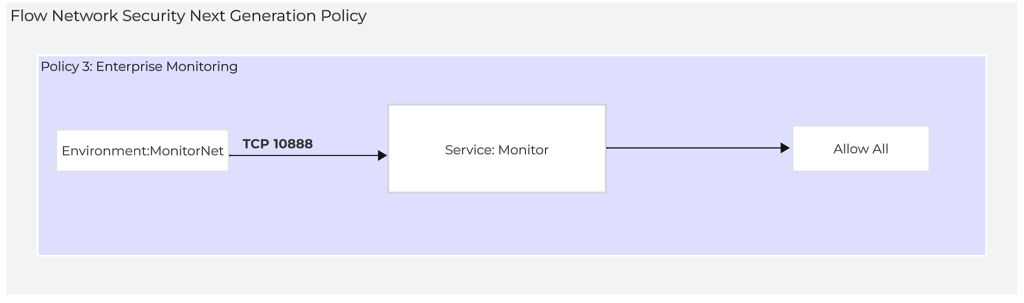 Flow Network Security Next Generation - Policy 3: Enterprise Monitoring
The Enterprise Monitoring policy is used to restrict application monitoring services to a specific source group. This is a good example of a policy that can be applied to many VMs independent of the application they are a part of. This could be a good default policy for new applications.
Security Policy Management
FNS NG introduces new policy mode constructs to enhance policy management. These additions streamline the task of administration at scale by making it easy to create new policies from templates or existing policies.
Security Policy Management options:
- Monitor
- Allow all flows, but highlight any packets that would have violated the policy in the policy visualization page.
- Enforce
- Enforce the policy by allowing only defined flows and dropping all others.
- Save
- The save option allows you to create a policy and make changes without applying the policy. This is helpful as information and requirements for the policy are being defined. You can create the policy and iterate changes as you solidify requirements. In this mode, the policy is saved in a draft state.
- Clone
- The clone option allows administrators to make a copy of an existing security policy. With this functionality, users can create a security policy with configured default security rules, and then save the policy to be used as a template for new application policies. Any time there is a new application that needs to be secured, users can clone the saved template policy and then update the secured entities of the policy to reflect the requirements of the application. This is a good method for maintaining the default security rules required for all apps.
» Download this section as PDF (opens in a new tab/window)
Today’s IT environments have fundamentally changed. Workloads are no longer confined to a single datacenter; they are distributed across multiple sites and clouds, in a truly hybrid and multicloud approach. This transformation brings agility and flexibility, but it also introduces new challenges. Operational silos complicate the management of multi-tenant infrastructures. Security must now extend across every layer, from the application to the network. Speed of execution is critical, as teams are expected to operate at cloud velocity without slowing down the business. Day-to-day operations are becoming increasingly complex, from deployments to migrations. Application mobility has also become an unavoidable reality, with workloads that must move freely between environments. In the face of this complexity, we must rethink how networks are designed, secured, and operated.
It is in this context that Software-Defined Networking (SDN) emerged. The core idea of SDN is to separate the control plane from the data plane, centralizing network intelligence while maintaining distributed execution at scale. SDN provided concrete answers to modern challenges by introducing programmability that replaces scattered manual configurations, automation that accelerates the delivery of network services, unified visibility that enables deeper understanding and protection of application flows, and abstraction that allows teams to operate at the level of business needs rather than IP addresses and VLANs. With SDN, the network becomes an agile service, aligned with the expectations of cloud and modern applications.
This is precisely where Nutanix Flow comes into play. By combining Flow Virtual Networking (FVN) and Flow Network Security (FNS), Flow provides an integrated approach to connectivity and security in Nutanix environments. FVN delivers the virtual networking infrastructure including VPCs, subnets, gateways, extensions, and hybrid interconnects. FNS brings distributed and stateful security controls natively embedded in the Nutanix hypervisor, AHV. Together, these components enable the design of agile, secure, and multicloud-ready architectures without unnecessary complexity or reliance on traditional appliances. Flow represents the vision of a network that is simple, elastic, and secure, built to support application mobility and continuous innovation. To begin this journey, we will first define what Flow is, why it was created, and how it fits into the broader Nutanix platform.
What is Flow
Flow Virtual Networking (FVN) and Flow Network Security (FNS) are two complementary components that work together to deliver and secure software-defined networks in a uniform way across the Nutanix hybrid multi-cloud landscape. They are designed with a simple but ambitious vision: to bring networking and security to the same level of simplicity and automation that Nutanix has achieved for compute and storage. Traditional networks are complex, rigid, and heavily dependent on specialized appliances. Flow removes this barrier by embedding networking and security directly into the Nutanix platform.
The value proposition of Flow rests on three pillars. First, it simplifies operations by providing a unified framework to manage both connectivity and security across virtualized environments. Second, it enables application-centric architectures where policies and connectivity follow workloads, regardless of where they are deployed. Third, it prepares enterprises for hybrid and multicloud realities, extending secure connectivity beyond the boundaries of a single datacenter. This design philosophy has resulted in a platform that enables customers to move faster, operate more securely, and reduce the operational overhead typically associated with networking and security infrastructure.
While FVN is focused on building and extending networks, FNS is focused on securing them. Together they form a complete solution for application connectivity and protection. FVN provides the constructs required to build modern virtual networks. It introduces VPCs, overlay subnets, gateways, VPN connectivity, BGP-based dynamic routing, and load balancing. These capabilities allow Nutanix environments to connect seamlessly to each other, to external datacenters, and to public cloud resources.
FNS delivers distributed, stateful firewalling natively on AHV hosts. It enforces microsegmentation policies between workloads and reduces lateral movement risks without requiring external firewalls for east-west traffic.
Architecture and Components
AHV Base Networking Architecture
AHV leverages Open vSwitch (OVS) to present traditional VLAN networks, with each node running an instance of OVS via a default bridge, called br0. You must attach physical interfaces to br0 to act as uplinks, either as standalone uplinks, in active/passive or active/active aggregates. Additional bridges can be created as needed. An additional bridge, not managed by OVS, called virbr0, also exists to facilitate internal AOS networking.
Across all of the nodes in a cluster, the bridges are aggregated into a virtual switch. The default virtual switch is called vs0. To facilitate this, each host in the cluster must have identical uplink port configuration. The physical switch ports for each host should also be configured identically, presenting the same VLANs to each host’s uplinks.
Subnets are added to the virtual switch and defined by a VLAN tag. This makes the subnet available on every host’s bridge. VMs are connected to subnets, which connect by way of tap ports.
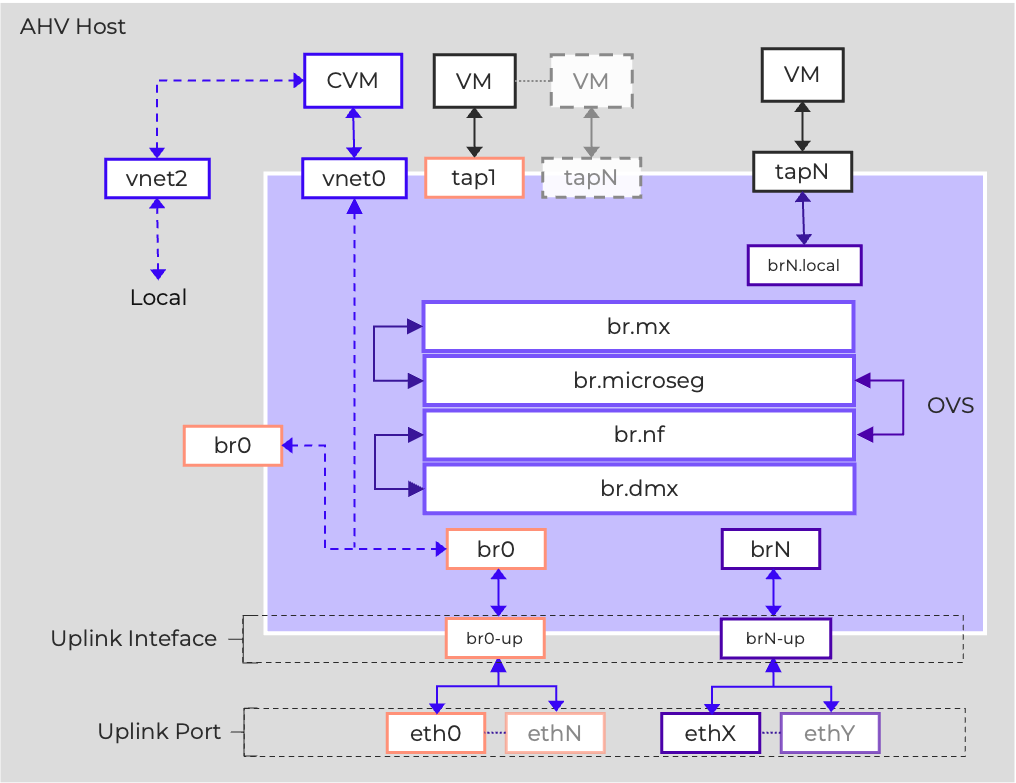
Nutanix Flow is implemented as extensions of the base AHV networking systems, so an understanding of that base networking is valuable in understanding the data plane.
Flow Three-Plane Architecture
Nutanix Flow is structured in a familiar three-plane architecture (Management, Control, Data) that enhances the OVS-based networking on the AHV hosts with added functionalities through the Open Virtual Network (OVN) project.
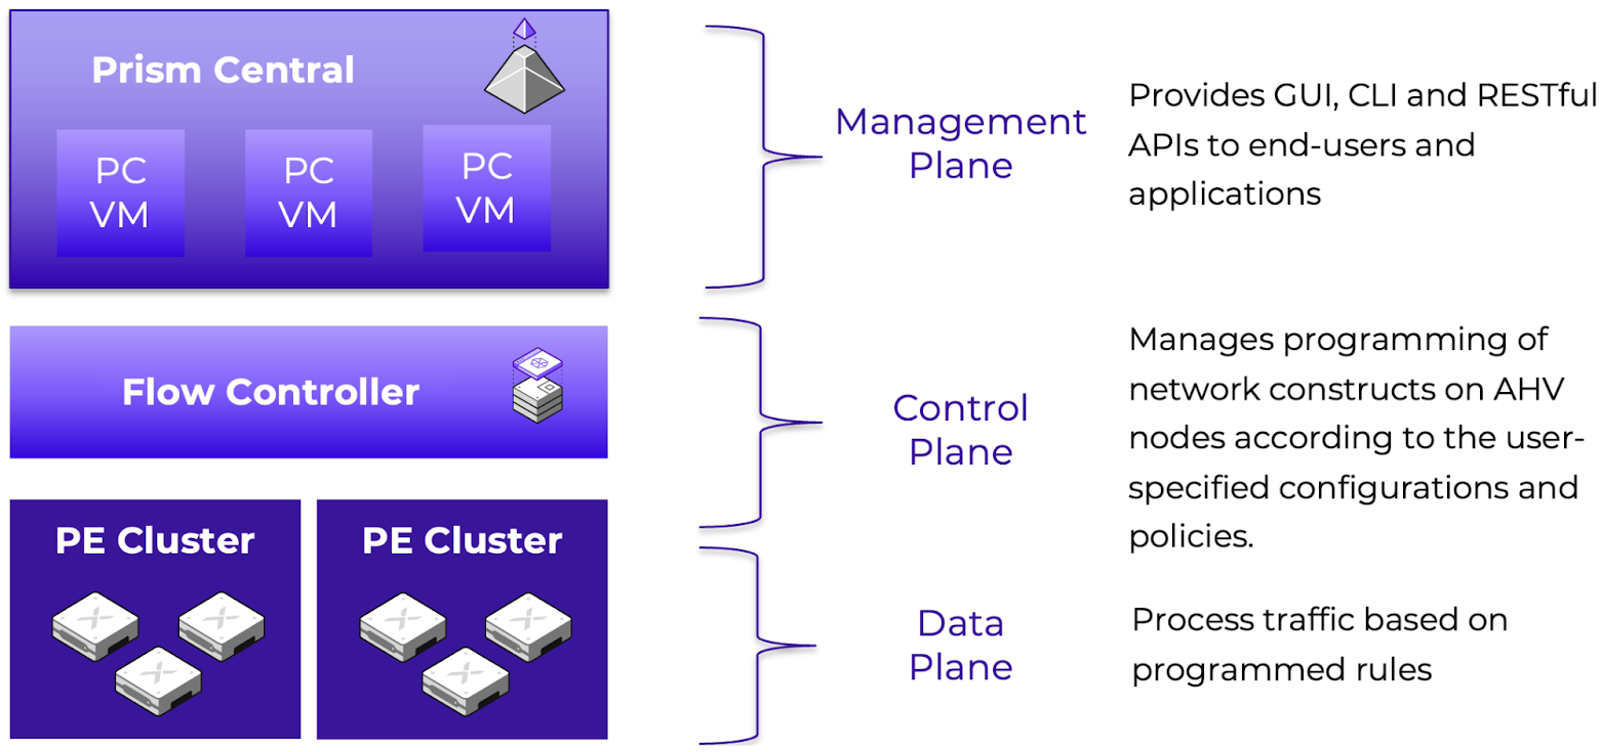
The Management Plane is delivered via Prism Central, the single management plane for Nutanix clusters, ensuring a consistent operational model for administrators. Prism Central provides GUI, API, and CLI interfaces for CRUD operations and monitoring. There are four primary services that work together to provide the management plane:
- Adonis is the Prism Central API gateway service that accepts API calls from end users.
- Atlas is the service responsible for handling FVN related API calls, deploying/monitoring the network controller, managing and monitoring the health of hosts, managing FVN entities in the central database, called Insights Data Fabric (IDF), and updating the control plane database with FVN and FNS configuration.
- Flow is the service responsible for handling FNS related API calls, managing FNS entities in the IDF, creating and managing service groups and address groups, and calling the microseg service to take care of security rule operations.
- Microseg is the service responsible for evaluating configured network security rules received from the flow service, identifying the port-sets and security groups required, and making calls to the Atlas service.
The Control Plane has a centralized component called the Flow Controller, formerly Network Controller, formerly Advanced Network Controller (ANC), as well as a distributed component that runs on each AHV host. The Flow Controller is delivered as a set of containerized services. You can deploy the Flow Controller in integrated mode which leverages the built-in Prism Central Container Microservices Platform (CMSP). Alternatively, standalone mode deploys the Flow Controller on SMSP (Services Microservices Platform) using three worker VMs and two load balancer VMs. The Flow Controller creates virtual overlay networks as an abstraction of the underlay (VLAN networks), managing network services.
The main services of the control plane include:
-
Hermes is the service that manages OVN configuration, receiving updates from Atlas and converting them to OVN logical configuration, and sending that configuration to the OVN components. Hermes also collects metrics from each AHV host’s OVS instance. Hermes consists of two sub-components: anc-hermes is the main service, and anc-mysql (MariaDB) stores the Hermes configuration. These service names reflect the prior Atlas Network Controller naming, ANC.
-
Open Virtual Network (OVN) is responsible for programming the data plane elements on the AHV hosts. OVN has centralized components hosted on the network controllers, and distributed components hosted on each AHV host. On the Network Controller, there are two main components: anc-ovn which runs the ovn-northd service as well as the OVN NorthboundDB and SouthboundDB, and anc-policydb which handles mapping connections to policies for visualizations and hitlogs. On each AHV host, the ovn-controller service is responsible for taking configuration from the OVN SouthboundDB and programming the data plane elements on the local hypervisor accordingly.
The Data Plane is fully distributed, allowing implementation of the network and security constructs across the AHV hypervisor nodes. This allows for an efficient, resilient environment that avoids bottlenecks and scales in capacity as clusters grow. It comprises the following parts:
- brAtlas is an OVN-managed OVS bridge that is created on every hypervisor node. FVN constructs and FNS rules are realized in brAtlas as OpenFlow rules, with VPCs being defined as logical routers, subnets being defined as logical switches connected to those logical routers, and security policies defined as ACLs. BrAtlas is managed by the ovs-vswitchd service which stores information via the ovsdb-server service.
This tight integration means that Flow is not an external add-on, but rather a native capability of the Nutanix Cloud Platform. Administrators can create VPCs, configure gateways, define security policies, and monitor traffic without leaving Prism Central. For customers, this results in a consistent operational experience across compute, storage, networking, and security.
In the following sections, we will discuss the specifics of the Flow Virtual Networking data plane implementation.
Flow and Multitenancy
Nutanix Flow is able to deliver both functional multitenancy and administrative multitenancy through this three-plane architecture.
Functional tenancy defines whether the environment is logically partitioned to provide private network resources to disparate groups. These groups can be internal groups, such as departments, development teams, or business units. They can also be external groups, such as clients consuming resources from a service provider. Functional multitenancy in Flow is similarly implemented through the data plane implementation of Virtual Private Clouds, allowing individual groups to have their own networks as well as their own security policies.
Administrative tenancy defines whether administrative access and functions are made available to multiple groups to manage their own resources. This can also be internal, where RBAC is used to grant selective access to staff members via a single identity provider (IdP), or external, where multiple IdPs are configured, enabling external clients to access the environment. Administrative external multitenancy is typically only found in service provider environments. Prism Central enables administrative multitenancy through configuration of multiple identity providers and through assigning resources to Projects.
Flow Integrations within the Nutanix Ecosystem
Nutanix Flow extends the capabilities of the Nutanix Cloud Platform, using the flexibility of Software Defined Networking to further existing capabilities. For example:
- Disaster Recovery (DR): Flow simplifies Disaster Recovery through the integration of network failover; enabling workloads to maintain private IPs during DR events, as well as enabling easier testing through partial-network failovers.
- Nutanix Move: Nutanix Flow can simplify migrations by enabling cross-platform connectivity with source infrastructure, allowing migrated workloads to maintain their private addressing while still allowing for flexibility in migration phasing.
- External Appliances: Flow supports service insertion with third-party virtual appliances, such as Palo Alto Networks VM-Series firewalls. Flow redirects traffic to these appliances for advanced inspection, while maintaining the native overlay connectivity.
Flow Virtual Networking (FVN)
Logical Switching
Enabling Flow Virtual Networking introduces two new types of Subnet which are provisioned on brAtlas. These are Controller-Managed VLAN Subnets and Overlay Subnets. The Network Controller provisions and manages these subnets as OVN logical switches. When a VM NIC is connected to an FVN subnet, a Logical Switchport is defined which maps the vNIC to the logical switch.
Controller-Managed VLAN Subnets
FVN enables provisioning and managing VLAN-backed subnets via the Network Controller. These Controller-managed VLAN-backed networks are referred to simply as VLAN Subnets. Enabling FVN relabels the existing AHV-managed VLANs configured on br0/vs0 as VLAN Basic Subnets.
When a controller-managed VLAN Subnet is created, a logical switchport, called a localnet port, is created to connect brAtlas to br0 to present that VLAN to the Network Controller. Configuring a VLAN as controller-managed enables the VLAN to provide external connectivity for VPCs, as well as enabling VMs residing on that VLAN to be secured via Flow Network Security Next-Gen.
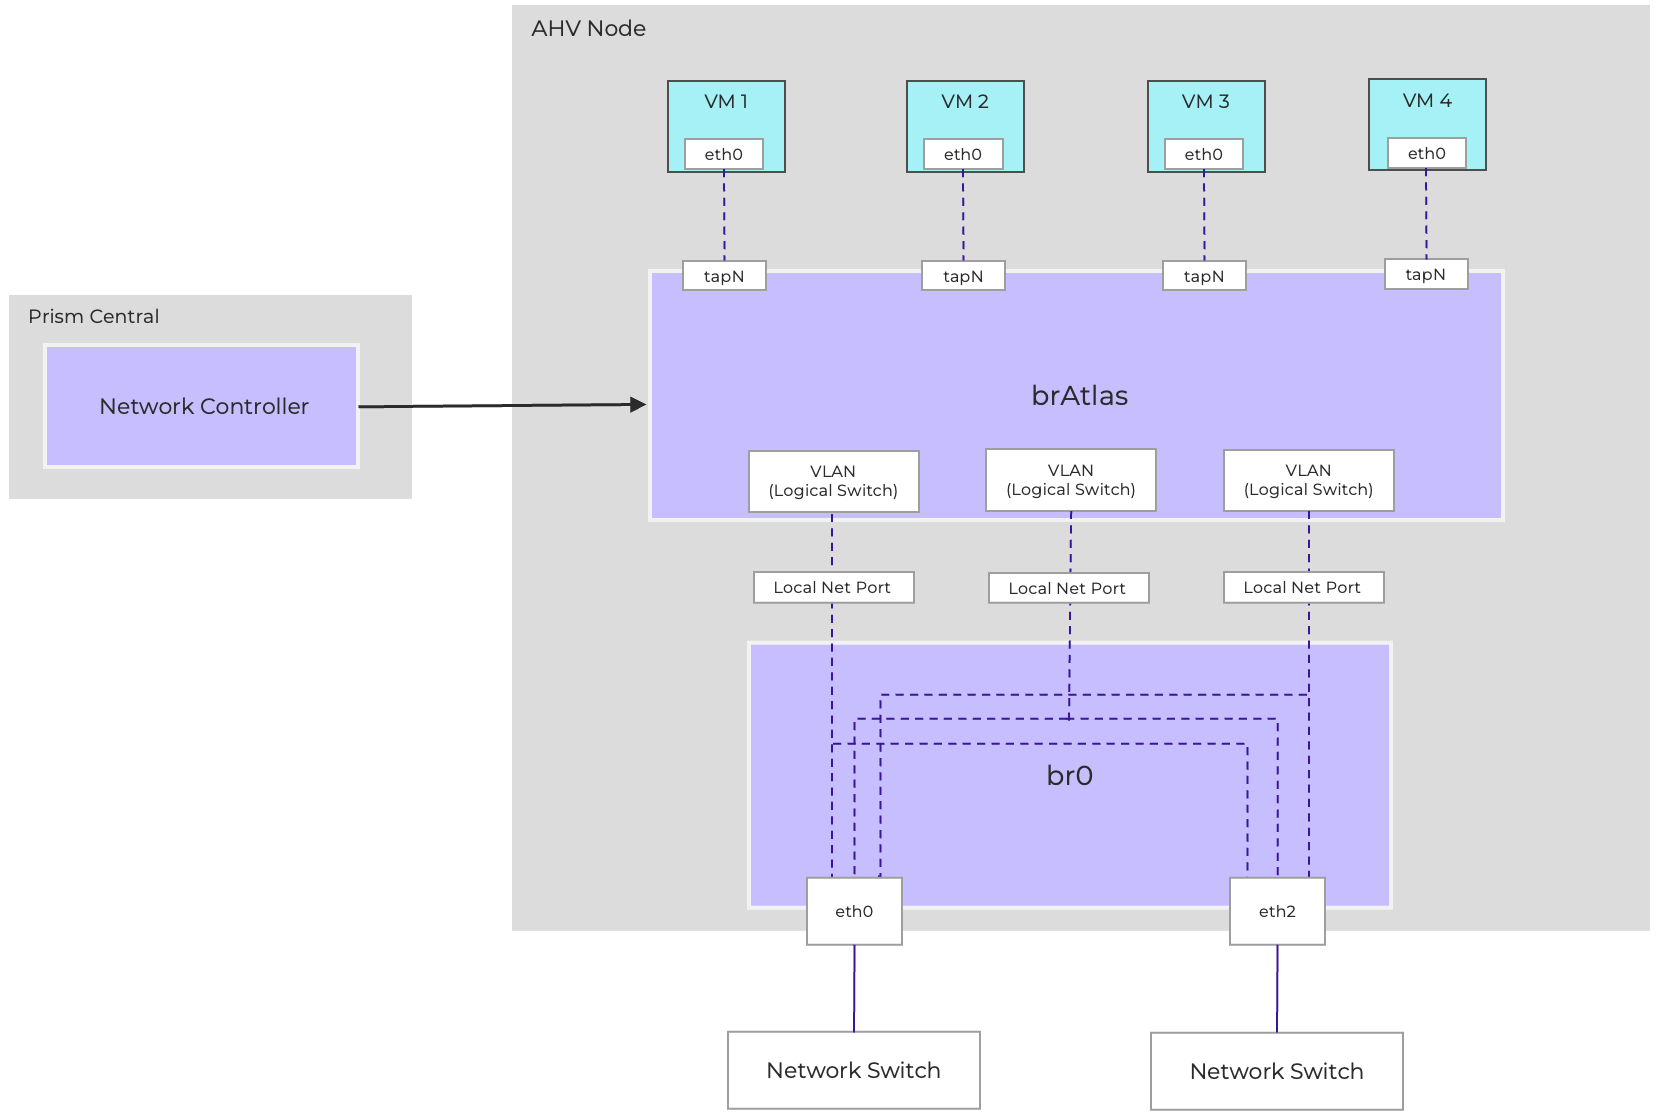
Diagram showing connectivity between brAtlas and br0 for VLAN-backed connectivity.
Controller-Managed VLAN Subnet Traffic Handling
VLAN-backed subnets provide Layer 2 connectivity through VLANs established on the physical network. As a result, all virtual machines (VMs) connected to the same VLAN-backed subnet are Layer 2 adjacent. Connectivity between two VMs on the same host and the same VLAN-Backed subnet occurs entirely within the local bridges. If the VMs are on different hosts, the Ethernet frames will be sent to the destination VM via the physical infrastructure using standard Ethernet framing and switching.
Overlay Subnets
Overlay Subnets are software-defined layer-2 networks that operate independently of the physical network (the underlay). This allows workloads to be placed anywhere in the environment while maintaining consistent addressing and connectivity, regardless of the underlying VLAN or switch configuration. The overlay ensures flexibility and simplifies operations, since administrators no longer need to manage large numbers of VLANs across the physical fabric.
Flow leverages Geneve network encapsulation to manage and transport overlay traffic. Each brAtlas bridge (and therefore each host) acts as a Geneve Tunnel Endpoint (TEP). When two VMs in the same Overlay subnet but residing on different hosts need to communicate, the host and bridge at the source will encapsulate the packet with Geneve, and the host and bridge at the destination will decapsulate and deliver it.
When VMs are in the same VPC and on the same AHV host, the IP traffic does not leave that host.
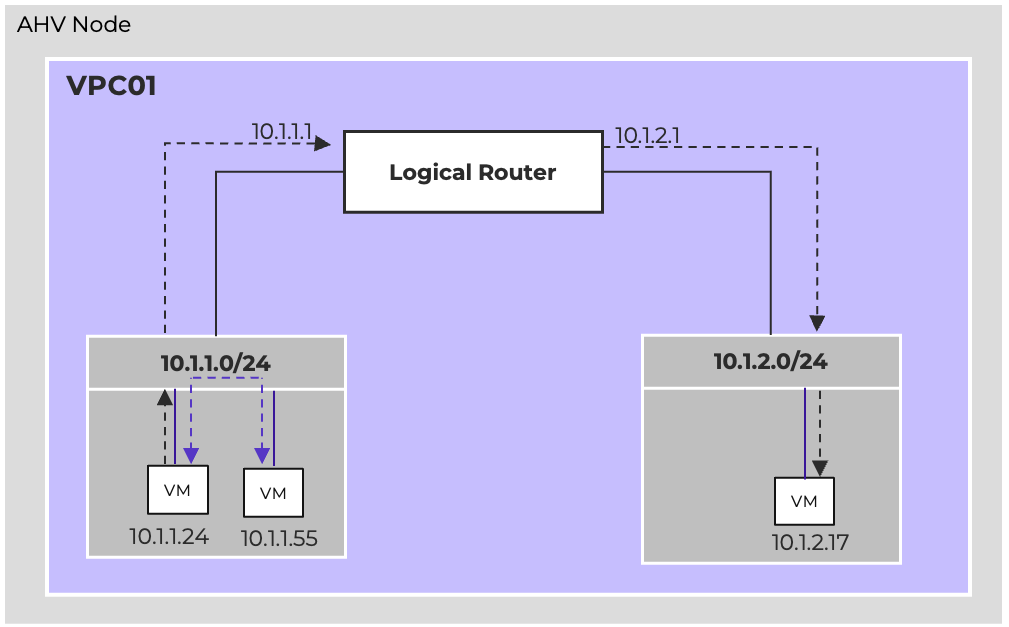
For communication between two VMs in the same Overlay subnet but situated on separate hosts, the process involves encapsulation and decapsulation using Geneve. Specifically, the source host and bridge will encapsulate the packet with Geneve, and the destination host and bridge will then decapsulate it before delivery.
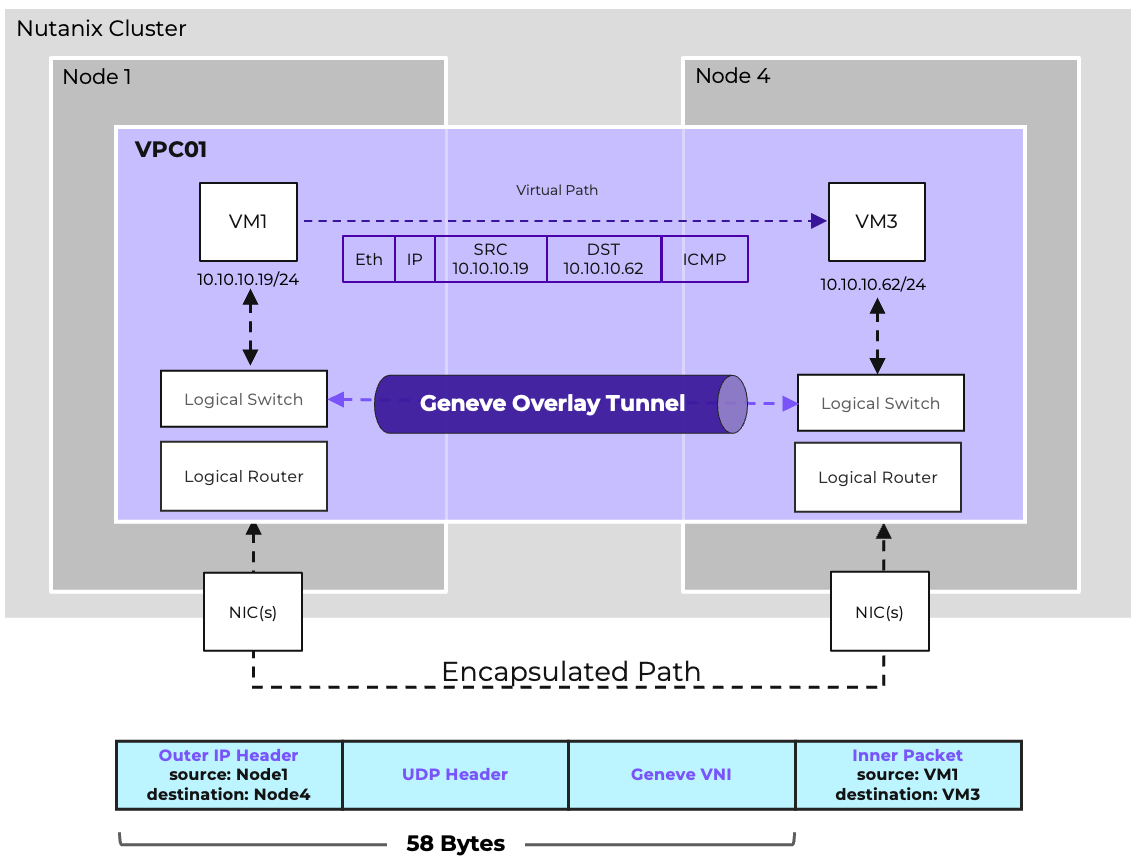
Overlay networks are able to span multiple AHV clusters, provided that the clusters are managed by the same Prism Central and Network Controller. All hosts must be able to communicate via UDP port 6081 to allow Geneve traffic. By default, Overlay traffic traverses vs0/br0, using the main AHV hypervisor IP as the TEP address, but this is configurable. If additional physical uplink ports are available, an additional virtual switch can be created and IPs can be assigned to each host on that virtual switch. The cluster can then be configured to use the alternative virtual switch for Geneve TEP traffic via acli, the command line interface for cluster networking, with the command:
net.set_vpc_east_west_traffic
For more information on controlling the TEP traffic, refer to the relevant section of the AHV Admin Guide.
Overlay Subnet Traffic Handling
Flow Virtual Networking and the underlying OVN and OVS subsystems implement certain traffic handling procedures to more efficiently handle overlay traffic and limit unnecessary broadcast traffic.
MAC to Host Mappings
OVN maintains a table of MAC to Chassis mappings, called the Port_Binding table, which identifies the AHV host responsible for each vNIC (called a logical port by OVN/OVS), and includes statically defined MAC and IP information. A second table, the MAC_Binding table, tracks MAC to IP associations learned through observing ARP traffic. This information is tracked in a database on the Network Controller which is continuously replicated to each participating AHV host. Additionally, each host maintains a table with information about all other hosts, allowing Geneve tunnels to be established to any remote endpoint without requiring additional lookups.
Unicast Traffic
When a VM needs to send traffic to another VM on the same subnet, and the guest OS does not already have an ARP entry for the destination, the VM will generate an ARP request. On a traditional physical underlay network, this ARP request would be flooded to all hosts in the subnet. However, on an Overlay Subnet, ARP Suppression is used, whereby the local OVS instance on the AHV host will forge an ARP reply using the data replicated from the Network Controller. This reduces the amount of broadcast traffic within the environment. Once the VM receives the ARP reply, traffic is either locally switched within the AHV host if the VMs reside on the same host, or encapsulated and sent to the appropriate destination host via a Geneve tunnel.
Broadcast Traffic
Broadcast traffic is handled via a process called ingress replication. The source AHV host will send one encapsulated copy of the frame to be flooded to each remote chassis, and the remote chassis will distribute the frame locally as needed to the relevant VMs connected to the FVN subnet. This reduces the traffic traversing the physical underlay while still ensuring proper delivery of the broadcast frame to all VMs in the Subnet.
Unknown Unicast
Unknown Unicast traffic will be dropped unless a Subnet Extension is configured for that Overlay Subnet, in which case all Unknown Unicast traffic will be forwarded to the VTEP Gateway.
Multicast
Multicast Traffic will function within a single Overlay Subnet, but there is no support for IGMP Snooping within overlay subnets.
Subnet Type Use Cases
Choosing between Subnet types depends on operational needs. In most cases, Overlay subnets simplify operations, while VLAN-backed subnets are reserved for specific integration points.
Overlay Subnets enable workloads to be distributed across the Controller-managed cluster freely, allowing for full workload mobility and network design flexibility. New Overlay Subnets can be provisioned immediately, either manually or via automation, without any additional configuration on the underlay. Most importantly, they connect workloads to Virtual Private Clouds. They also enable additional features including Network Load Balancing and Flow Network Security Next-Gen.
VLAN Subnets are required to provide external connectivity to Virtual Private Clouds. Additionally, VLAN Subnets are recommended for any workloads requiring direct layer-2 adjacency to resources that cannot be placed directly on an Overlay subnet (physical resources or VMs outside of the domain of the Network Controller). Subnet Extensions can be used to bridge an Overlay subnet to a physical VLAN, but this is not suitable for all use cases. VLAN Subnets are required for any workloads that wish to take advantage of Flow Network Security’s Service Insertion feature.
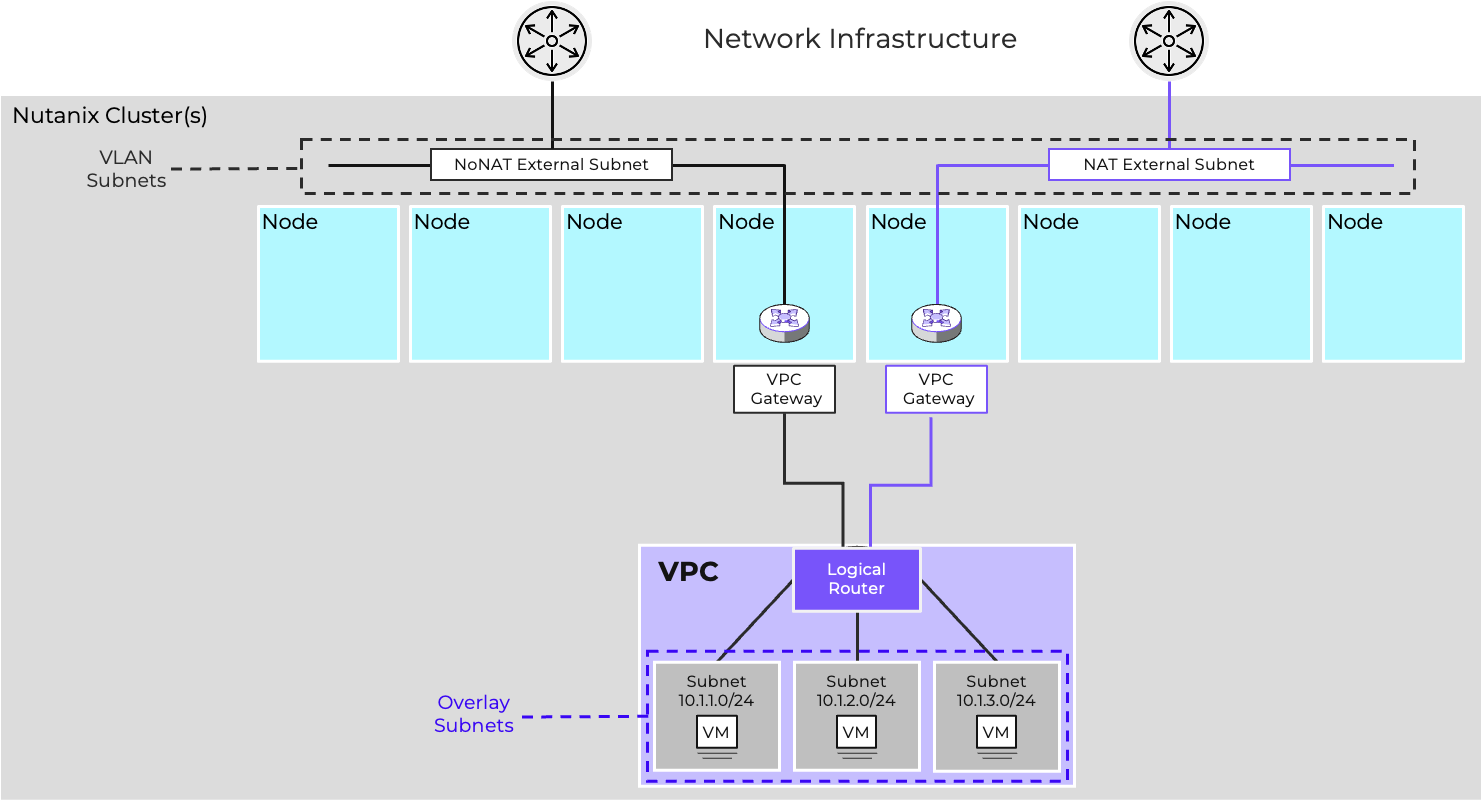
Addressing, DHCP, and IPAM Choices on AHV
Flow Virtual Networking provides DHCP functionality, referred to as Nutanix IPAM. This is optional for VLAN-Backed Subnets and required for Overlay Subnets. When Nutanix IPAM is enabled for a subnet, a network, gateway, and pool of addresses must be defined. When using IPAM, administrators can also define DNS servers, a DNS domain name, DNS search domains, a TFTP server, and a boot image.
Administrators can either allow addresses to be assigned dynamically from the pool or statically assign IP addresses to VMs via Nutanix IPAM which act as a DHCP Reservation, guaranteeing address assignment. If it is preferred that the guest OS be configured with a Static IP, that is also an option. It is suggested that the VM also be statically assigned the same IP address within IPAM. There are no reserved IP addresses other than the gateway and broadcast address. Any valid IP address can be assigned to a VM, regardless of whether or not it is in the IP Pool allocated for dynamic assignment.
DHCP leases are considered to be infinite; there is no need to release and/or renew addresses. IP addresses are released when a VM or vNIC is removed, or when an address is manually changed.
VLAN-Backed subnets can be configured to use External IPAM, in which case Nutanix IPAM/DHCP services are not enabled, and an external DHCP server can be used if dynamic addressing is required.
Logical Routing
At the heart of Flow Virtual Networking is the Virtual Private Cloud, or VPC. A VPC is an isolated networking domain within the Nutanix environment, allowing tenants or applications to operate in their own dedicated space. VPCs feature a fully distributed virtual router that offers logical routing for multiple Overlay Subnets and provides north-south connectivity through External Networks. Different VPCs can share the same IP address ranges without conflict because they are isolated network domains. This overlap is common in multi-tenant and multicloud environments, where address ranges are often duplicated across various sites or customers.
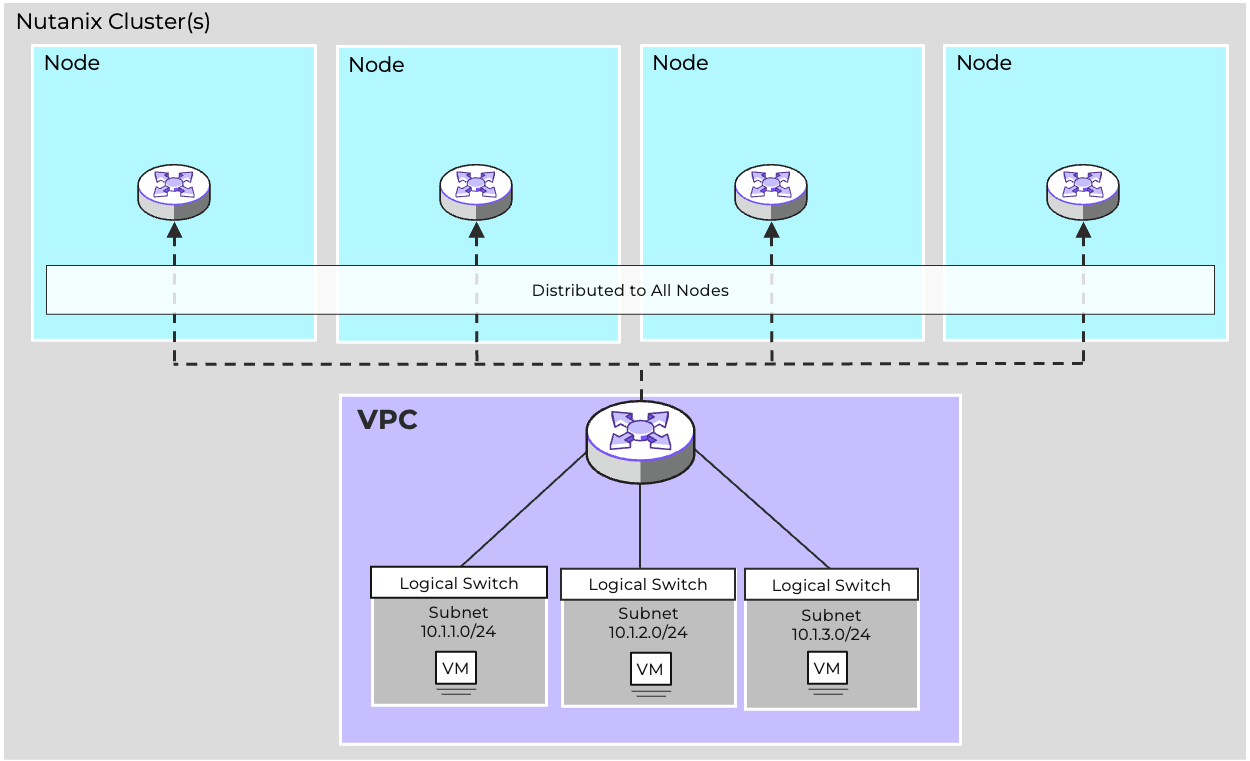
Routing decisions are made locally on the host where the traffic originates. The Network Controller ensures that the logical router state is synchronized across all hosts, so that routing behavior is consistent throughout the cluster. This distributed design enables high availability, since there is no single routing bottleneck.
In the example shown, both VPC01 and VPC02 can be configured with 10.10.1.0/24 and 10.10.2.0/24. An IP overlap model is a key enabler of workload mobility and tenant isolation. Each VPC virtual router maintains its own forwarding table and enforces separation from other VPCs. Connectivity between VPCs, if needed, is explicit and controlled, rather than implicit. This ensures that tenants remain isolated unless policies or gateways are deliberately configured to provide interconnection.
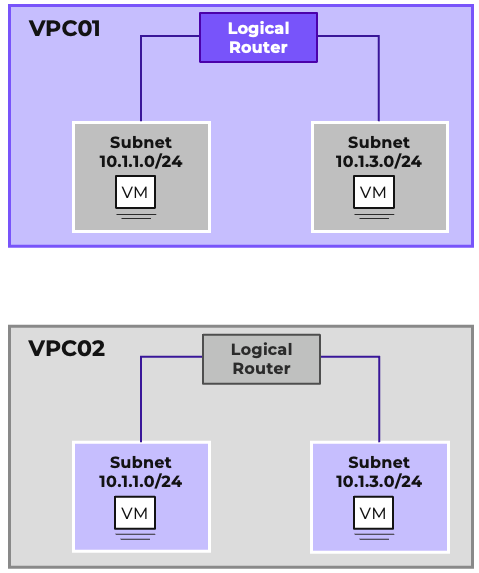
Stateless Scale & High Availability
VPCs provide scale and high availability through their fully distributed, stateless architecture, implemented as an OVS logical router on each AHV node, managed centrally by OVN through the Network Controller. Each AHV host can route and switch traffic for each VPC subnet, enabling traffic to be processed as quickly and efficiently as possible. Through this stateless, distributed design, VPC throughput scales as clusters grow, while the failure of a single AHV host will not disrupt east/west connectivity for the remaining hosts.
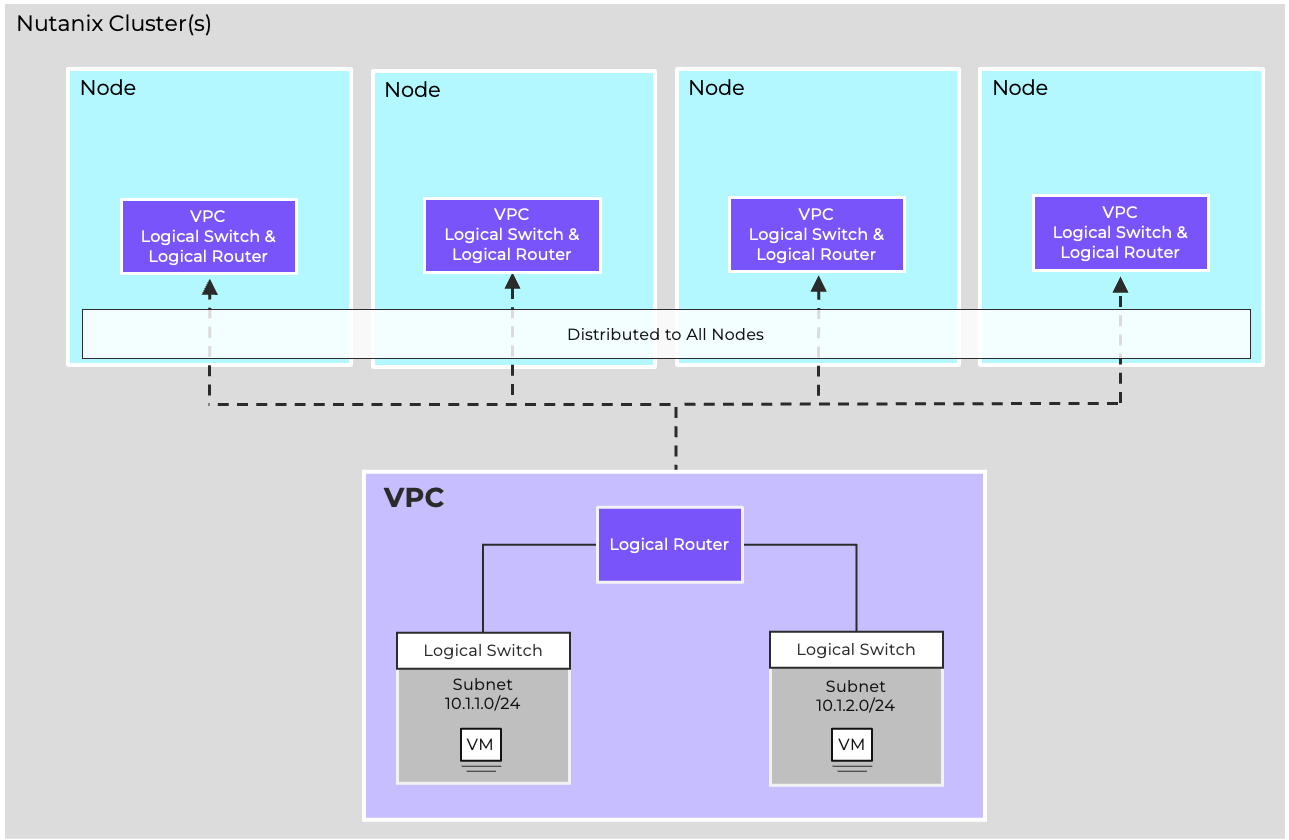
Stateful Services & Network Gateways
Stateful network services for the VPC, including BGP, VPN, and VXLAN, are implemented by way of Network Gateway VMs. This disaggregation of stateful functionality from the stateless logical router allows these stateful services to be implemented without impacting the ability of the logical router to scale. We will cover the specific functionality of each network gateway type in depth in the relevant section.
Routing Capabilities
Each VPC has a route table that defines how layer 3 traffic should be forwarded. There are three types of routes, which are prioritized by type. Local routes are the highest priority and indicate directly-connected traffic for VPC Overlay Subnets. Static routes are next, and allow VPC administrators to define which external network is selected for different network destinations. Dynamic routes are learned via BGP and allow for routes to be automatically learned from the physical infrastructure. Refer to the Dynamic Routing section for more details on how BGP is implemented in Flow Virtual Networking.
Additionally, Network Policies allow for policy-based routing, both for east/west and north/south traffic.
Reroute policies redirect traffic to a destination within the VPC, while forward policies redirect traffic to an external destination. These policies can identify traffic by source, destination, port, and/or protocol. Refer to the Network Policies section for more details and configuration examples.
Hierarchical Capabilities for Operational Simplicity
VPC designs can be either single-tier or two-tier. In a single-tier architecture, each VPC is directly connected to the network infrastructure via VLAN-backed external networks.
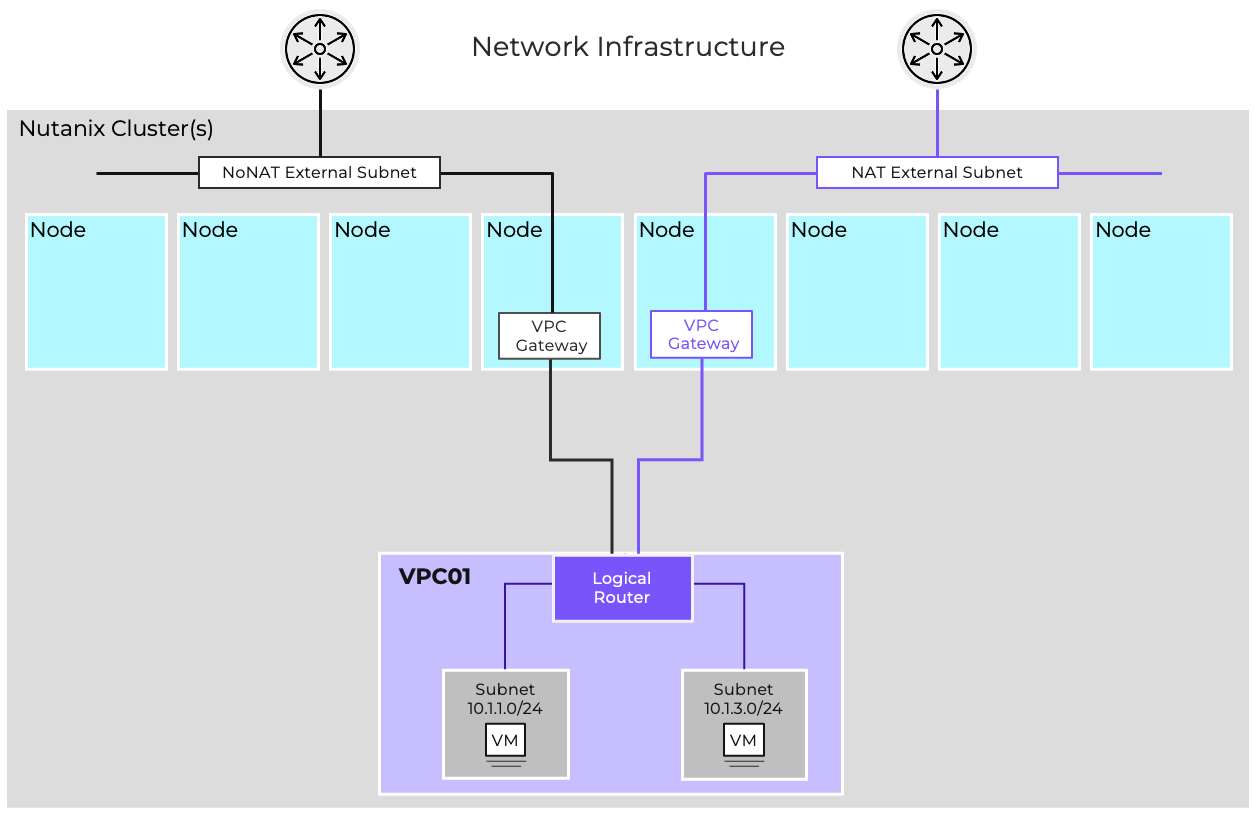
Two-tier architectures leverage Transit VPCs with a specially configured VPC providing centralized north/south connectivity for one or more connected VPCs. A Transit VPC is often used in situations where functional multitenancy is required, such as in service provider environments with multiple isolated clients, software development teams that need to provide isolated networking for multiple developers and/or environments, or organizations with specialized workloads requiring isolation.
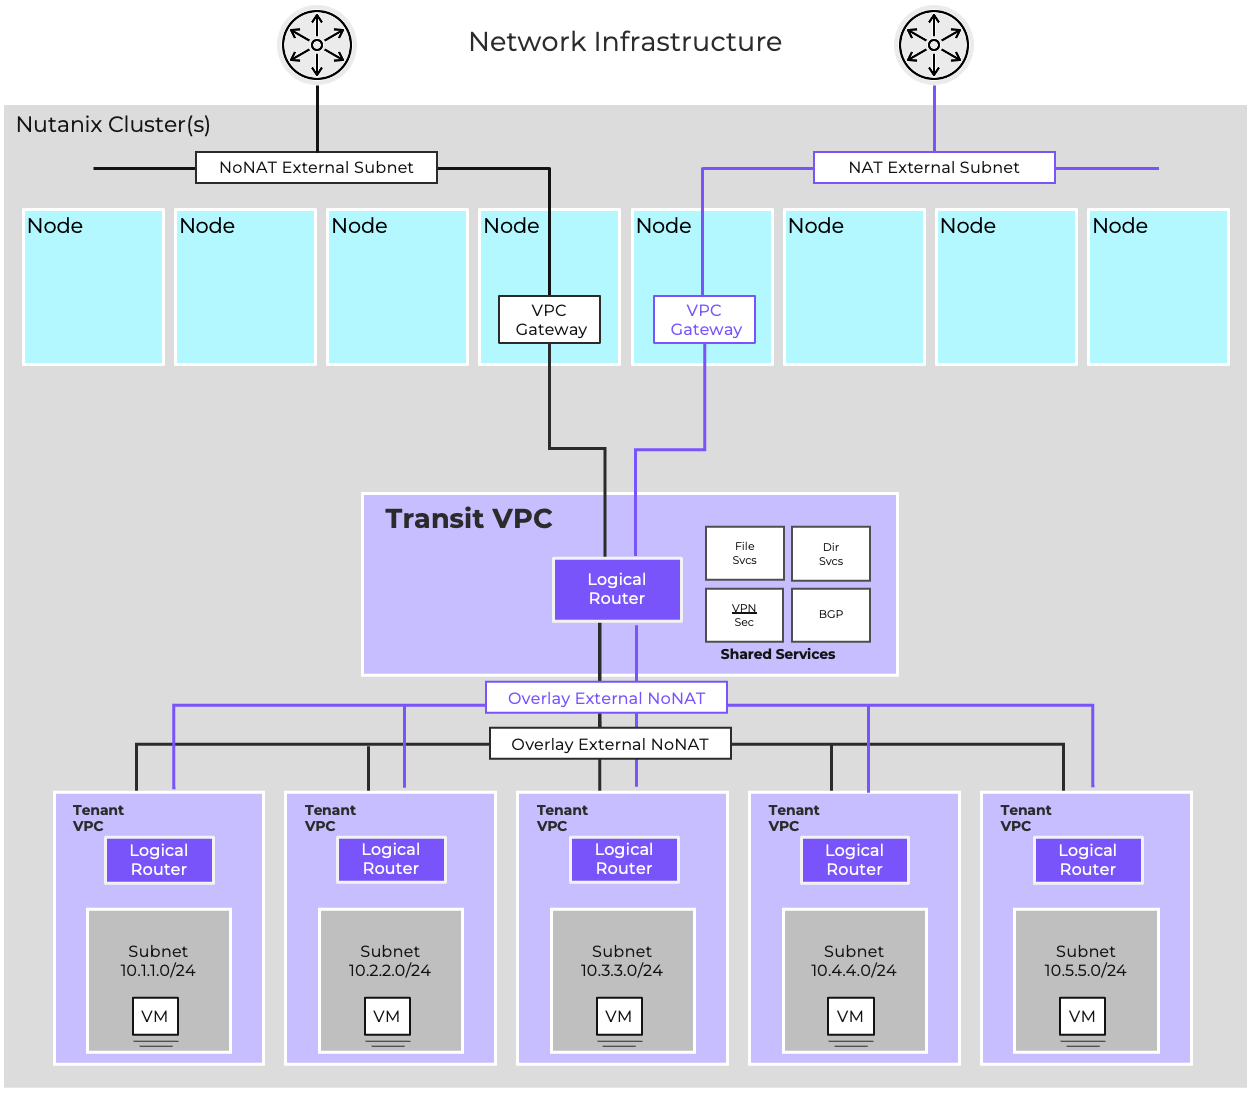
Network Controller Role in FVN
When a new subnet is created or a gateway is configured, the Network Controller automatically generates the necessary control plane entries and distributes them to the relevant hosts. Each VPC has its own logical router, which provides the routing domain for its subnets. The Network Controller ensures these logical routers are instantiated consistently across the cluster, without manual intervention.
Creating VPCs and Subnets
Flow Virtual Networking deployments start with the creation of a VPC. A VPC defines an isolated routing domain that can host one or more subnets. Administrators use Prism Central to create a VPC, assign an address space, and then add subnets within it. Each subnet is associated with a specific IP range and can be configured as either an overlay or VLAN-backed subnet depending on workload requirements.
Subnets can be used to separate applications, environments, or tenants. For example, a VPC may contain distinct subnets for frontend, backend, and database tiers, all connected through the VPC’s logical router.
VPC External Connectivity
External Networks
External Networks are subnets specially configured to provide external connectivity for VPCs. External networks can either be controller-managed VLAN subnets or overlay subnets created in a Transit VPC. External networks can either be NAT or Routed (NoNAT) external networks.
NAT External Networks allow VMs and subnets to remain private to the VPC, while Routed (NoNAT) External Networks allow VMs and subnets within the VPC to be directly reachable. A single VPC can be connected to one of each type of external network, and a single external network can provide connectivity to multiple VPCs.
NAT External Networks
A NAT External Network hides the private IPs of the VMs behind NAT IPs. These can either be one-to-many SNAT IPs or one-to-one NATs, called Floating IPs. SNAT IPs are used as the outbound IP for traffic egressing the VPC via the NAT External Network. Floating IPs allow a VM to be externally reachable for purposes of publishing services.
The NAT External Network provides a gateway for VMs in private overlay networks to access resources external to the VPC without being directly routable. It supports SNAT and Static NAT (Floating IP). IP addresses for NAT are allocated via the NAT External Network’s IPAM configuration.
- SNAT hides private IPs behind a single routable IP for outbound connectivity
- Floating IPs provide per-VM static NAT for both inbound and outbound reachability
- Overlapping IP addresses can be used across different VPCs
For example, in the diagram shown both ProdVPC and DevVPC use the 192.168.100.0/24 address space, and are provided external connectivity via Flow-Ext-NAT. SNAT IPs for each VPC are allocated out of the external network’s IP pool 10.10.200.10-100, with 10.10.200.10 being assigned to ProdVPC and 10.10.200.11 being assigned to DevVPC. In each VPC, the web servers are made externally reachable by assigning Floating IPs. This allows both ProdVPC and DevVPC instances to have their web servers externally reachable via unique IPs without requiring unique private addressing within the VPC. In each VPC, Web and App servers communicate via the VPC-specific instance of 192.168.100.0/24.
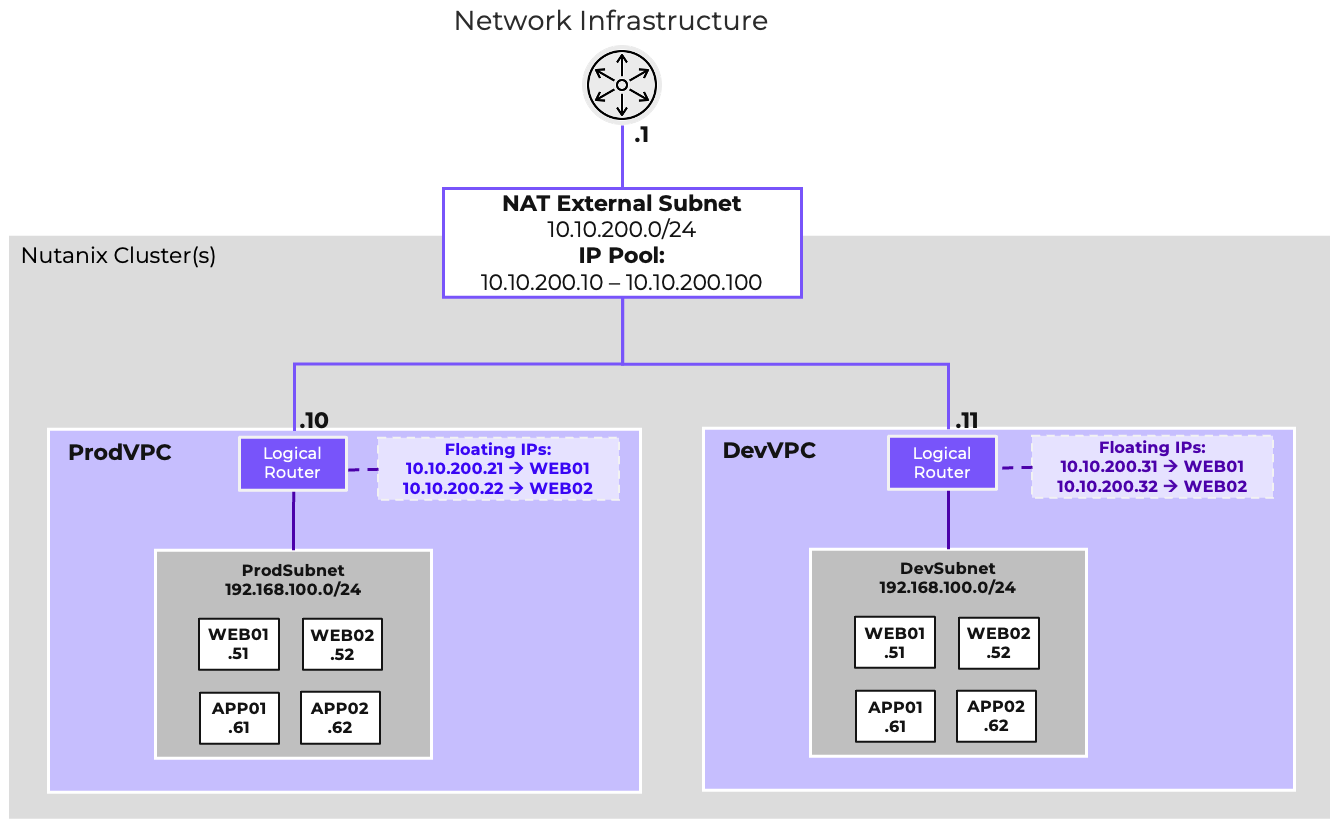
Routed (NoNAT) External Networks
Routed external networks allow the IP space of the VPC to be exposed to and shared through routing. Traffic egressing the VPC via a routed network will not be NATed. As such, the VPC’s address space is no longer isolated from the address space outside the VPC, and IP overlap must be avoided. A configurable list of Externally Routable IP Prefixes (also called ERPs) defines which prefixes within the VPC should be considered reachable via the NoNAT External Network. These prefixes can be dynamically advertised via BGP by deploying one or more Network Gateways. See the Dynamic Routing section for more details.
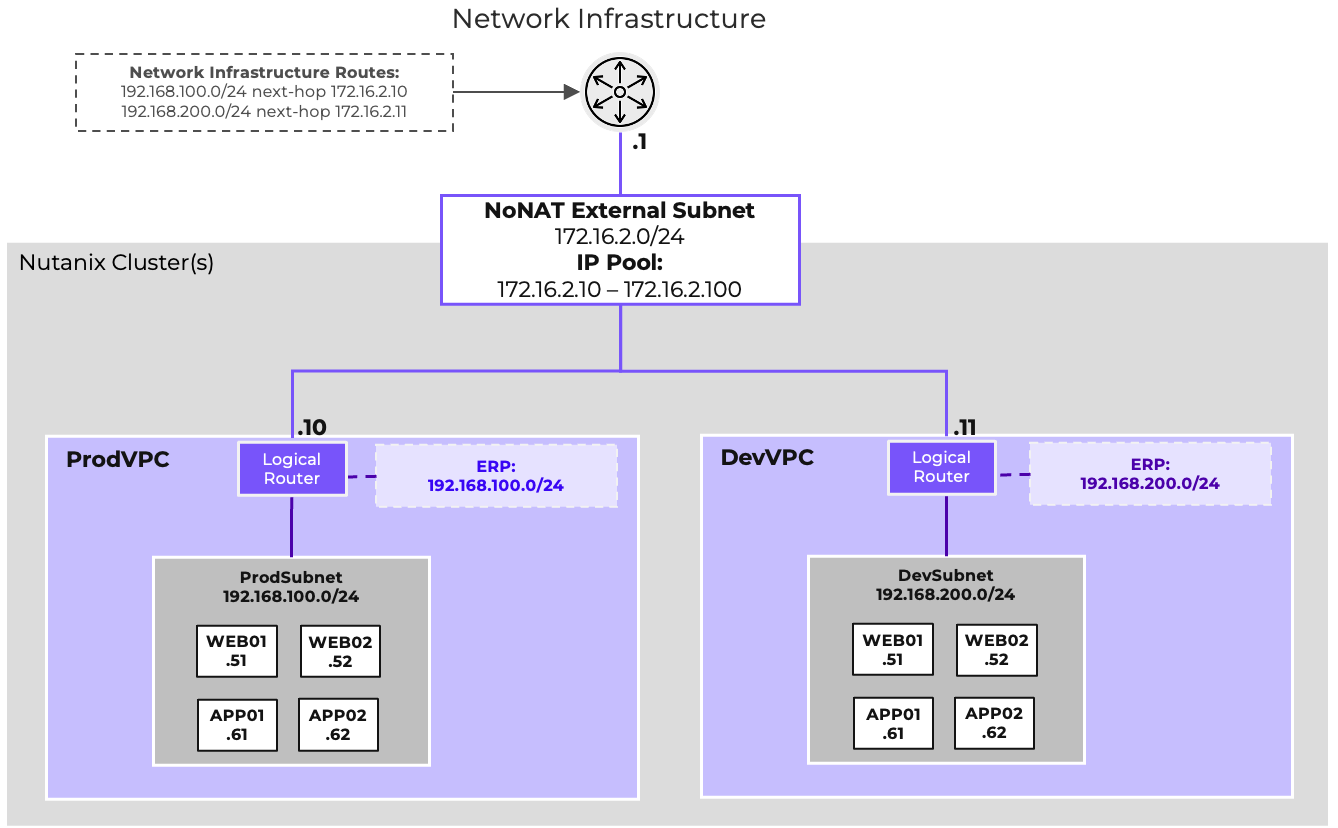
Multiple External Networks
A VPC can have both a NAT and NoNAT External Network. In these circumstances, usually one of the two networks should be chosen as the default route, with more specific routes defined for traffic taking the alternate path. If these choices are destination-based, the standard routing process is sufficient. If these choices are source based, Network Policies and policy-based routing can be used. See the Network Policies section for more detail.
Routable and Private Subnets
Flow supports both private subnets, which are isolated within a VPC, and public subnets, which provide connectivity to external networks.
-
Private subnets are used for workloads that do not need direct access from outside the VPC. They communicate with other subnets in the same VPC through the logical router and may reach external destinations via NAT gateways. Any VPC overlay subnet can be a private subnet, just leave it out of the ERP definition.
-
Routable subnets allow workloads to be reachable from outside the VPC, typically through floating IPs assigned at the gateway. These subnets are often used for frontend services or workloads that must be exposed to external users. Adding subnets to the ERP makes them routable.
Designing the right mix of public and private subnets is an important part of network security. It ensures that only the necessary workloads are exposed, while the rest remain protected inside the VPC.
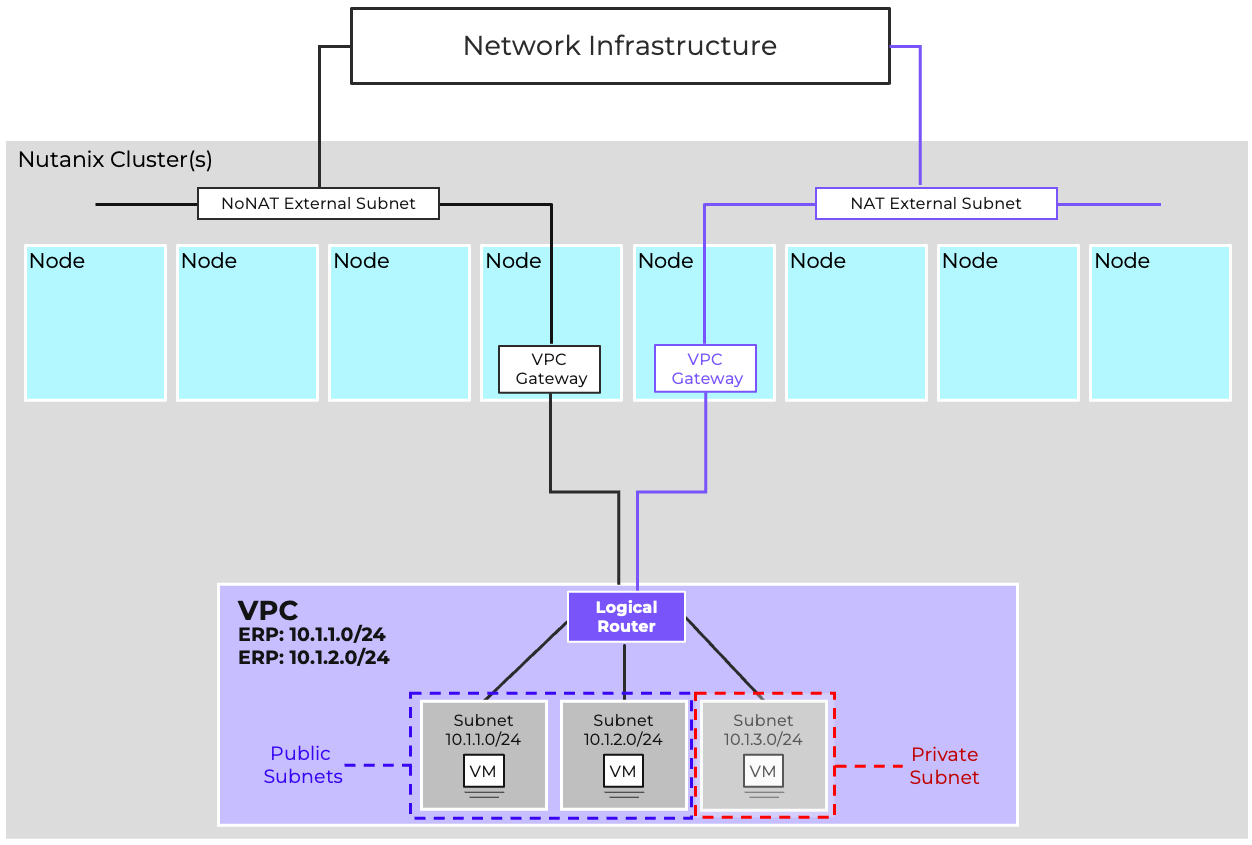 Example VPC with both private subnets for backend workloads and a public subnet for frontend services
Transit VPCs & Overlay External Networks
During creation, a VPC can be marked as a Transit VPC. Transit VPCs extend the functionality of standard VPCs by enabling the creation of Overlay External Subnets which can be used to provide external connectivity to other standard VPCs. Overlay External Subnets are configured the same as VLAN-backed external subnets and provide the same functionality, ingress and egress for a VPC.
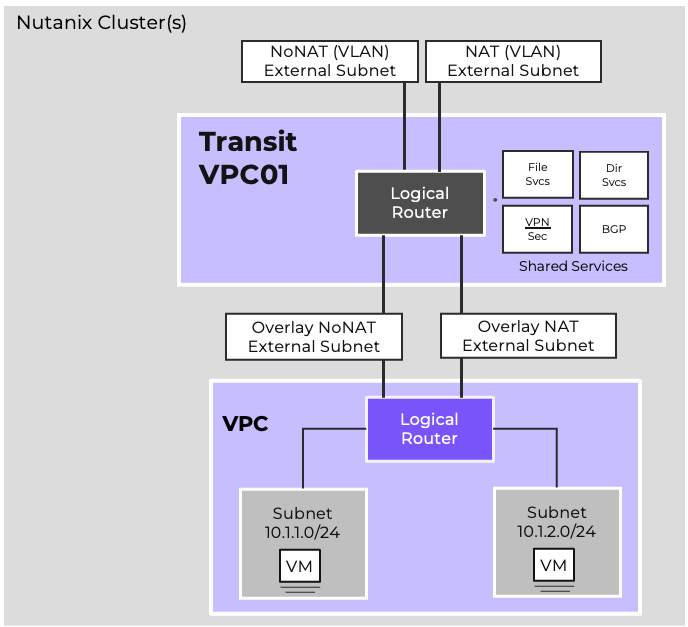
When configuring a NAT Overlay External Network, the NAT Network’s subnet should itself be considered a routable subnet by the Transit VPC, ensuring that external resources can reach the SNAT addresses or Floating IPs assigned out of the IP pool.
Routed Overlay External Networks operate as routing transit networks. These networks do not need to be externally reachable themselves, but merely act as a routed link between the Transit VPC and any connected VPCs. IP ranges such as the 100.64.0.0/10 Shared Address Space are suitable candidates for use with these networks.
VPC Gateway Scale-Out
Flow Virtual Networking provides increased north/south bandwidth and improved fault tolerance via Gateway Scale-Out. With Gateway Scale-Out, up to four hosts can act as active gateways per VPC per external network; the default is two active gateway nodes per external network. If a VPC is connected to both a NAT and Routed external network, it can have multiple active gateways for each external network type, with different hosts selected for each external network.
Each gateway scaleout node is configured as an OVN redirect chassis, with outbound traffic being distributed amongst the gateways via ECMP. An internal gateway logical subnet in the 169.254.0.0/16 address space is created automatically to facilitate this. Overlay networks do not support Gateway Scale-out.
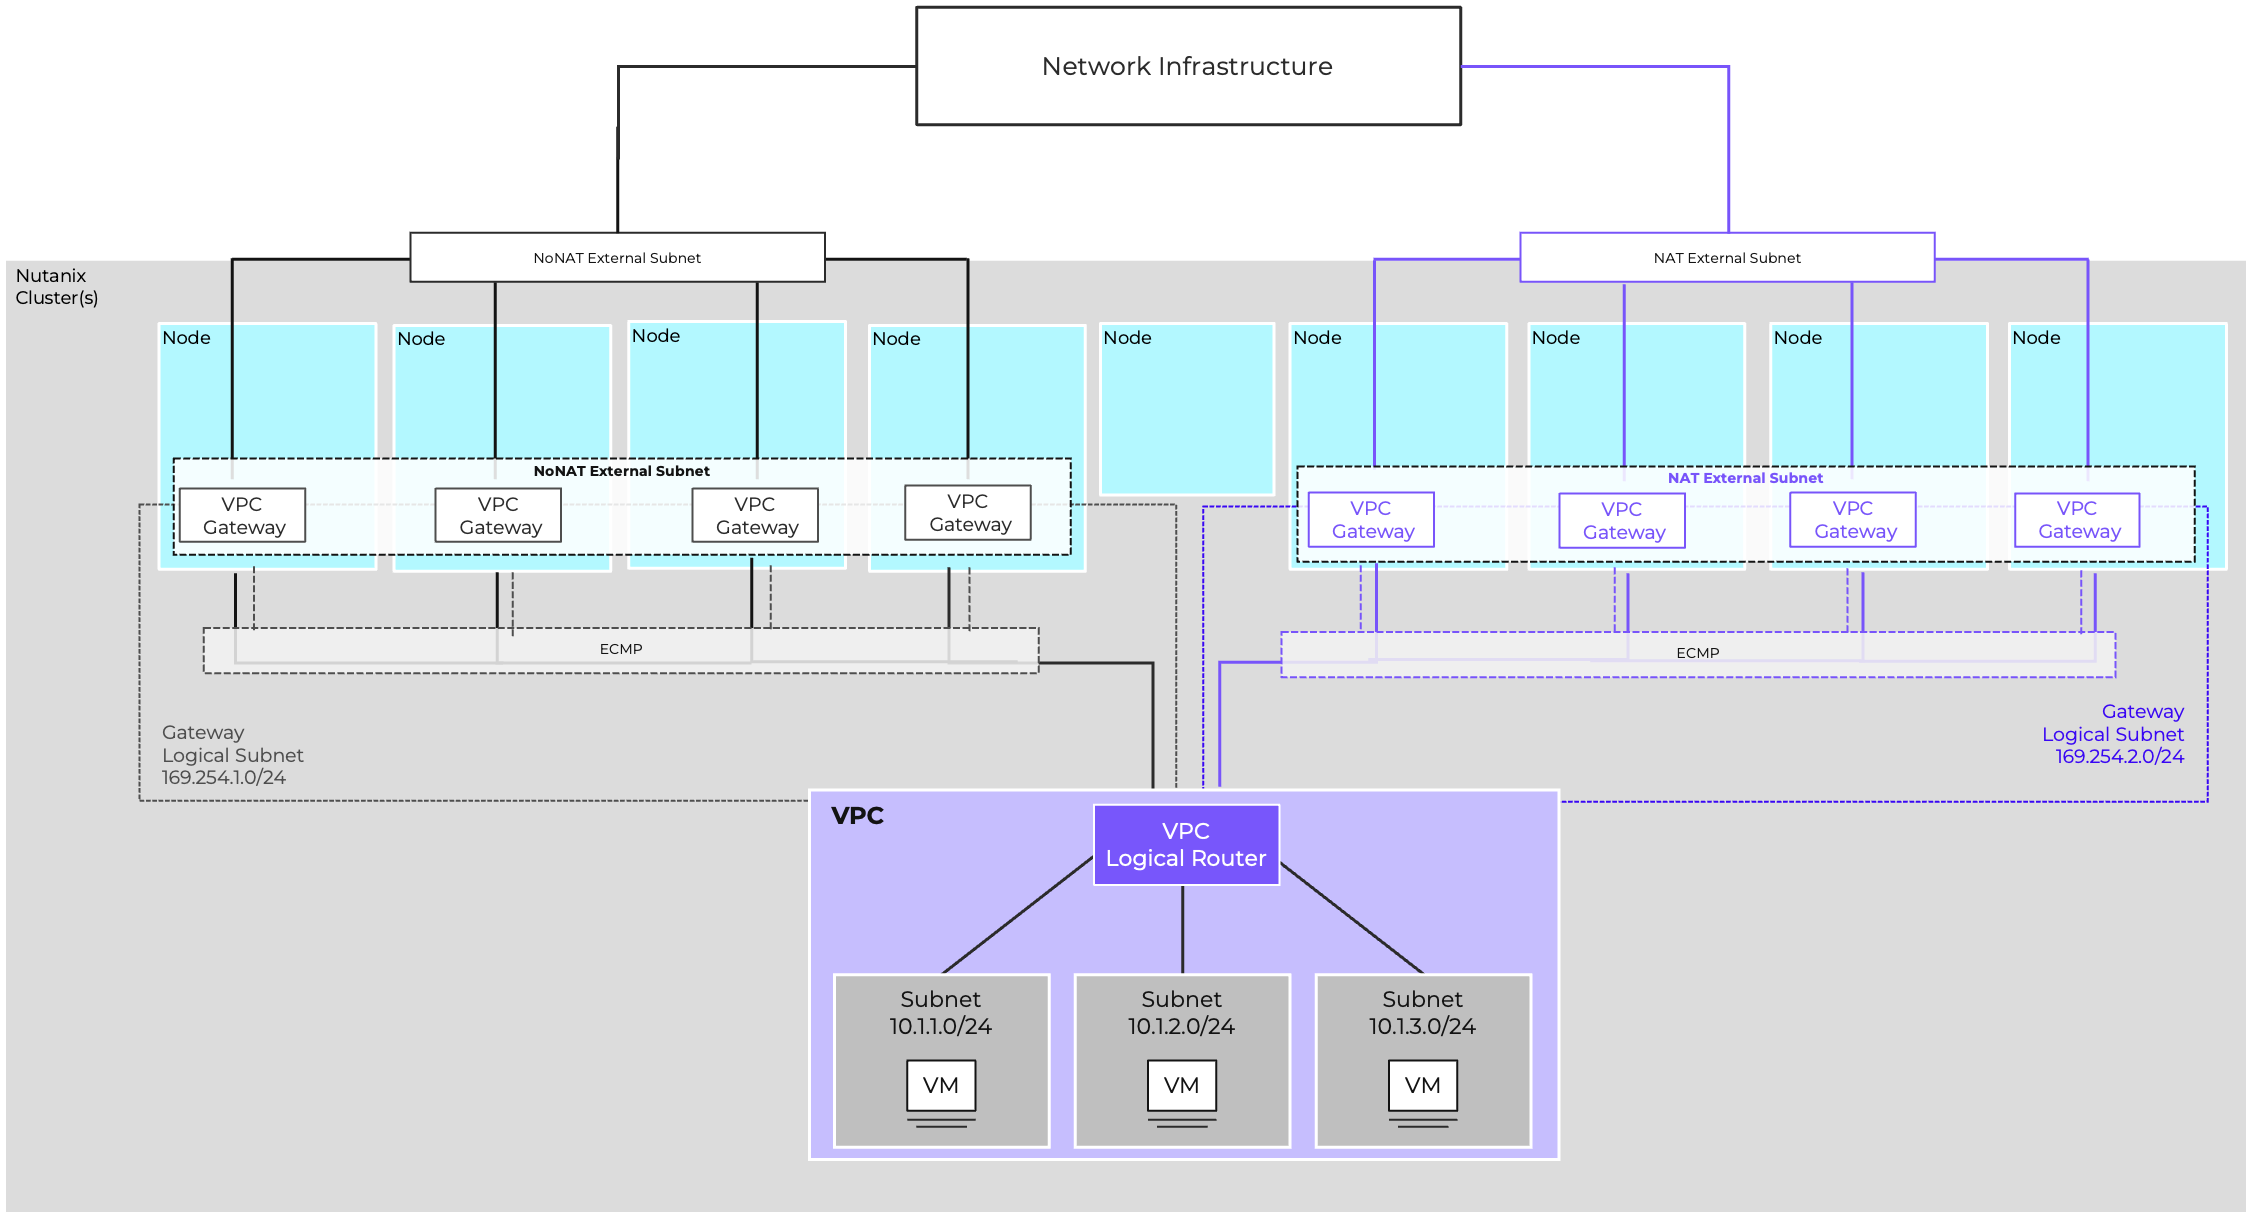
When utilizing a NoNat (Routed) External Network, the system allocates a Router IP from the external network’s IP Pool to each gateway node. Consequently, inbound traffic destined for any routable networks must be ECMP routed across all assigned router IPs.
For a NAT External Network, each gateway node receives a SNAT IP from the external network’s available IP pool. When outbound traffic leaves through a specific node, its outbound IP is translated to that gateway host’s SNAT IP. This ensures that the corresponding return traffic is correctly routed back to the same originating gateway host. This model increases throughput and reduces failure domain size.
Gateway Fault Tolerance
Resiliency is achieved by distributing forwarding across hosts and designing gateways with redundancy. Administrators should consider failure domains such as rack-level outages and design gateway placement accordingly.
With the exception of single-node clusters, the Acropolis Leader will never host a gateway. If a node hosting a gateway fails, the Virtual Private Cloud (VPC) immediately stops using that failed gateway.
-
Traffic is maintained by the remaining active gateways.
-
The failed gateway is moved to an active, non-failed node.
-
If all active nodes are already hosting a gateway, one node will temporarily host two gateways, and traffic will be balanced equally between them.
Optimal Gateway Node Count
The maximum number of active gateway nodes is n-1 of the total cluster size because of the Acropolis Leader, with a maximum of 4 per VPC. For example:
- A 3-node cluster will not benefit from more than 2 active gateway nodes.
- A 4-node cluster will not benefit from more than 3 active gateway nodes.
- Any 5+ node clusters will benefit from a full 4 active gateway scale-out.
Throughput Planning and Bottleneck Awareness
Even though FVN distributes forwarding tasks across several hosts, a gateway’s throughput capacity is limited by the capacity of the physical host. Therefore, proper planning is essential. This involves sizing the gateway host for the expected bandwidth needs, closely monitoring usage, and scaling out the gateway infrastructure as capacity thresholds are approached.
NAT Pinning
Connections are round-robin assigned to gateways based on the NATed IP address. This assignment persists until the gateway becomes unavailable. SNAT and Floating IP connections are pinned in this fashion.
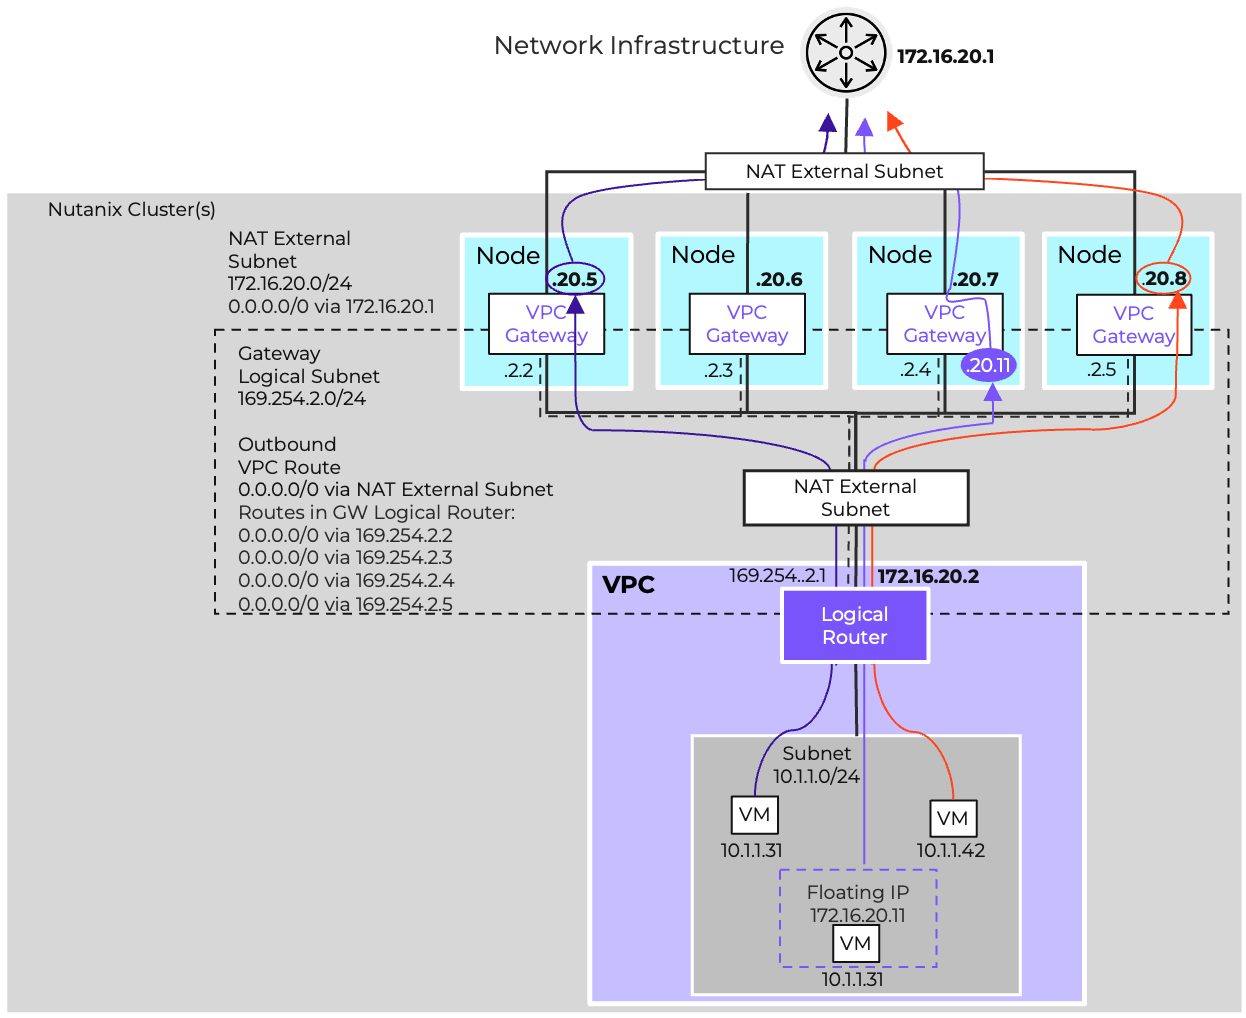
Route Advertisement Options and Routing Boundaries
Flow supports multiple approaches to route advertisement:
- Static routes configured at gateways.
- Dynamic advertisement using the BGP Gateway for scalable control-plane integration.
- Scoped advertisement that ensures routes are shared only where needed, preserving tenant isolation.
Routing boundaries define how far connectivity extends. For example, private subnets may only route within a VPC, while public or NoNAT subnets extend into external networks.
Gateways and Interconnects
VPN Gateway for Site-to-Site
The VPN Gateway enables secure IPsec tunnels between Nutanix clusters or between a cluster and external sites. It provides encrypted connectivity for hybrid cloud designs and supports both policy-based and route-based configurations.
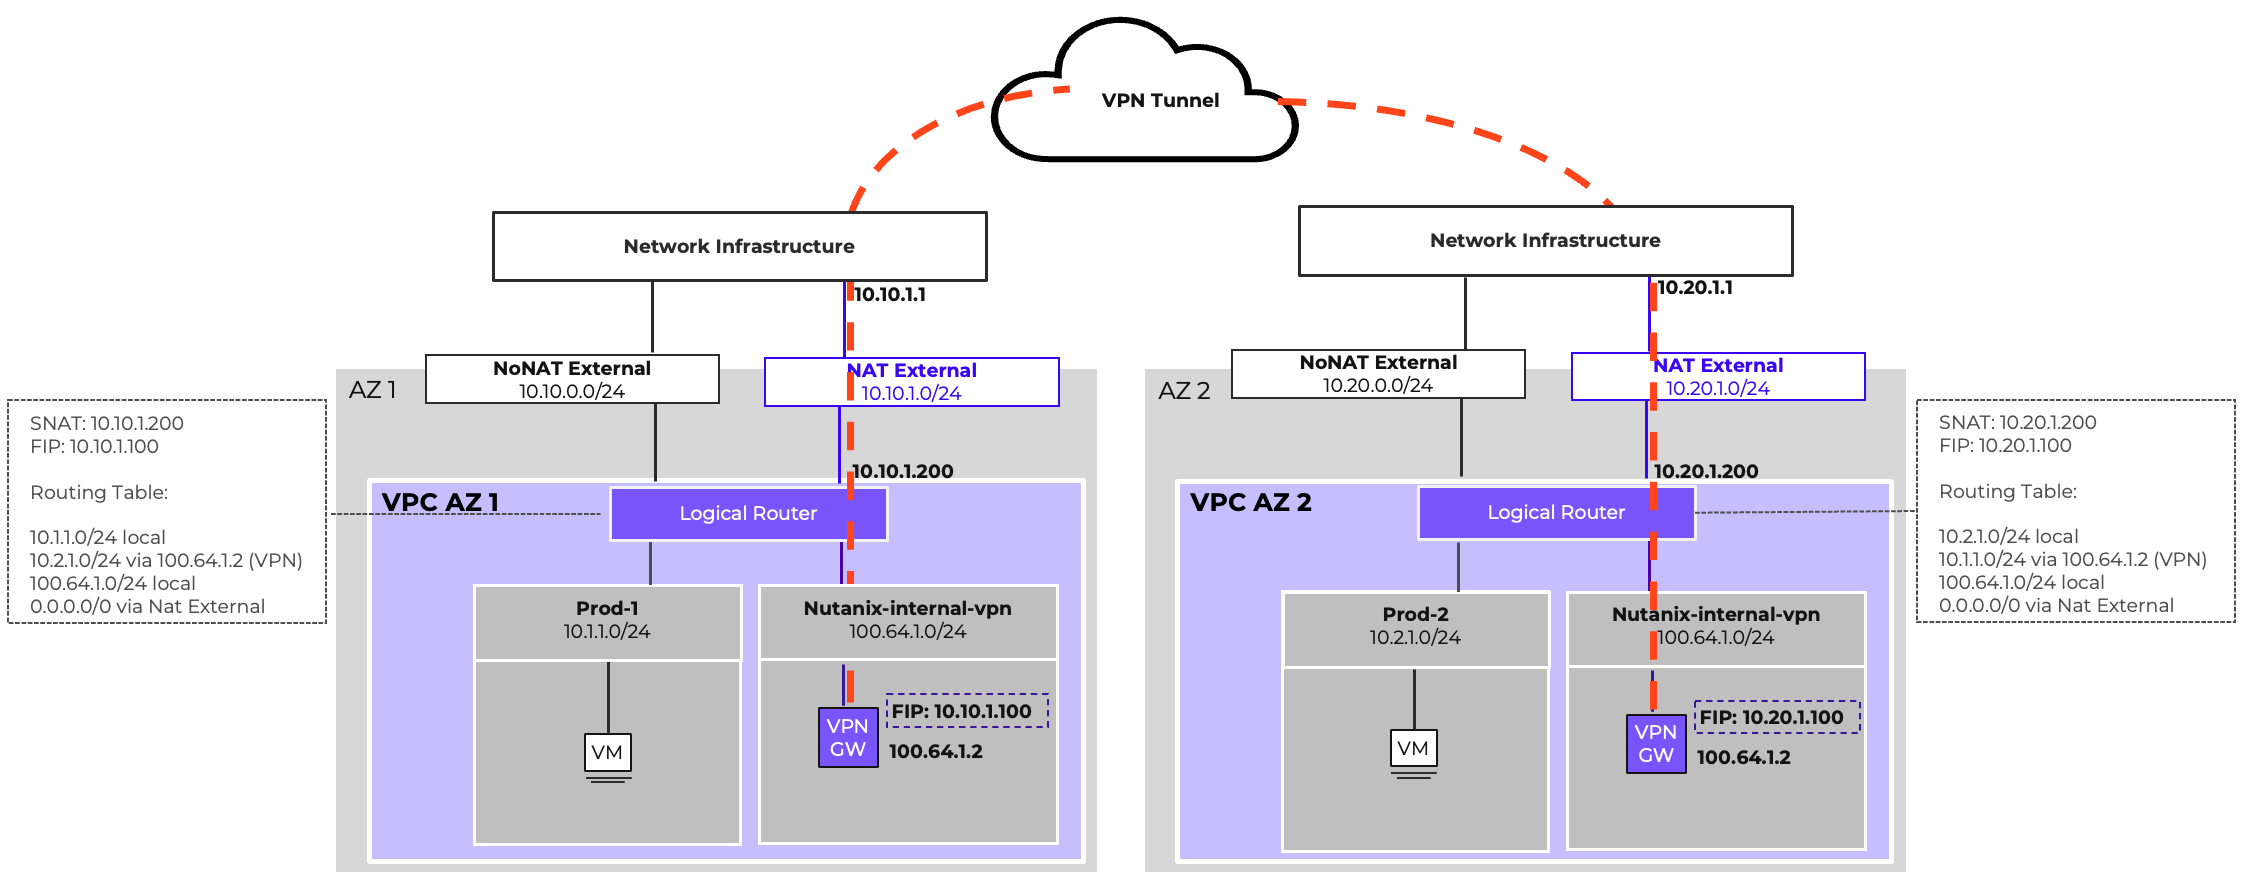
VTEP Gateway for Subnet Extension
The VTEP Gateway allows Layer 2 extension of overlay subnets into external environments. This is useful when workloads must retain their IP addresses during migration or when applications rely on L2 adjacency.
While powerful, subnet extension should be used selectively, as it increases operational complexity and can create spanning domains.
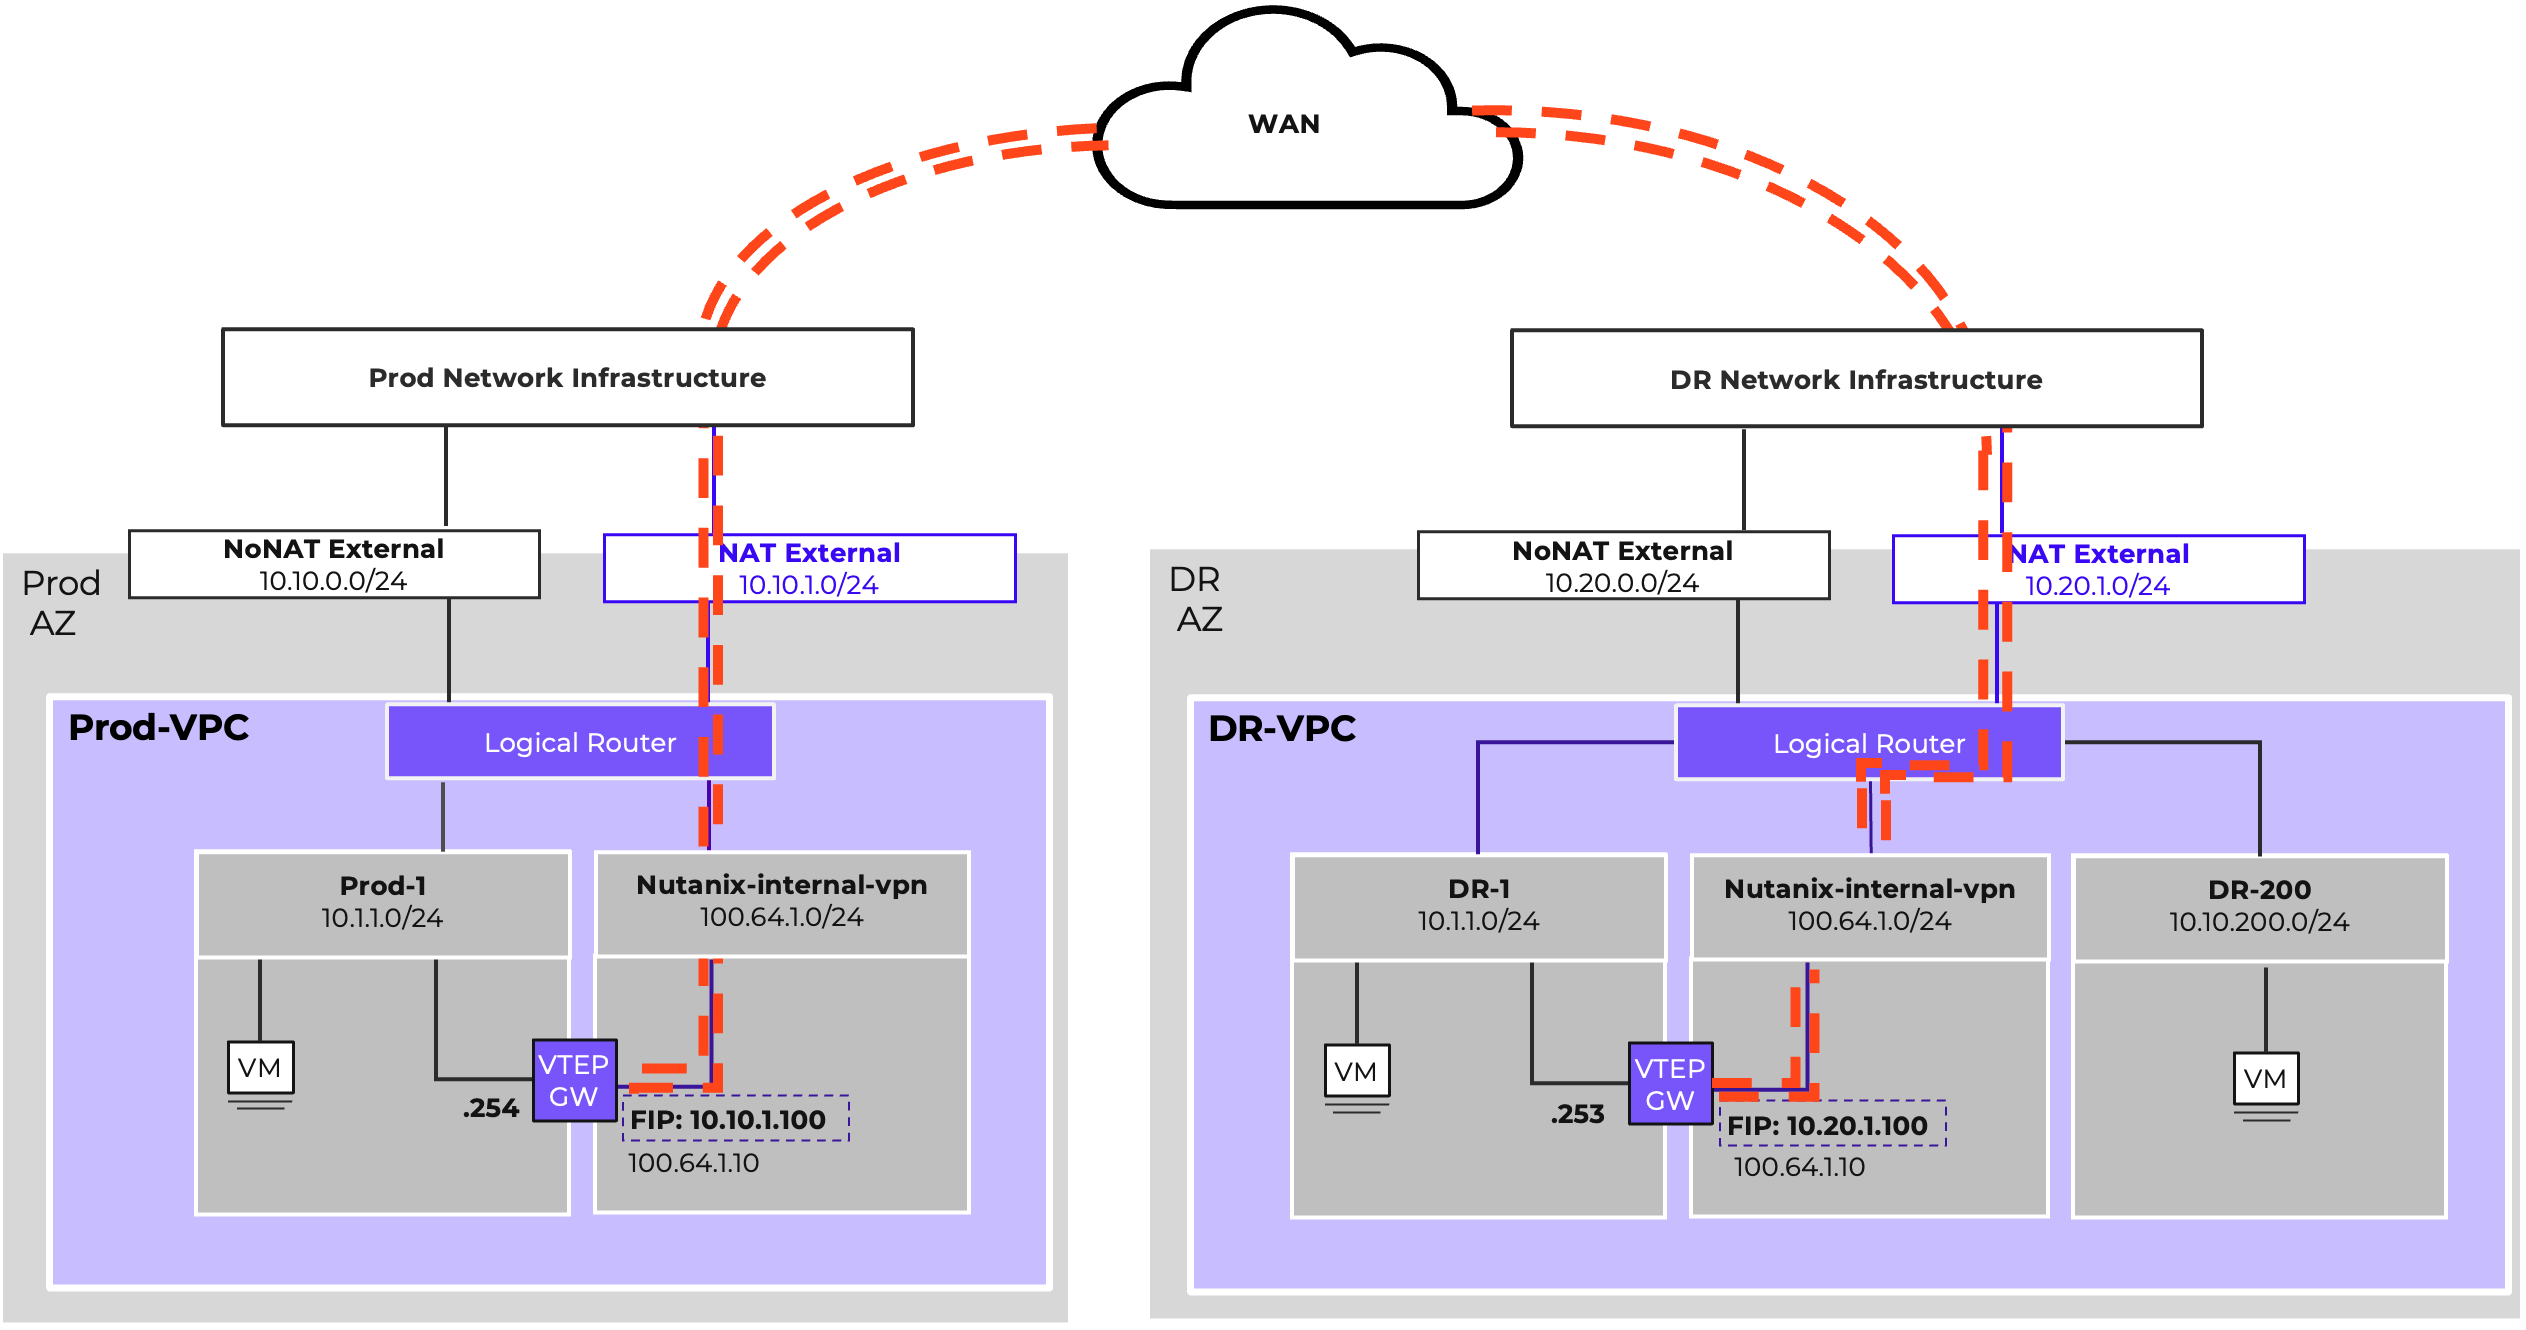
BGP Gateway for Dynamic Route Advertisement
The BGP Gateway is essential when workloads need direct IP reachability without translation. It supports integration with existing enterprise routing domains, hybrid cloud connections, and scalable inter-VPC routing.
The BGP Gateway operates as a control-plane participant, advertising overlay prefixes and receiving external routes. The BGP Gateway dynamically advertises routes to overlay networks, known as an Externally Routable Prefix (ERP), to network infrastructure routers. The gateway also learns external routes from the infrastructure to distribute them into VPCs. This enables scalable, automated connectivity without relying on static routes.
While the BGP Gateway operates as a control-plane to the assigned VPC, the actual forwarding is still performed by the AHV hosts, ensuring distributed performance. The BGP gateway’s function is similar to that of a route server; the gateway is not in the data path.
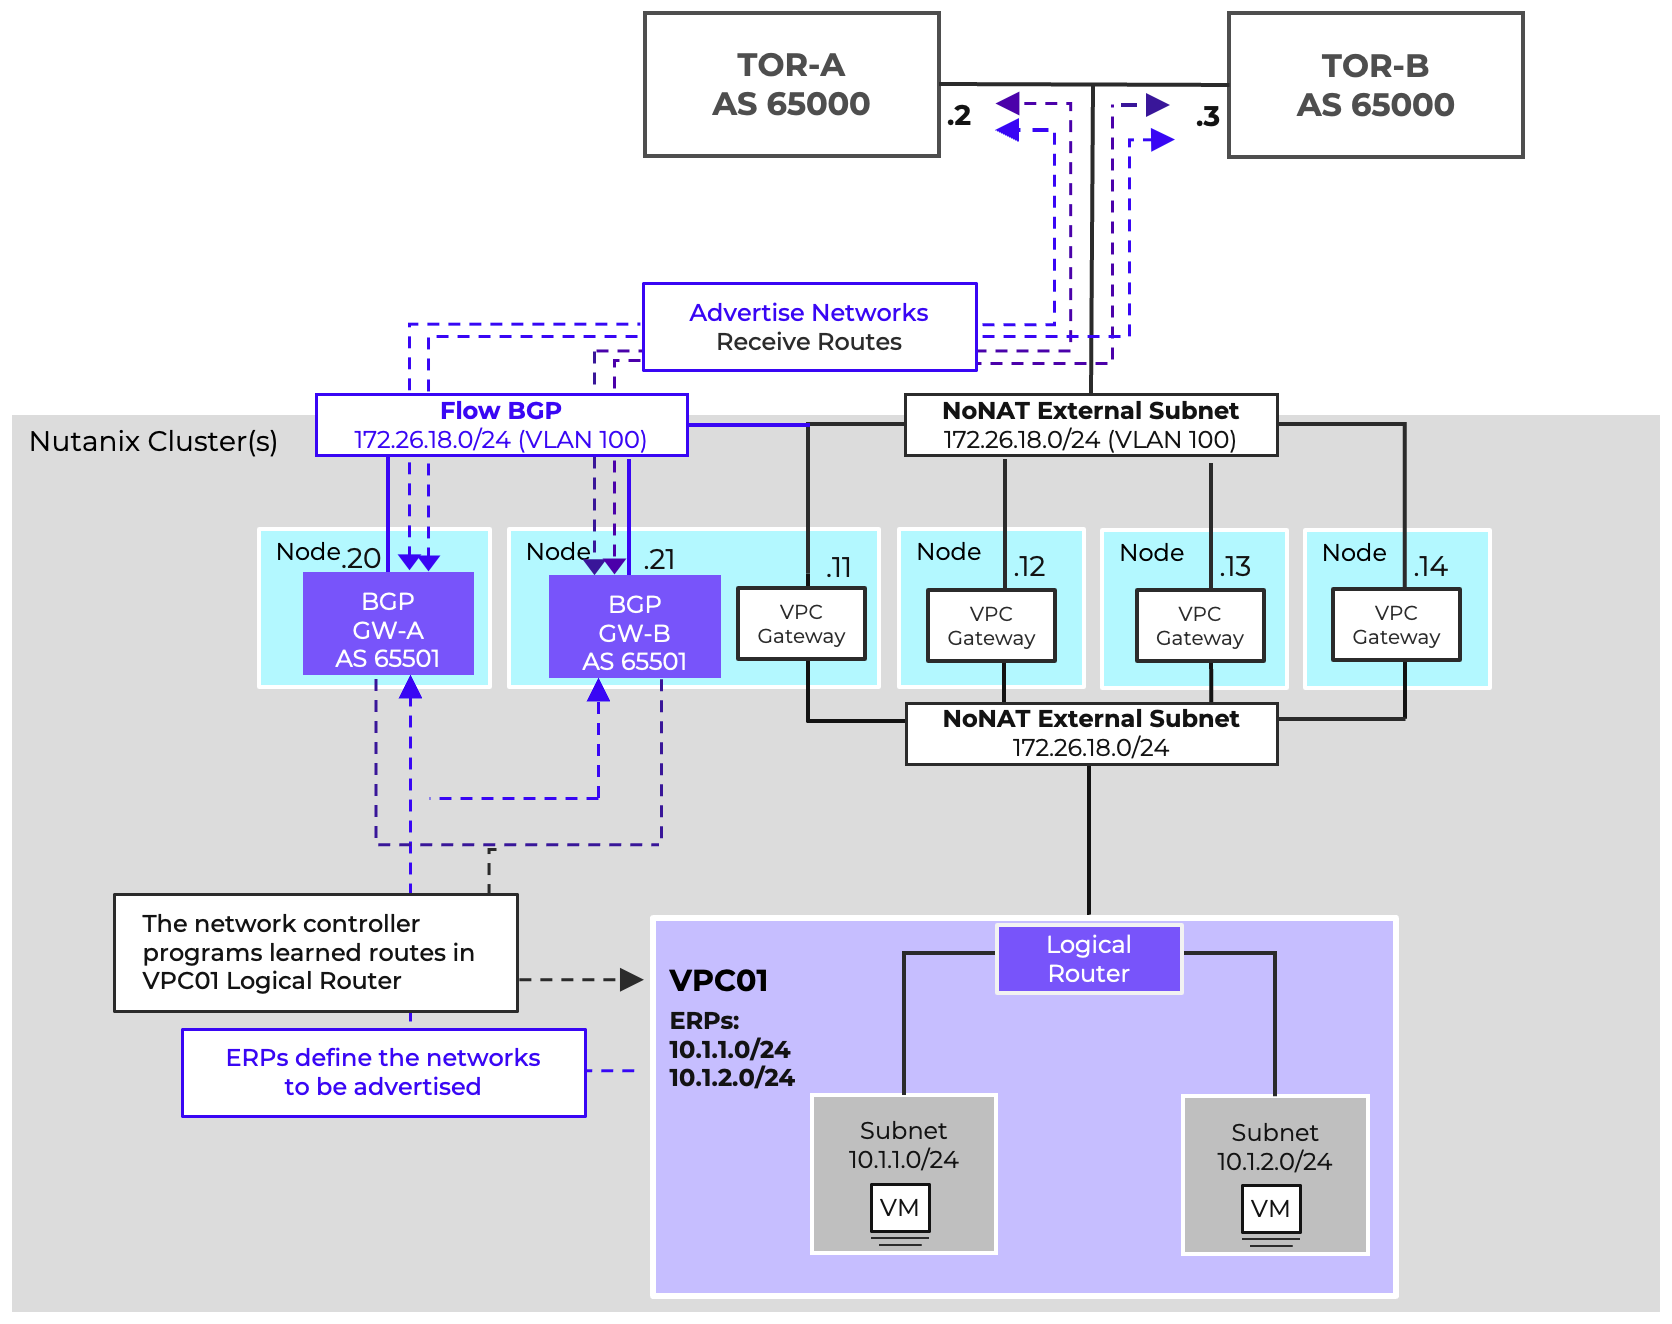
BGP Gateway Placement on VLAN or Overlay
BGP peers can be placed on VLAN-backed subnets for integration with physical routers, or on overlay subnets for virtual-only designs. This flexibility allows enterprises to choose the model that best fits their topology.
Floating IPs with BGP Gateways
Floating IPs can be used at the gateway level to provide external reachability and redundancy. Design considerations include ensuring unique IP pools, aligning with underlay addressing, and planning for failover scenarios. Deploying a BGP gateway on a VPC overlay network requires the use of floating IPs. This deployment method does not support the use of MD5 authentication for BGP relationships, therefore it is not the preferred type of deployment.
Preferred BGP Gateway Placement
For optimal BGP gateway deployment, it is a best practice to utilize a VLAN-backed network. This setup eliminates the need for Network Address Translation (NAT) and Floating IPs while simultaneously enabling MD5 authentication. To ensure high availability and redundancy for this essential routing component, deploy two BGP gateways per Virtual Private Cloud (VPC).
One BGP service IP per VPC Router (scaled-out gateway) IP is allocated on the NoNAT External Network. Each service IP advertises the VPC’s ERPs with a virtual gateway router IP as next hop. Up to 250 routes can be learned per session. Remote gateways must advertise their next-hop on the NoNAT External Subnet.
Note
Pro tip
When deploying multiple BGP Gateways to service a VPC, anti-affinity between gateways should be set to avoid both gateways from residing on the same AHV host.
Dynamic Routing using BGP
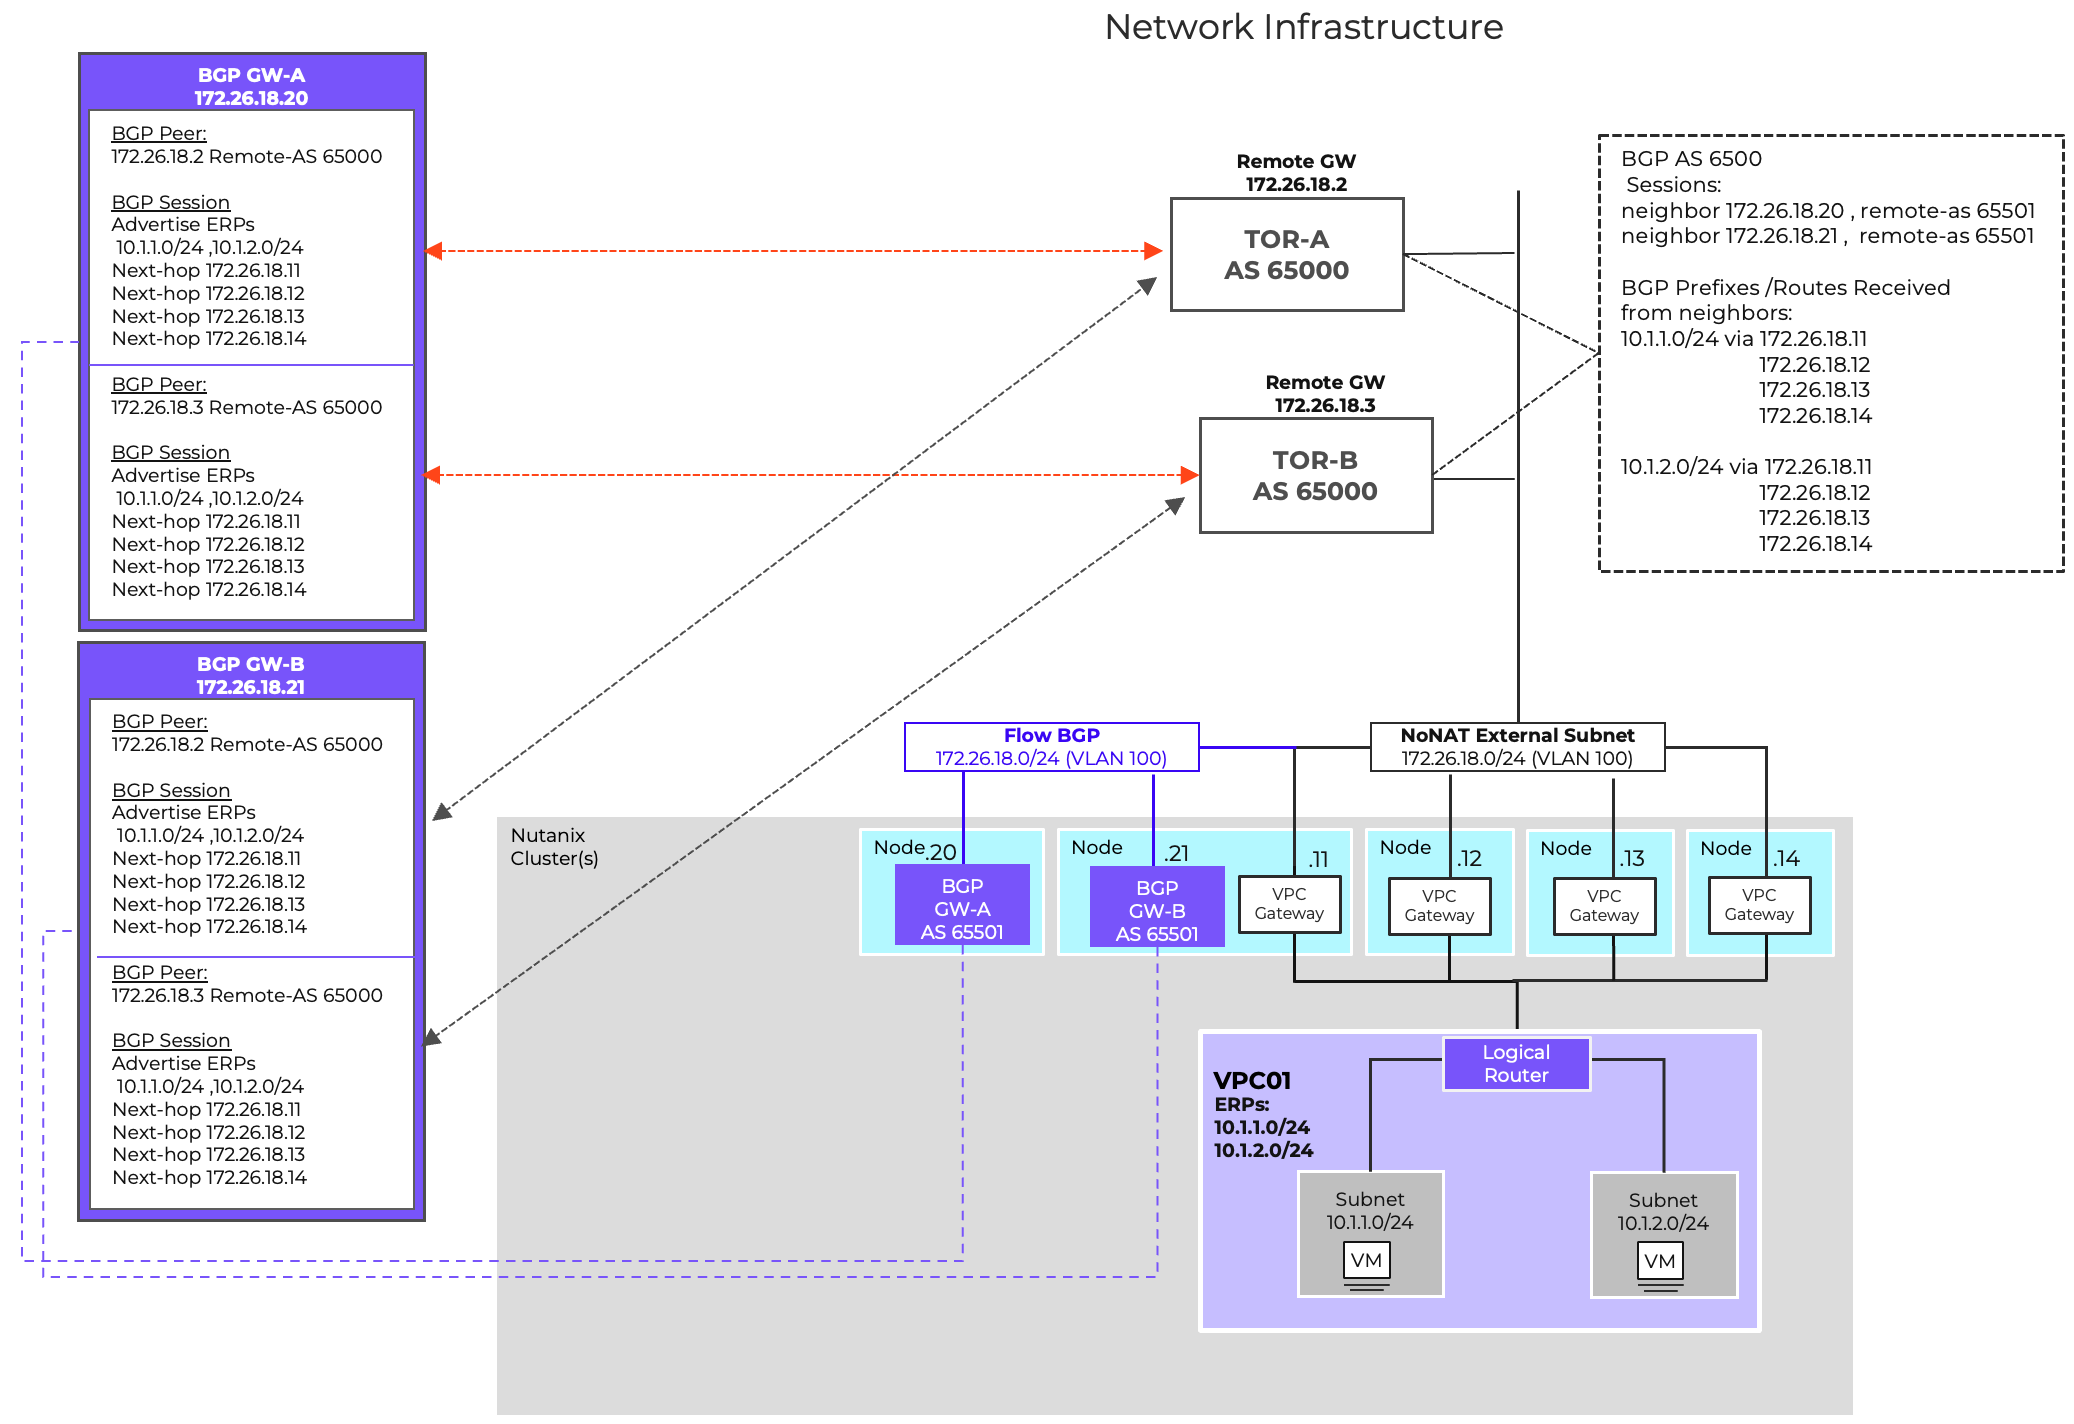
BGP Advertisement Capabilities
Advertised Prefix Length
The BGP Gateway offers flexible network advertisement, supporting prefix lengths from /1 to /32. This support enables precise configurations that align with your existing network topology and policy requirements.
This capability is useful for scenarios like advertising a specific application or function within a VPC to the wider infrastructure, while simultaneously ensuring that other applications or VMs in the same VPC remain isolated and inaccessible.
Additionally, this granularity isn’t limited to BGP. You can leverage this feature to control which specific addresses or subsets of IPs are known and accessible via a Transit VPC.
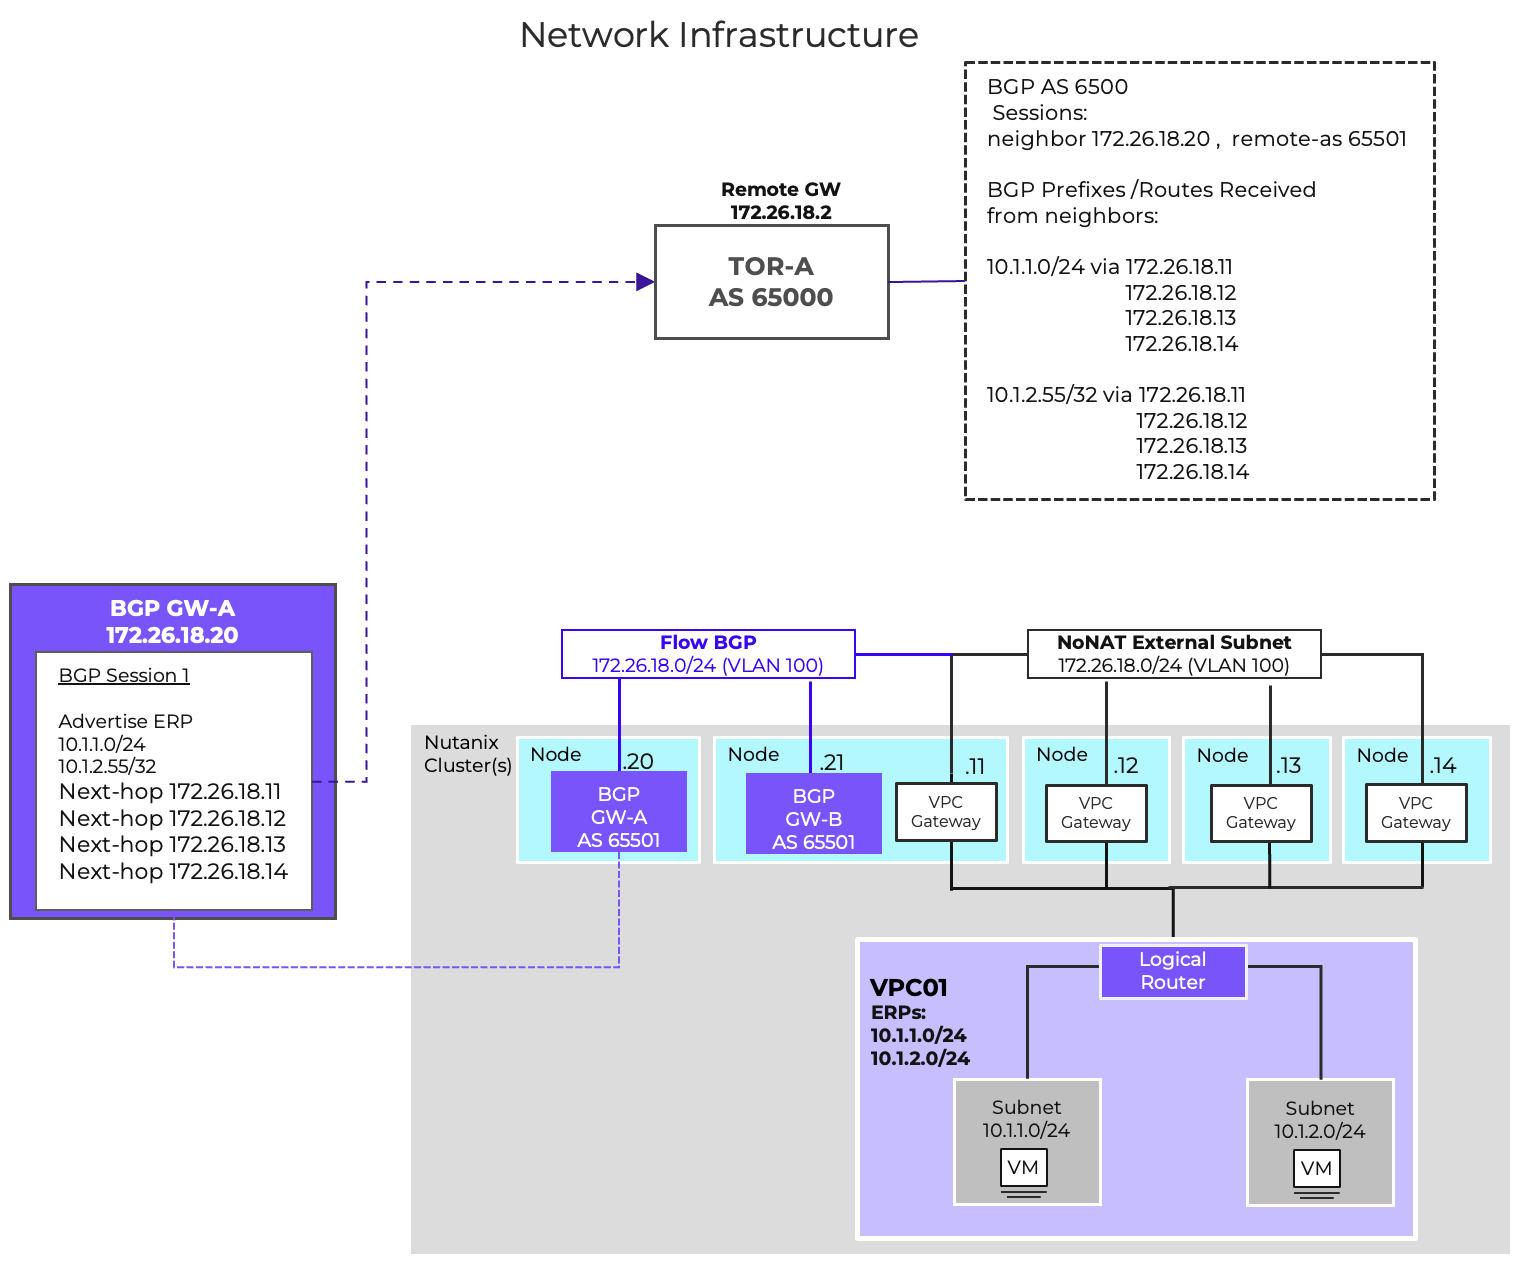
BGP AS-Path Prepending
Within the BGP protocol, AS Path length is part of BGP Path selection criteria. The path with the shortest AS Path length is often the best path and is installed in the routing table.
With AS-Path Prepending we can influence routing by artificially increasing the length of a path. This is done by adding your Autonomous System Number (ASN) multiple times to the beginning of the AS path attribute.
Because this increases the AS Path Length, this route would be less preferred.
This can be used to help steer inbound traffic to a VPC-based externally routable prefix through specific networks, routers or ports.
AS-Path Prepending is also very useful for Active/Backup deployments across availability zones. The VPCs in the primary AZ can advertise their networks without AS Path prepending, making them the preferred path to the ERPs.
The DR AZ would also advertise these ERPs to the infrastructure, but will use AS PATH prepending for these network advertisements, making the paths from the DR AZ less preferred. If there was a failure of primary AZ causing the preferred path to be removed from the routing table, the secondary path via AZ2 would become the preferred path. This would allow traffic to continue to flow into the environment without any routing intervention or changes.
AS Path Prepend is configurable per BGP session.
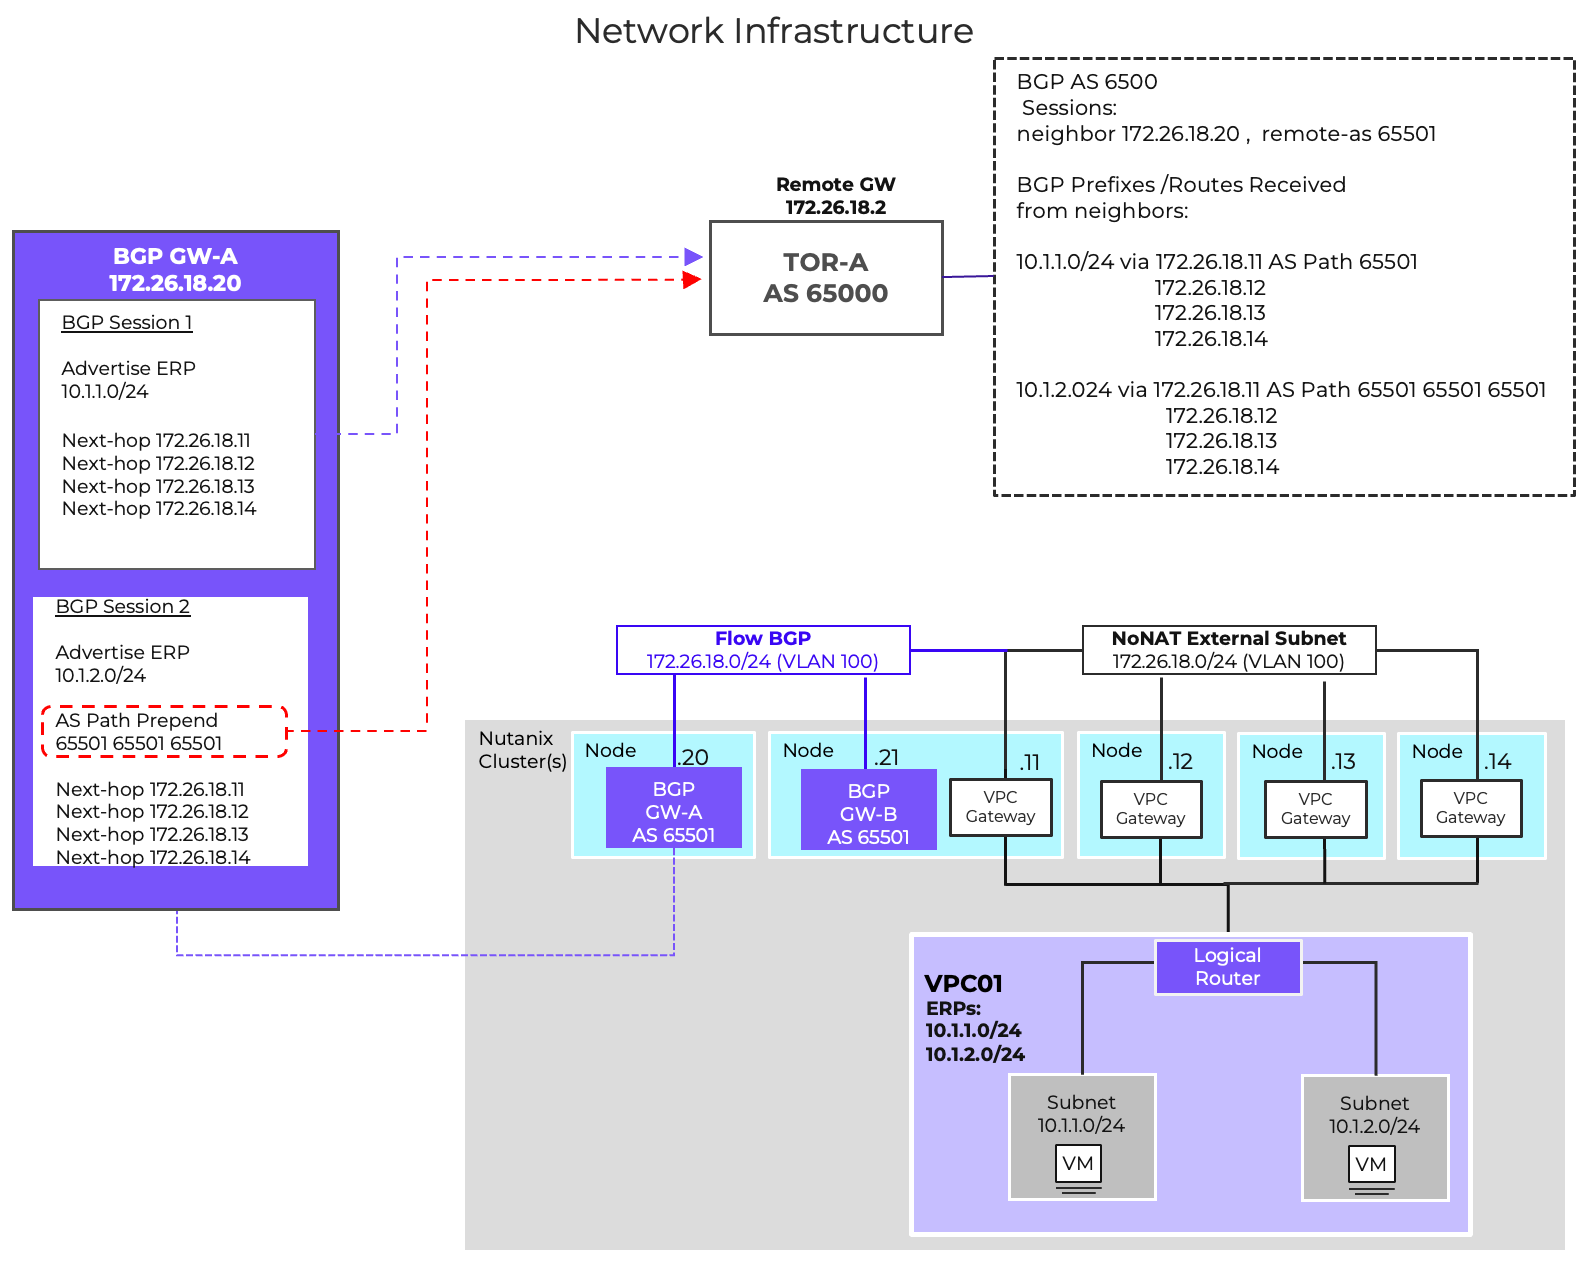
BGP Communities
BGP Communities are tags that get attached to advertised routes, allowing the receiving peer to apply routing policies based on the value of the tags. These policies could be used for a lot of different scenarios like directing traffic to a specific VRF, or influencing how routes are redistributed across the network . BGP Communities can also be used as a method to identify routes coming from specific environments.
In Flow Virtual Networking, BGP Communities are only for outbound route advertisements. The FVN BGP gateway ignores any community tag received. The gateway does not take any action on received BGP communities. BGP Communities are configurable per BGP session.
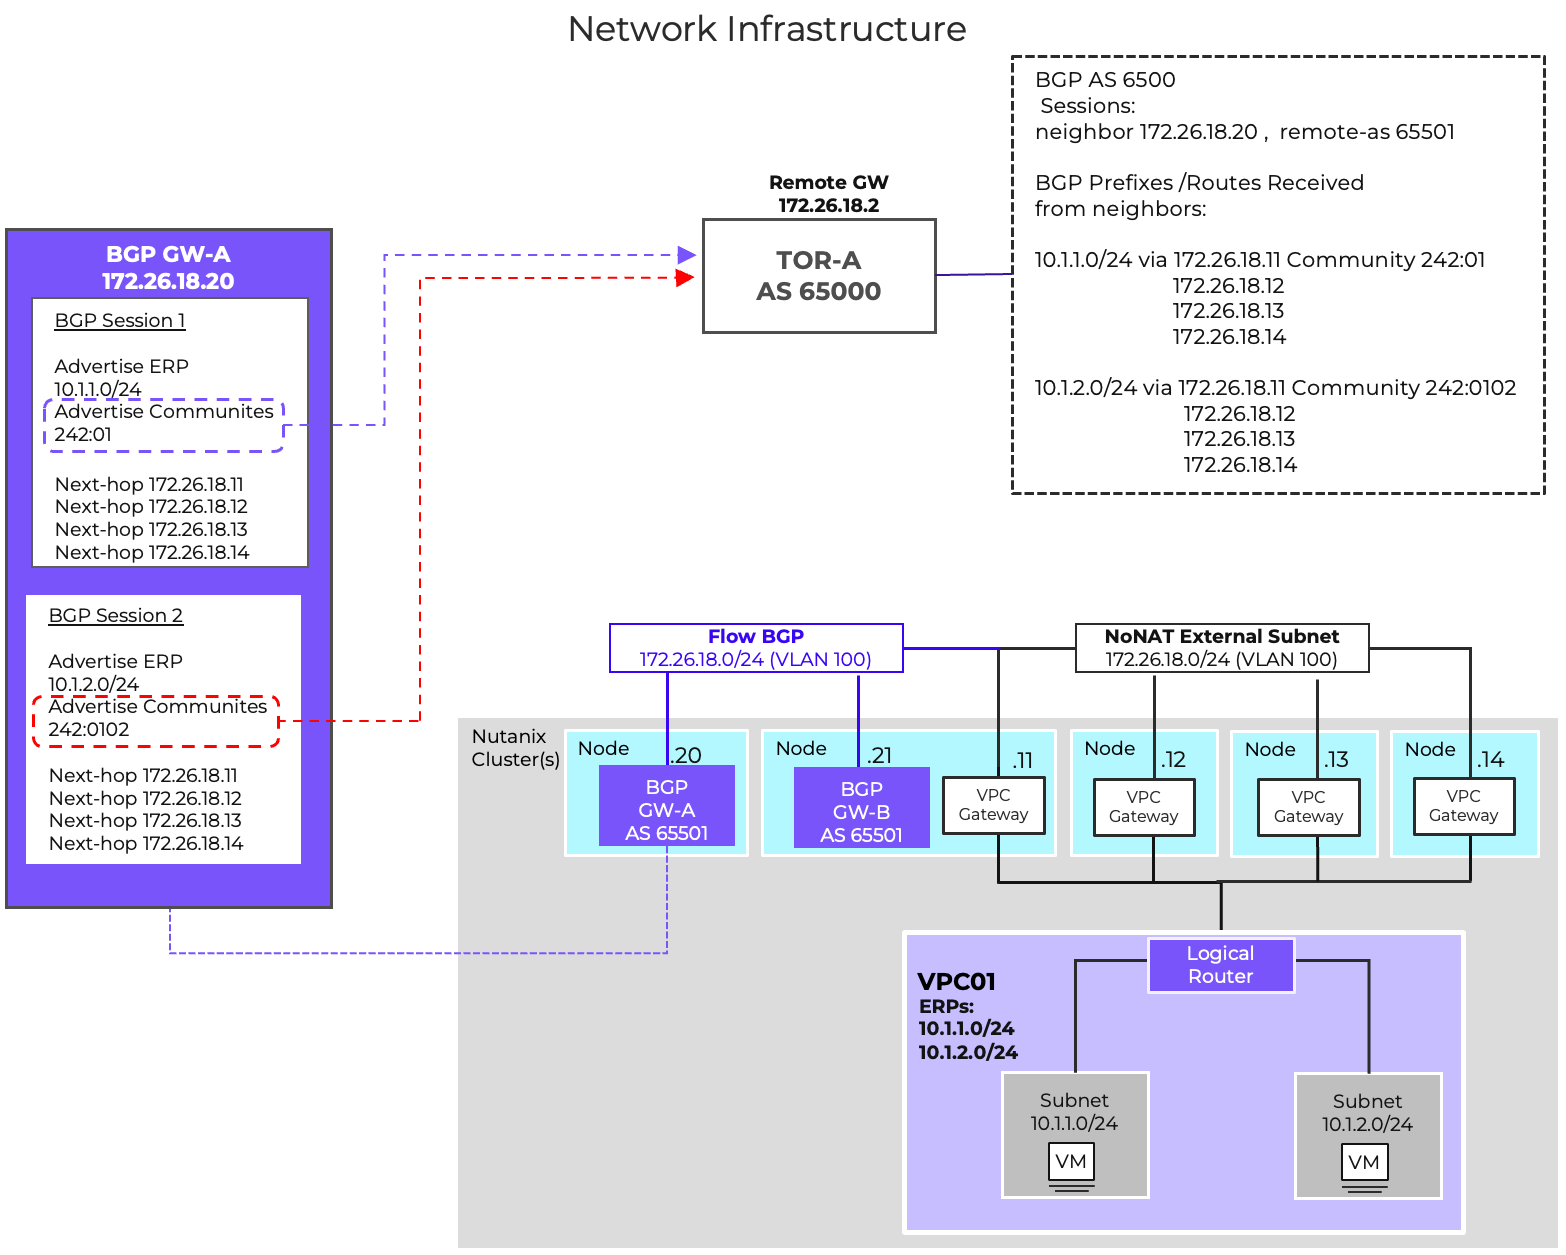
Right-size advertisements: BGP Addtional Paths (Add-Path)
BGP Additional Paths (Add-Path), standardized in 2016 via RFC 7911, is a BGP capability that addresses the default limitation of advertising only the single best path for a prefix. This enhancement allows a router to advertise multiple paths for the same prefix, significantly improving path diversity, reducing network convergence time, and streamlining configuration.
With Add-Path, multiple paths can be advertised through a single BGP peering session. This feature removes the necessity of creating separate BGP sessions for each VPC external network gateway, thereby reducing the total number of BGP sessions required per VPC. This protocol enhancement provides better scalability and operational simplicity.
To utilize this feature, the capability must be supported and enabled on both the VPC BGP Gateways and the receiving neighbors (network infrastructure).
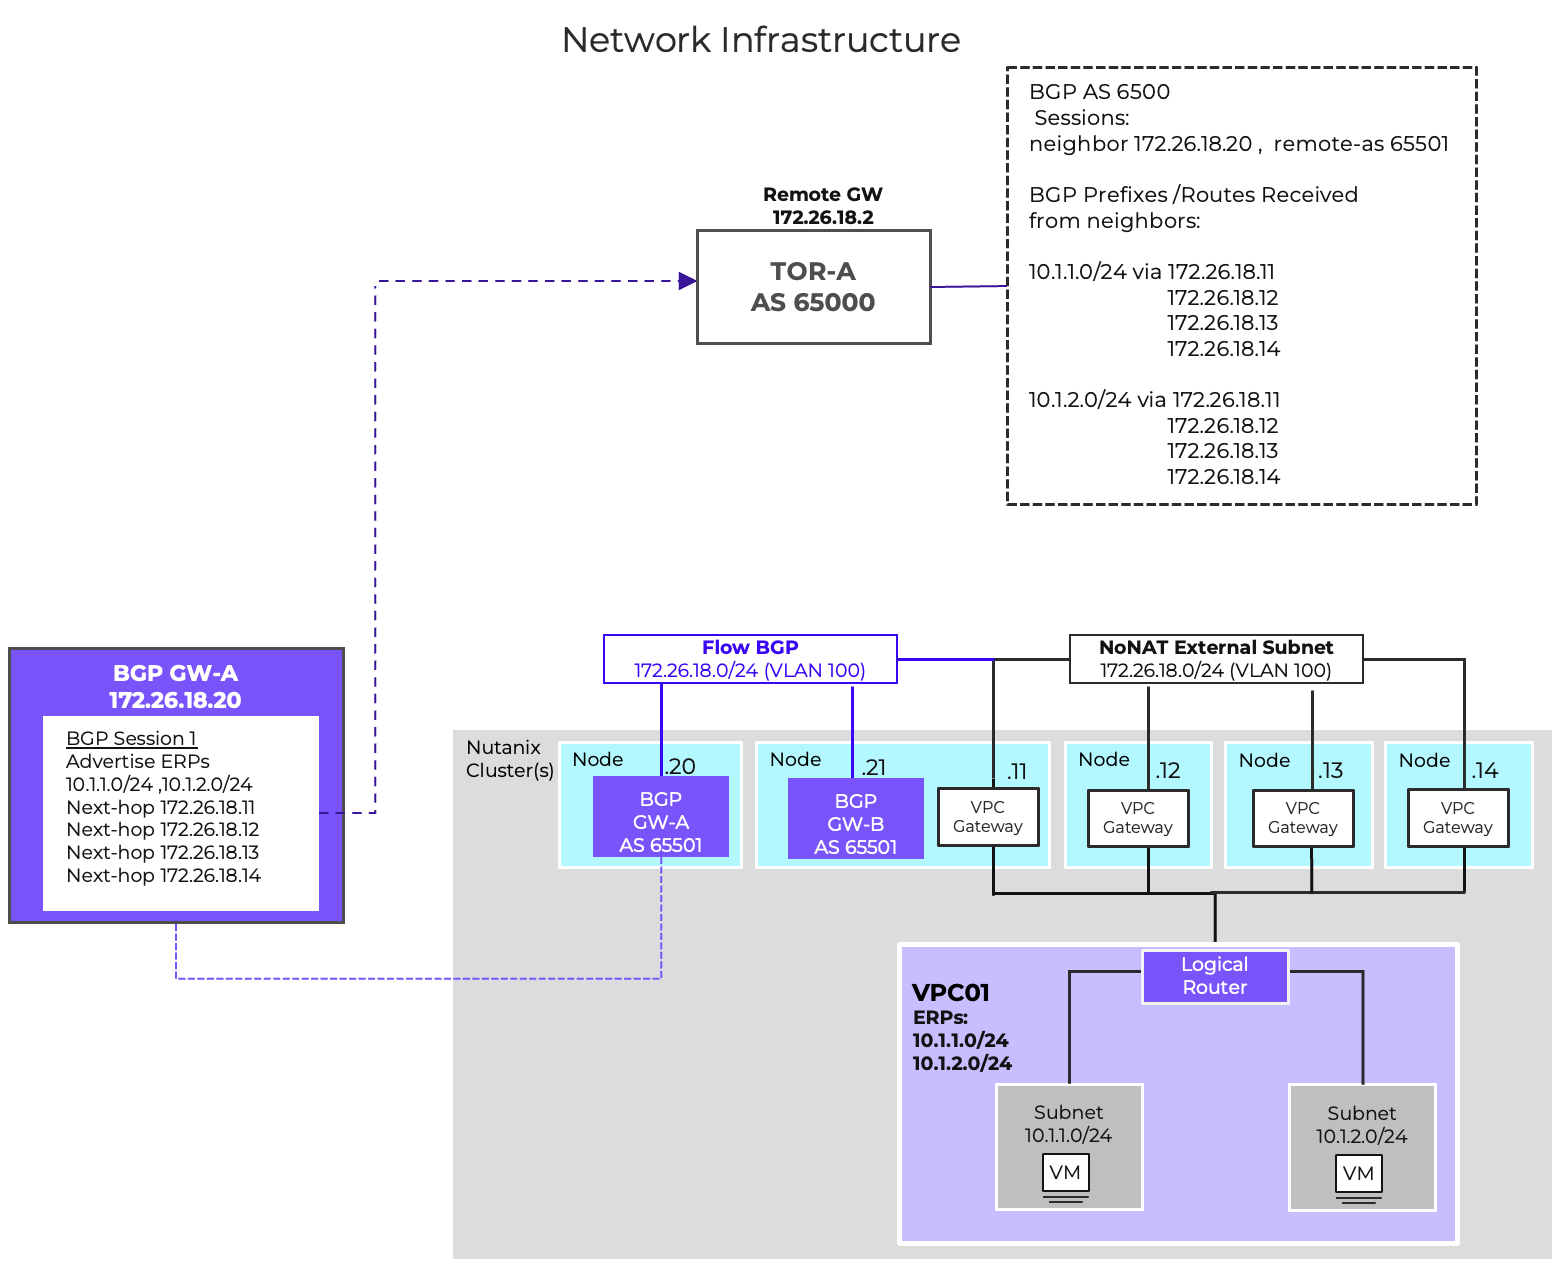
It is possible to deploy BGP gateways without Additional Paths support. This can be the case if the network infrastructure does not support the Add-Paths capability. In that design, a dedicated BGP sessions for every VPC external network gateway is required. With external gateway scale out, that could be up to 4 sessions per ERP per gateway.
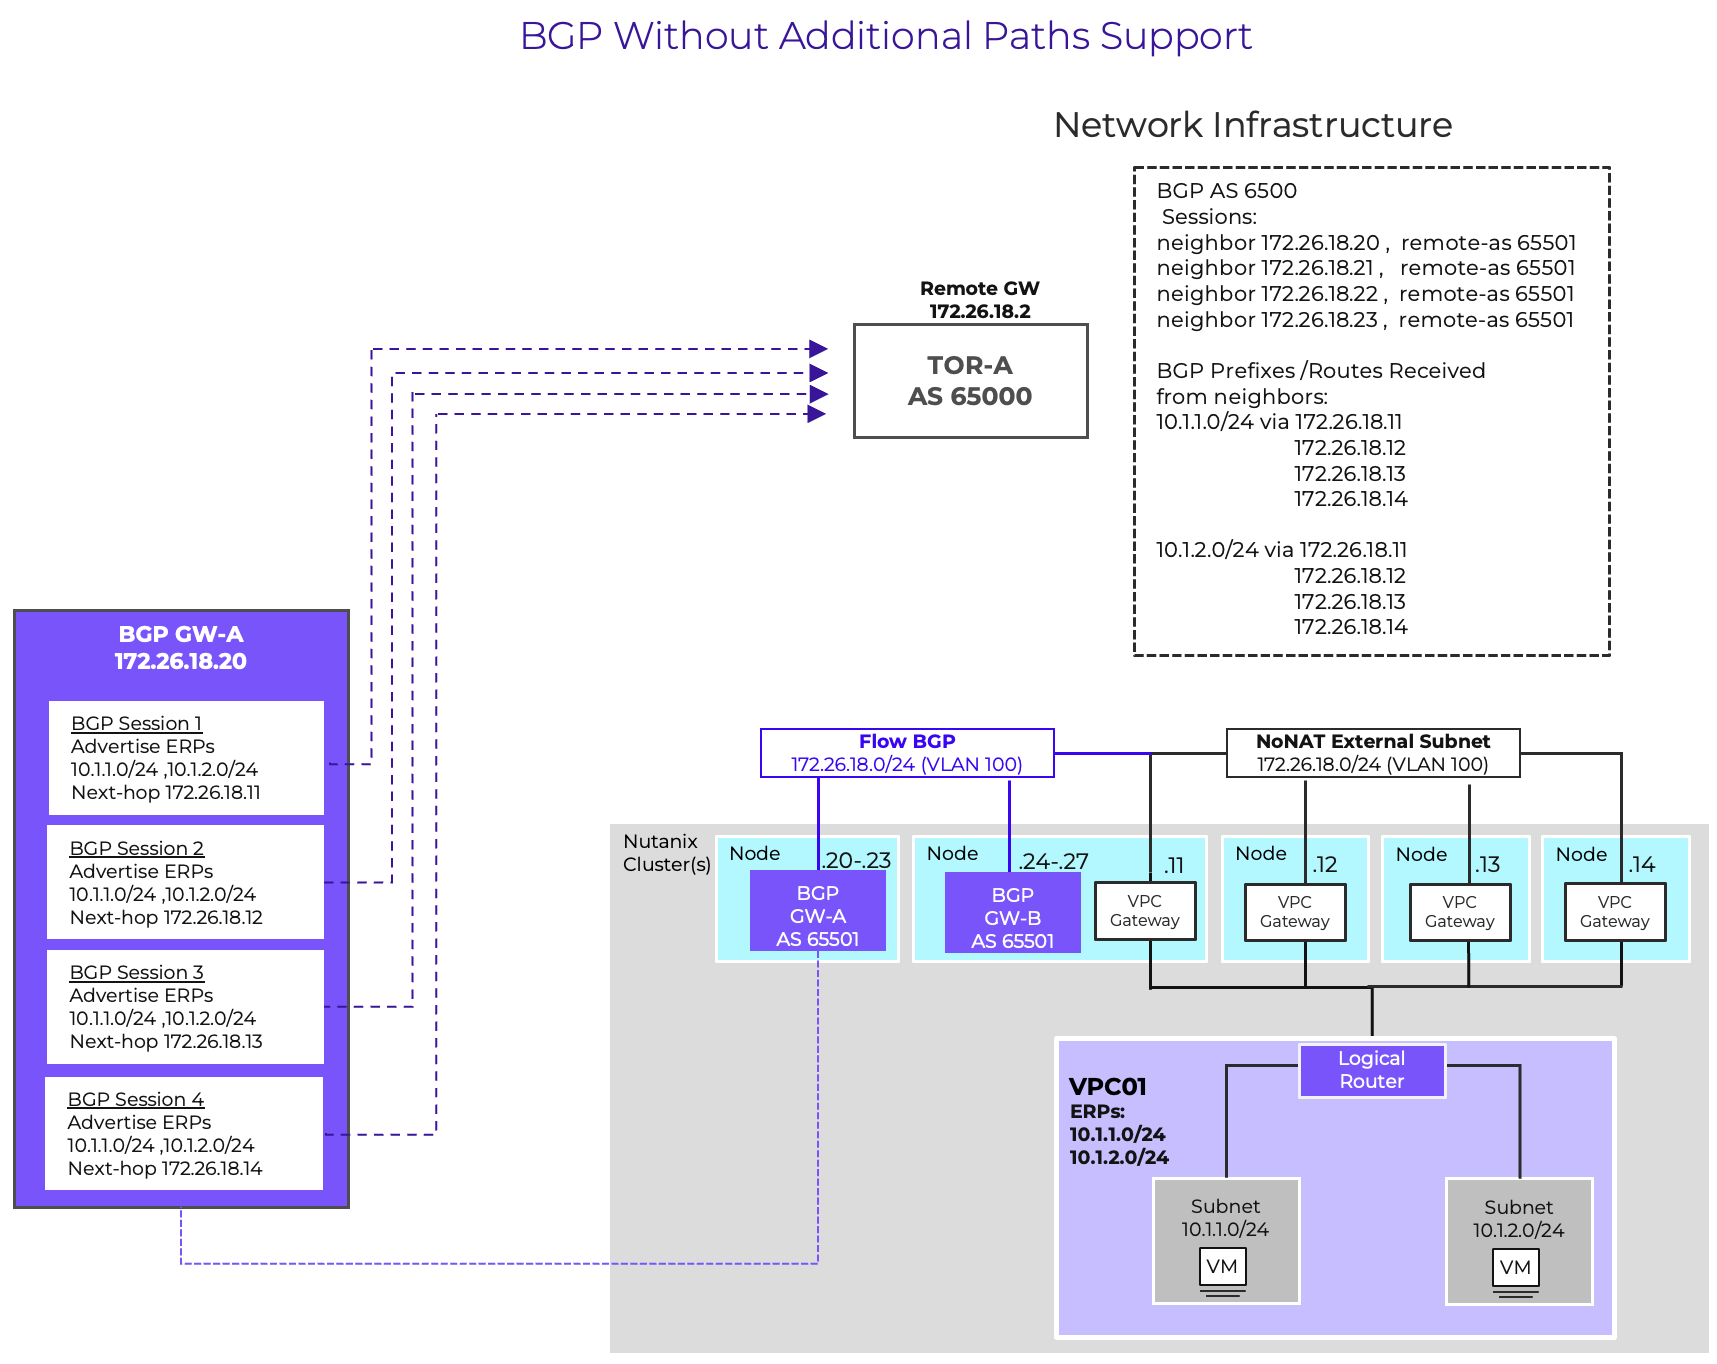
Load Balancer Service
Load balancers have been an important part of the data center infrastructure for a long time. Organizations have deployed load balancers to scale resources, improve reliability, eliminate single points of failure and help prevent overloading of servers.
Load Balancer Architecture and Deployment
The FVN Load Balancer, an integral component of Flow Virtual Networking (FVN), delivers distributed load balancing for data traffic. Its implementation scales linearly with the number of hosts in the cluster, eliminating single bottlenecks and allowing capacity to expand automatically as the environment grows. This native Layer 4 load balancing capability simplifies client traffic management by enabling the creation of rules directly within the Virtual Private Cloud (VPC), thereby ensuring high availability without the need for external appliances.
Components
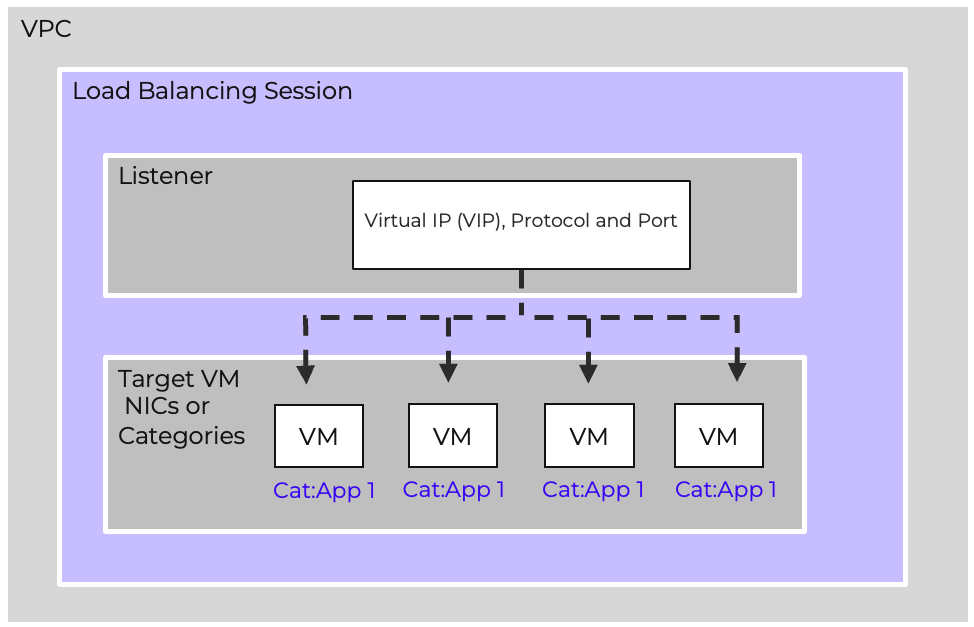
Session
A Load Balancer session is deployed in a VPC. The session defines what protocol and port is being listened for, and where the traffic is balanced to.
Listener
The Listener is the front end of the load balancer, clients connect to the listener. The Listener is made up of a virtual IP address (VIP) and the port and protocol being balanced. The virtual IP is selected from the VPC overlay subnet.
Target
The load balancer distributes traffic to specific targets for a session. These targets can be either VM NICs or Categories that have been assigned to the VMs being load balanced.
Note
Pro tip
Using categories for targets makes adding and removing target VMs simple and automatic.
Supported Traffic Types
The service supports TCP and UDP workloads, handling both internal service distribution and external client access. Load balancing can be applied to frontend services exposed to external networks or to backend tiers requiring internal balancing.
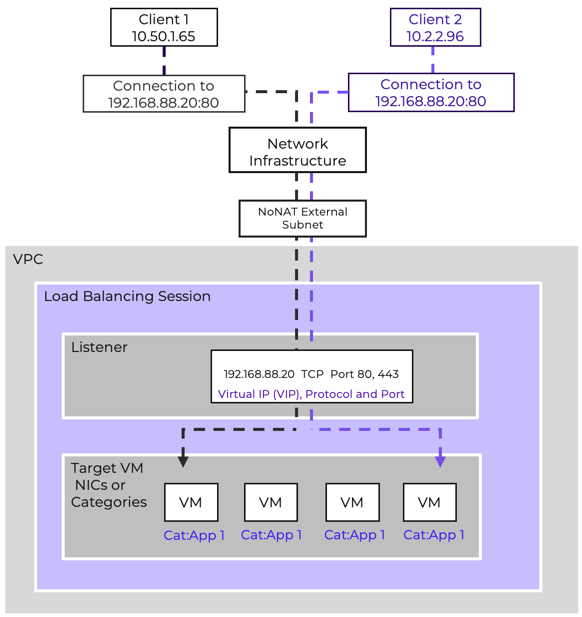
Health Checks and Failover Behavior
The load balancer continuously probes backend members to ensure availability. The health check probes are sent to the ports defined in the target VM configuration. By default, these checks are sent every 5 seconds. A health check will timeout after 2 seconds if no response is received. A target is marked unhealthy after 3 consecutive failed checks. Targets marked unhealthy are automatically removed from rotation and will not receive traffic distributed from the listener until the target is marked healthy again. A target is marked healthy after 3 successful health check probes.
Integration with External Connectivity
Load-balanced services can be exposed externally using floating IPs. This enables simple integration with NAT external subnets and ensures resilience for public-facing workloads.
When to Use Nutanix LB vs Third-Party ADCs
The Nutanix LB is ideal for most common application workloads. For advanced use cases requiring deep L7 inspection, SSL offload, or global server load balancing, third-party ADCs can be integrated.
Subnet Extension
Subnet Extensions are a powerful feature of Flow Virtual Networking. VTEP Gateways use VXLAN to enable Subnets to participate in layer-2 bridging across layer-3 boundaries This can greatly simplify migrations by removing network-based constraints from scheduling. Similarly, Subnet Extensions add substantial flexibility to Disaster Recovery planning, enabling easier DR testing and partial subnet failovers by enabling IP mobility across availability zones. They also enable integration of physical infrastructure into a Virtual Private Cloud, meaning legacy workloads don’t need to be a hindrance to adoption of software defined networks.
However, it is vital that Subnet Extensions be used judiciously, ensuring that routing design and physical connectivity are considered to avoid undesirable asymmetric traffic. The standalone nature of VTEP Gateways also is a significant consideration before utilizing Subnet Extensions for any mission-critical applications. This section will discuss the design and functionality of VTEP gateways, as well as considerations for the most common use cases for Subnet Extensions.
VTEP Gateways
VTEP Gateways are deployed as VMs running an instance of VyOS and acting as a virtual router. They can be deployed on either VLAN-backed Subnets or within a VPC. When deployed on a VLAN-backed Subnet, they are able to extend other VLAN-backed subnets. When deployed in a VPC, they are able to extend other subnets within the VPC.
VTEP Gateways use VXLAN, which is a Network Encapsulation standard similar to Geneve. VXLAN is commonly available across a variety of platforms, including virtual and physical network infrastructure, making it ideal for ensuring compatibility with as many external platforms as possible.
VTEP Gateways have a Service Interface, which is the first vNIC and is used for management traffic as well as acting as the VXLAN TEP. This initial vNIC is the eth0 interface for the VM. This service interface must be reachable via Prism Central via ping and TCP-8888 for monitoring and configuration. Additionally, the service interface must be able to reach a user-provided NTP server. If the configured NTP server is an FQDN address, the network gateway must also be able to reach a configured DNS server via the service interface.
Each Subnet Extension results in the addition of a vNIC and thus an additional eth interface. Additionally, a vxlan logical interface is created to manage the encapsulation and decapsulation of traffic for the extension. Finally a bridge interface is created to connect the eth interface to the vxlan interface. A listener IP for the extended subnet is allocated and assigned to the bridge interface. These interfaces are numbered, with the first subnet extension on a particular VTEP Gateway using eth1, br1, vxlan1, the second using eth2, br2, vxlan2, and so on. The following diagram shows a VTEP GW that is providing Subnet Extension functionality for two subnets.
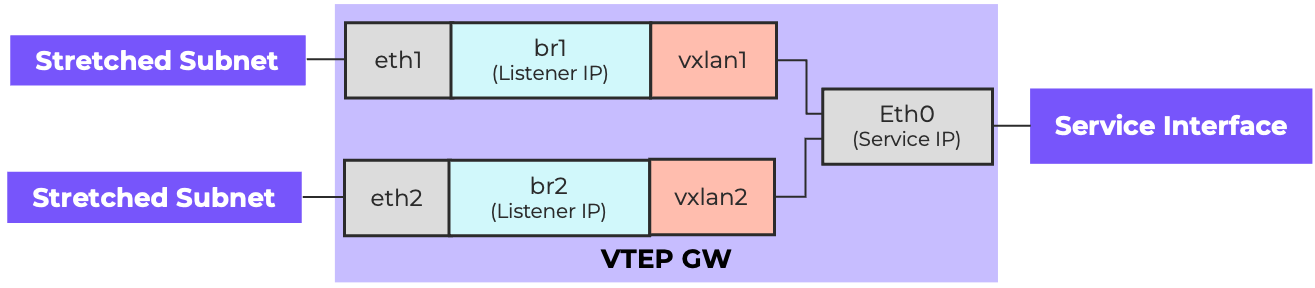 Anatomy of a VTEP Gateway
When any Network Gateway is deployed within a VPC, a service Subnet called Nutanix-internal-vpn is instantiated, using 100.64.1.0/24 for addressing. This subnet is used for the Service Interface. As the 100.64.1.0/24 address space would be used across multiple VPCs, a NAT External Network & a Floating IP are required. Additionally, if the default route for the VPC is a routed external network, a network policy must be configured to forward traffic from the 100.64.1.0/24 with an external destination to the NAT External Network gateway.
Subnets Extensions to Support Disaster Recovery
The above diagram shows an example of how subnet extensions can be used to support disaster recovery operations. In this example, the subnet extension’s purpose is to facilitate disaster recovery testing operations. By extending the subnet between sites, DR tests can be conducted by failing a subset of VMs over to the DR side. They are able to maintain their own IP address. Network policies can be configured on the DR-VPC to cause north/south traffic for the failed-over VMs back across the subnet extension. This allows for a DR test to be conducted without having to change IPs during the test, and without having to make any changes on the physical network infrastructure to support the test.
It’s important to understand, in this design, the Subnet Extension exists solely to simplify testing. During an actual DR event, the Subnet Extension is most likely no longer functional, as the production side would be down. When VMs are failed over, additional network configuration is likely required to allow the subnet to egress out of the DR datacenter. The network policies configured to support egress redirection should be removed, and routing configurations may need to be adjusted. The required operations vary based on physical network design and specific VPC configuration.
It is recommended that vital infrastructure services, such as domain controllers, have an always-on instance deployed to support DR, preventing any delays in return to operation while waiting for these services to spin up. These resources should not be deployed in a stretched subnet. It is recommended that they be deployed in a subnet specific to the DR environment, and this is shown as DR-200 in the above diagram.
Subnet Extensions to Support Migrations
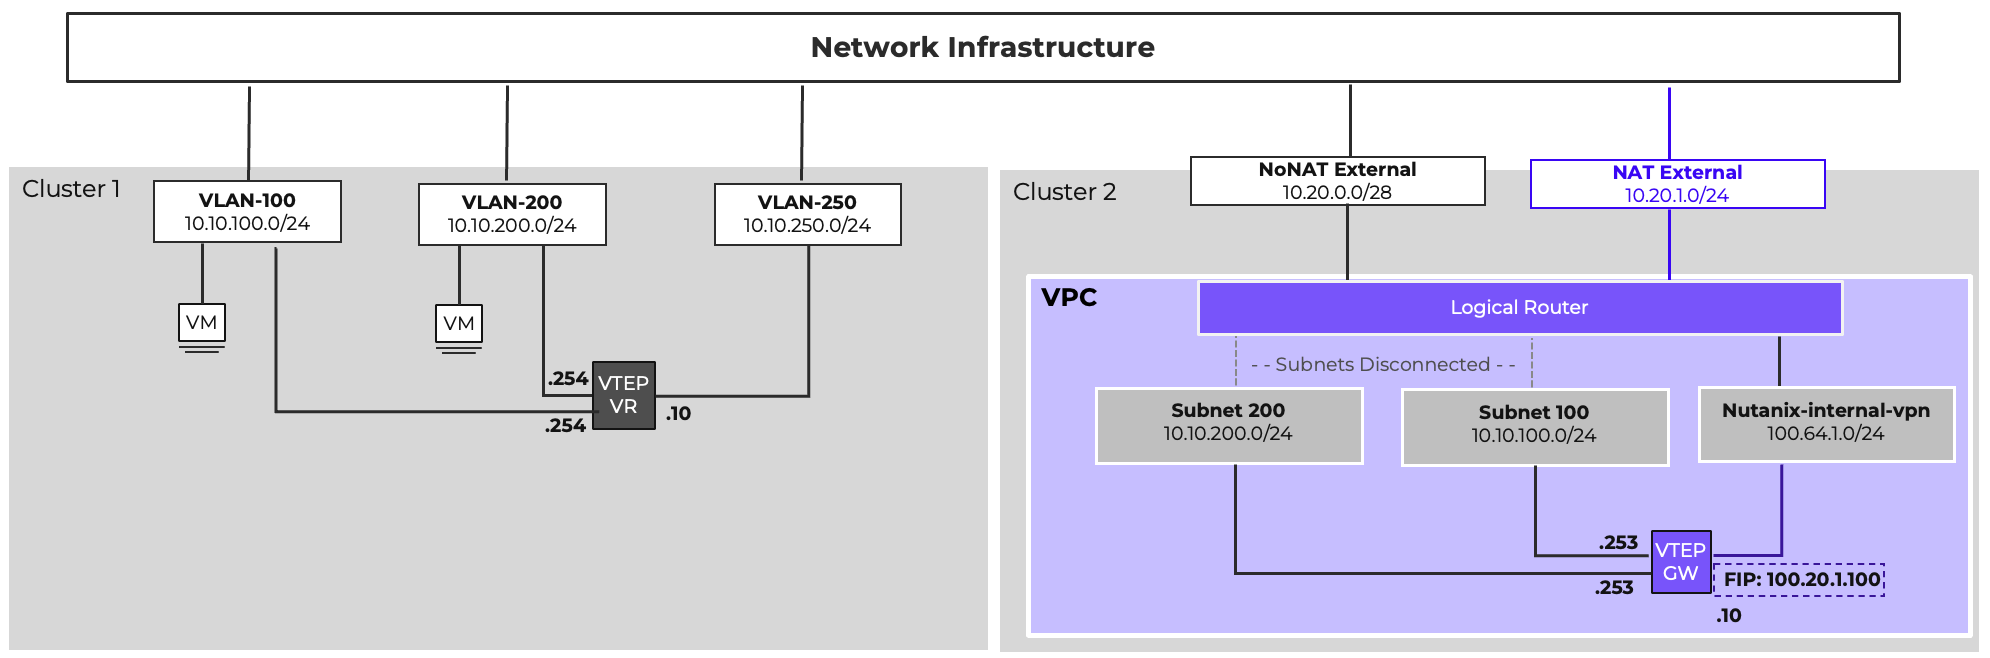
Subnet Extensions are regularly used to facilitate migrations into Flow Virtual Networking, allowing VMs to be migrated in phases without requiring IP changes. The above diagram shows an example of how this can be achieved. In the diagram, VMs on VLAN-100 and VLAN-200 are to be moved into a VPC on a new Nutanix cluster. Subnets can be created in the new VPC with matching addressing, and a VTEP Gateway deployed.
A software VTEP can be deployed on the source side. VyOS Virtual Routers are an excellent option for this, since Nutanix Network Gateways are built on the VyOS platform themselves. The VTEPs on the source side will need to be manually configured in a manner similar to the Nutanix VTEP Gateway as shown above. The sample configuration below would configure a VyOS virtual router to match the picture above.
set interfaces ethernet eth0 address 10.10.150.250/24
set protocols static route 0.0.0.0/0 next-hop 10.10.150.1
set service ssh
set interfaces bridge br1 address 10.10.100.254/24
set interfaces bridge br1 aging '300'
set interfaces bridge br1 member interface eth1
set interfaces bridge br1 member interface vxlan1
set interfaces bridge br1 mtu '1392'
set interfaces vxlan vxlan1 ipv6 address no-default-link-local
set interfaces vxlan vxlan1 mtu '1392'
set interfaces vxlan vxlan1 port 4789
set interfaces vxlan vxlan1 remote 10.20.1.100
set interfaces vxlan vxlan1 source-address 10.10.250.10
set interfaces vxlan vxlan1 vni 100
set interfaces bridge br2 address 10.10.200.254/24
set interfaces bridge br2 aging '300'
set interfaces bridge br2 member interface eth2
set interfaces bridge br2 member interface vxlan2
set interfaces bridge br2 mtu '1392'
set interfaces vxlan vxlan2 ipv6 address no-default-link-local
set interfaces vxlan vxlan2 mtu '1392'
set interfaces vxlan vxlan2 port 4789
set interfaces vxlan vxlan2 remote 10.20.1.100
set interfaces vxlan vxlan2 source-address 10.10.250.10
set interfaces vxlan vxlan2 vni 200
commit
save
With a remote VTEP configured, Subnet Extensions can be built. Then, the subnets can be set to a disconnected state via atlas_cli, the command line interface in Prism Central for managing Flow Virtual Networking. This causes both subnets to use the existing network infrastructure and default gateway for both north/south and east/west traffic.
Once a Subnet’s migration has proceeded to the point where most of the traffic is now originating from the Nutanix side, the subnet can be reconnected to the VPC Logical Router, and the original network’s default gateway can be shut down. That subnet can then be directed to the Nutanix VPC, either by static routing or by advertising the subnet via BGP. Once all subnets are migrated, the subnet extensions and VTEP gateway can be removed.
Note
Note
In certain cases, egress traffic redirected across a subnet extension may fail due to VPC or physical network design. If this occurs, please contact support and reference KB-19698 to address this issue.
Subnet Extensions to Support Legacy Infrastructure
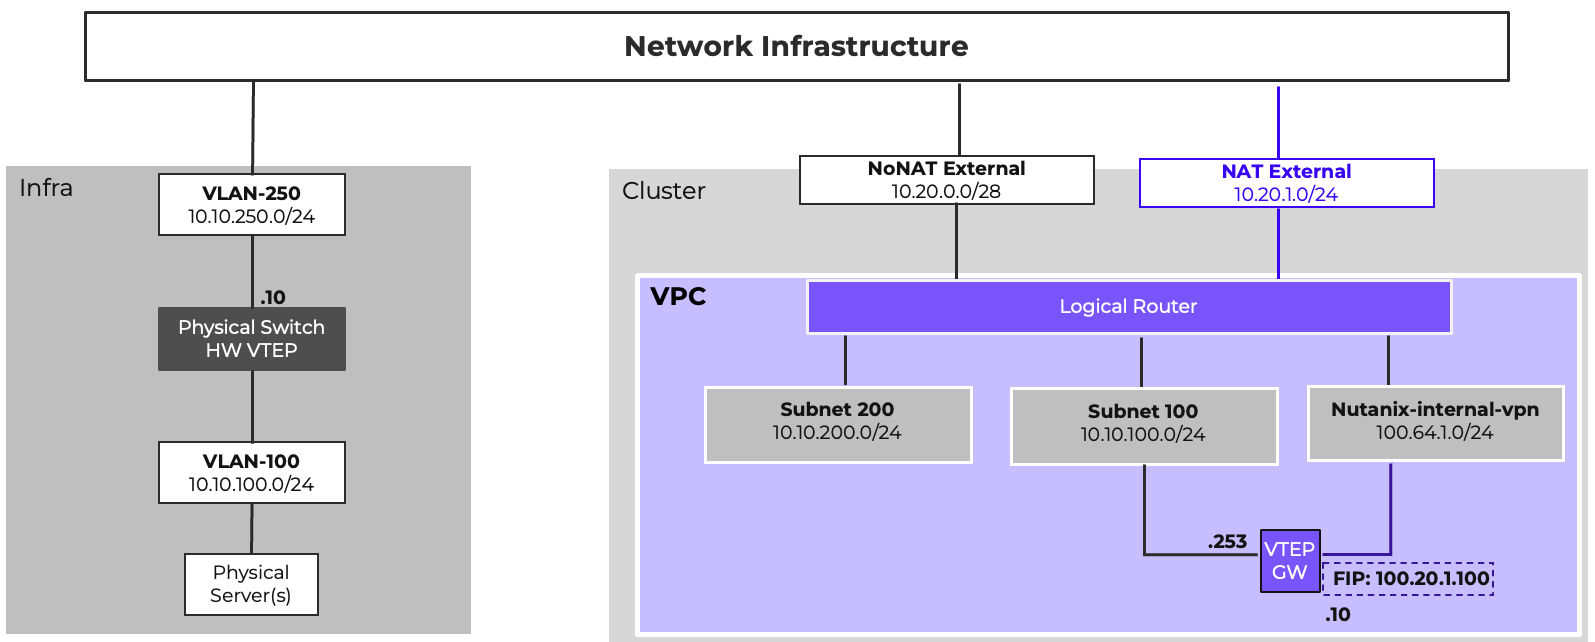
Subnet extensions can be built to hardware VTEPs as well, and many modern switches can be configured to act as a VTEP. With this configuration, legacy physical gear can live within a VPC if layer-2 adjacency to other VMs is a requirement.
Limits and Caveats of Subnet Extensions
Subnet Extensions, when used appropriately are an excellent tool to extend the functionality of Flow Virtual Networking. However, they must be used carefully. Layer 2 and Layer 3 operate in tandem. Extending a subnet without carefully considering traffic routing and possible asymmetric traffic patterns can result in unexpected and undesirable behavior.
Throughput considerations and scale limitations are also important. A VTEP Gateway can reasonably provide 3.5Gbps of throughput. Each Subnet extended through the same gateway shares that throughput, and Prism Central can manage a finite number of VTEP Gateways (see the Configuration Maximums section.)
Finally, be aware that VTEP Gateways are VMs, and are not deployed in a highly available manner. That is to say, if the host that a VTEP Gateway is on fails, any traffic depending on a Subnet Extension will be disrupted until the VTEP Gateway reboots on another host. Because of this, limit the reliance of critical or production traffic on Subnet Extensions as much as possible. When using Subnet Extensions for migrations, plan your migrations to minimize the duration that the extension is required as much as possible. Ensure that you consider the throughput limitations and scale limits when planning Extensions and VTEP Gateways. When extending multiple subnets, consider dedicated VTEP Gateways for higher utilization networks, while pairing up lower utilization networks if necessary.
Putting It All Together
Prism Central Deployment
Prism Central should be deployed in a 3-node scale-out configuration for the highest management plane availability. Deploy within the same Availability Zone/datacenter as managed clusters.
- Small, Large, and X-Large PC sizes are supported. X-Small is not supported.
- Must be deployed on AHV with compatible AHV/AOS versions on all managed clusters
- Each site/datacenter should have a local Prism Central when using VPCs
- Create a VIP for Prism Central before enabling — do not change after setting
Network Controller Deployment
The integrated Network Controller is suitable for most scenarios and is recommended as the default option, as it supports all features of Flow Virtual Networking & Flow Network Security. When deploying the integrated Network Controller in a production environment, Prism Central must be scaled out. Failing to do so will cause Prism Central maintenance operations, including upgrades and reboots caused by host failure, to induce network disruptions. Deploying the integrated Network Controller will cause the following resource adjustments for Prism Central.
| PC Size | RAM | vCPU |
|---|---|---|
| Small | +3 GB per VM | +2 vCPU per VM |
| Large | +4 GB per VM | +3 vCPU per VM |
| X-Large | No additional resources needed, Network Controller included by default |
The Standalone Flow Controller can be deployed when organizational requirements call for disaggregation of the management and control planes. The Standalone Flow Controller can also be deployed in production environments where Prism Central will not be scaled out. Similar to Prism Central, the Flow Controller deployment has three sizes consuming the following resources:
| Size | RAM | vCPU |
|---|---|---|
| Small | 56 GB | 28 vCPU |
| Large | 68 GB | 40 vCPU |
| X-Large | 90 GB | 52 vCPU |
The following features are currently not supported by the Standalone Flow Controller:
- Flow CNI (Container Networking Interface)
- Flow Network Security Container Networking Security
- Flow Network Security Policy Sync
- Flow Network Security IPv6 Policies
- Cross Cluster Live Migration for machines secured by Flow Network Security
MTU Recommendations
Geneve encapsulation incurs an overhead cost of 58 bytes on top of standard ethernet framing. To allow for this without a loss of performance, all physical switches used for host to host communication should ideally be configured to support an MTU of 9000 bytes if possible, and 1558 at minimum. Additionally, the virtual switch configured for VPC east/west traffic (vs0 by default) should be configured to match. By default, DHCP will advertise an MTU of 1442 to VPC guest VMs regardless of the MTU set on the VPC E/W virtual switch. It is possible to increase the advertised MTU on a per-subnet basis via atlas_cli in Prism Central. Alternatively, the guest OS MTU can be manually increased to take advantage of a higher available MTU if desired.
Note
Note
Do not attempt to modify the MTU of Prism Central VMs or CVMs unless instructed by Nutanix support.
In cases where the physical and virtual switch MTU cannot be increased, the DHCP MTU advertisement will prevent fragmentation for VMs receiving their IP assignment via DHCP. Not all guest operating systems honor DHCP MTU advertisement. In those cases, if the physical and virtual switch MTU are unable to be increased, ensure that the guest OS MTU configuration is manually set to the value in the table below dependent on the features in use:
| Feature | MTU (Overhead Calculation) |
|---|---|
| VPC | 1442 (1500 - 58 Geneve) |
| VPC + Subnet Extension | 1392 (1500 - 58 Geneve - 50 VXLAN) |
| VPC + VPN | 1356 (1500 - 58 Geneve - 86 IPSec) |
| VPC + Subnet Extension + VPN | 1306 (1500 - 58 Geneve - 50 VXLAN - 86 IPSec) |
Configuration Maximums
Prism Central sizing is primarily driven by the number of VMs in the environment. However, Flow Virtual Networking does have additional configuration maximums that might drive a larger Prism Central size than that driven by VM count alone. These include, but are not limited to, number of VPCs, Subnets, Network Gateways, BGP Sessions, and VPN Sessions. Please refer to the following pages on the Nutanix Support Portal for the full list of configuration maximums:
Configuration Maximums for the integrated Network Controller 7.0
Port Requirements
Required connectivity between Prism Central, AHV hosts, CVMs, Network Gateways, and other infrastructure components is essential for proper functionality. The specific connectivity required for Flow Virtual Networking is documented in the Ports and Protocols section of the Nutanix Support Portal.
RBAC for Flow Virtual Networking
There are two built-in RBAC roles specific to Flow Virtual Networking. The VPC Admin role is geared towards allowing operations exclusively for VPCs and Overlay Subnets, and consists of 83 operations across 21 entity types. VPC Admins are able to manage VPCs, overlay subnets, Floating IPs, PBR policies, routing policies, LB sessions, network gateways, VPN connections, and BGP sessions.
The Network Infra Admin allows management of VLAN-backed networking and related components, and consists of 60 operations across 13 entities. Network Infra Admins can manage virtual switches, VLAN subnets, VLAN external subnets, network gateways, VPN connections, L2 extensions, and traffic mirroring.
Both roles can manage Network Gateways, VPN Connections, and Layer 2 Subnet Extensions. Overlay External Subnets and NIC Profiles require Super Admin or Prism Admin roles. Starting with AOS 7.0/pc.2024.3, entity types use updated filter attributes for more granular permissions.
Reference Deployment Architectures
In this section, we will explore a number of standard reference designs for Flow Virtual Networking on Nutanix Cloud Infrastructure 7.5. In all instances, the configuration assumes the following major versions:
Prism Central: 7.5.x
AHV: 11.x
AOS: 7.5.x
Network Controller: 7.0
In these designs, we are focusing mainly on the VPC design and configuration, and leaving the physical infrastructure abstract and simplified. These VPC architectures can be implemented as shown in most environments, requiring minimal adjustment depending on the physical topology. For example, a larger cluster that spans multiple leaf pairs in a spine & leaf architecture could have more complex requirements for providing external network connectivity than a smaller cluster connecting to a single access pair in a traditional collapsed core design. Such complexities, while a significant consideration, are outside the scope of this document. Functional variations between network vendors, including different models from the same vendor, preclude a definitive external networking design.
For details on physical host connectivity, refer to the Physical Networking Best Practices Guide on the Nutanix Support Portal. For more information on general AHV networking, including virtual switch configuration, refer to the AHV Networking Best Practices Guide on the Nutanix Support Portal.
In all design examples, Prism Central is deployed as a scale-out cluster on the Nutanix-Mgmt VLAN, and the Integrated Network Controller is deployed. All networking will use the standard vs0 virtual switch.
1 - Basic VPC Deployment
Static Routing
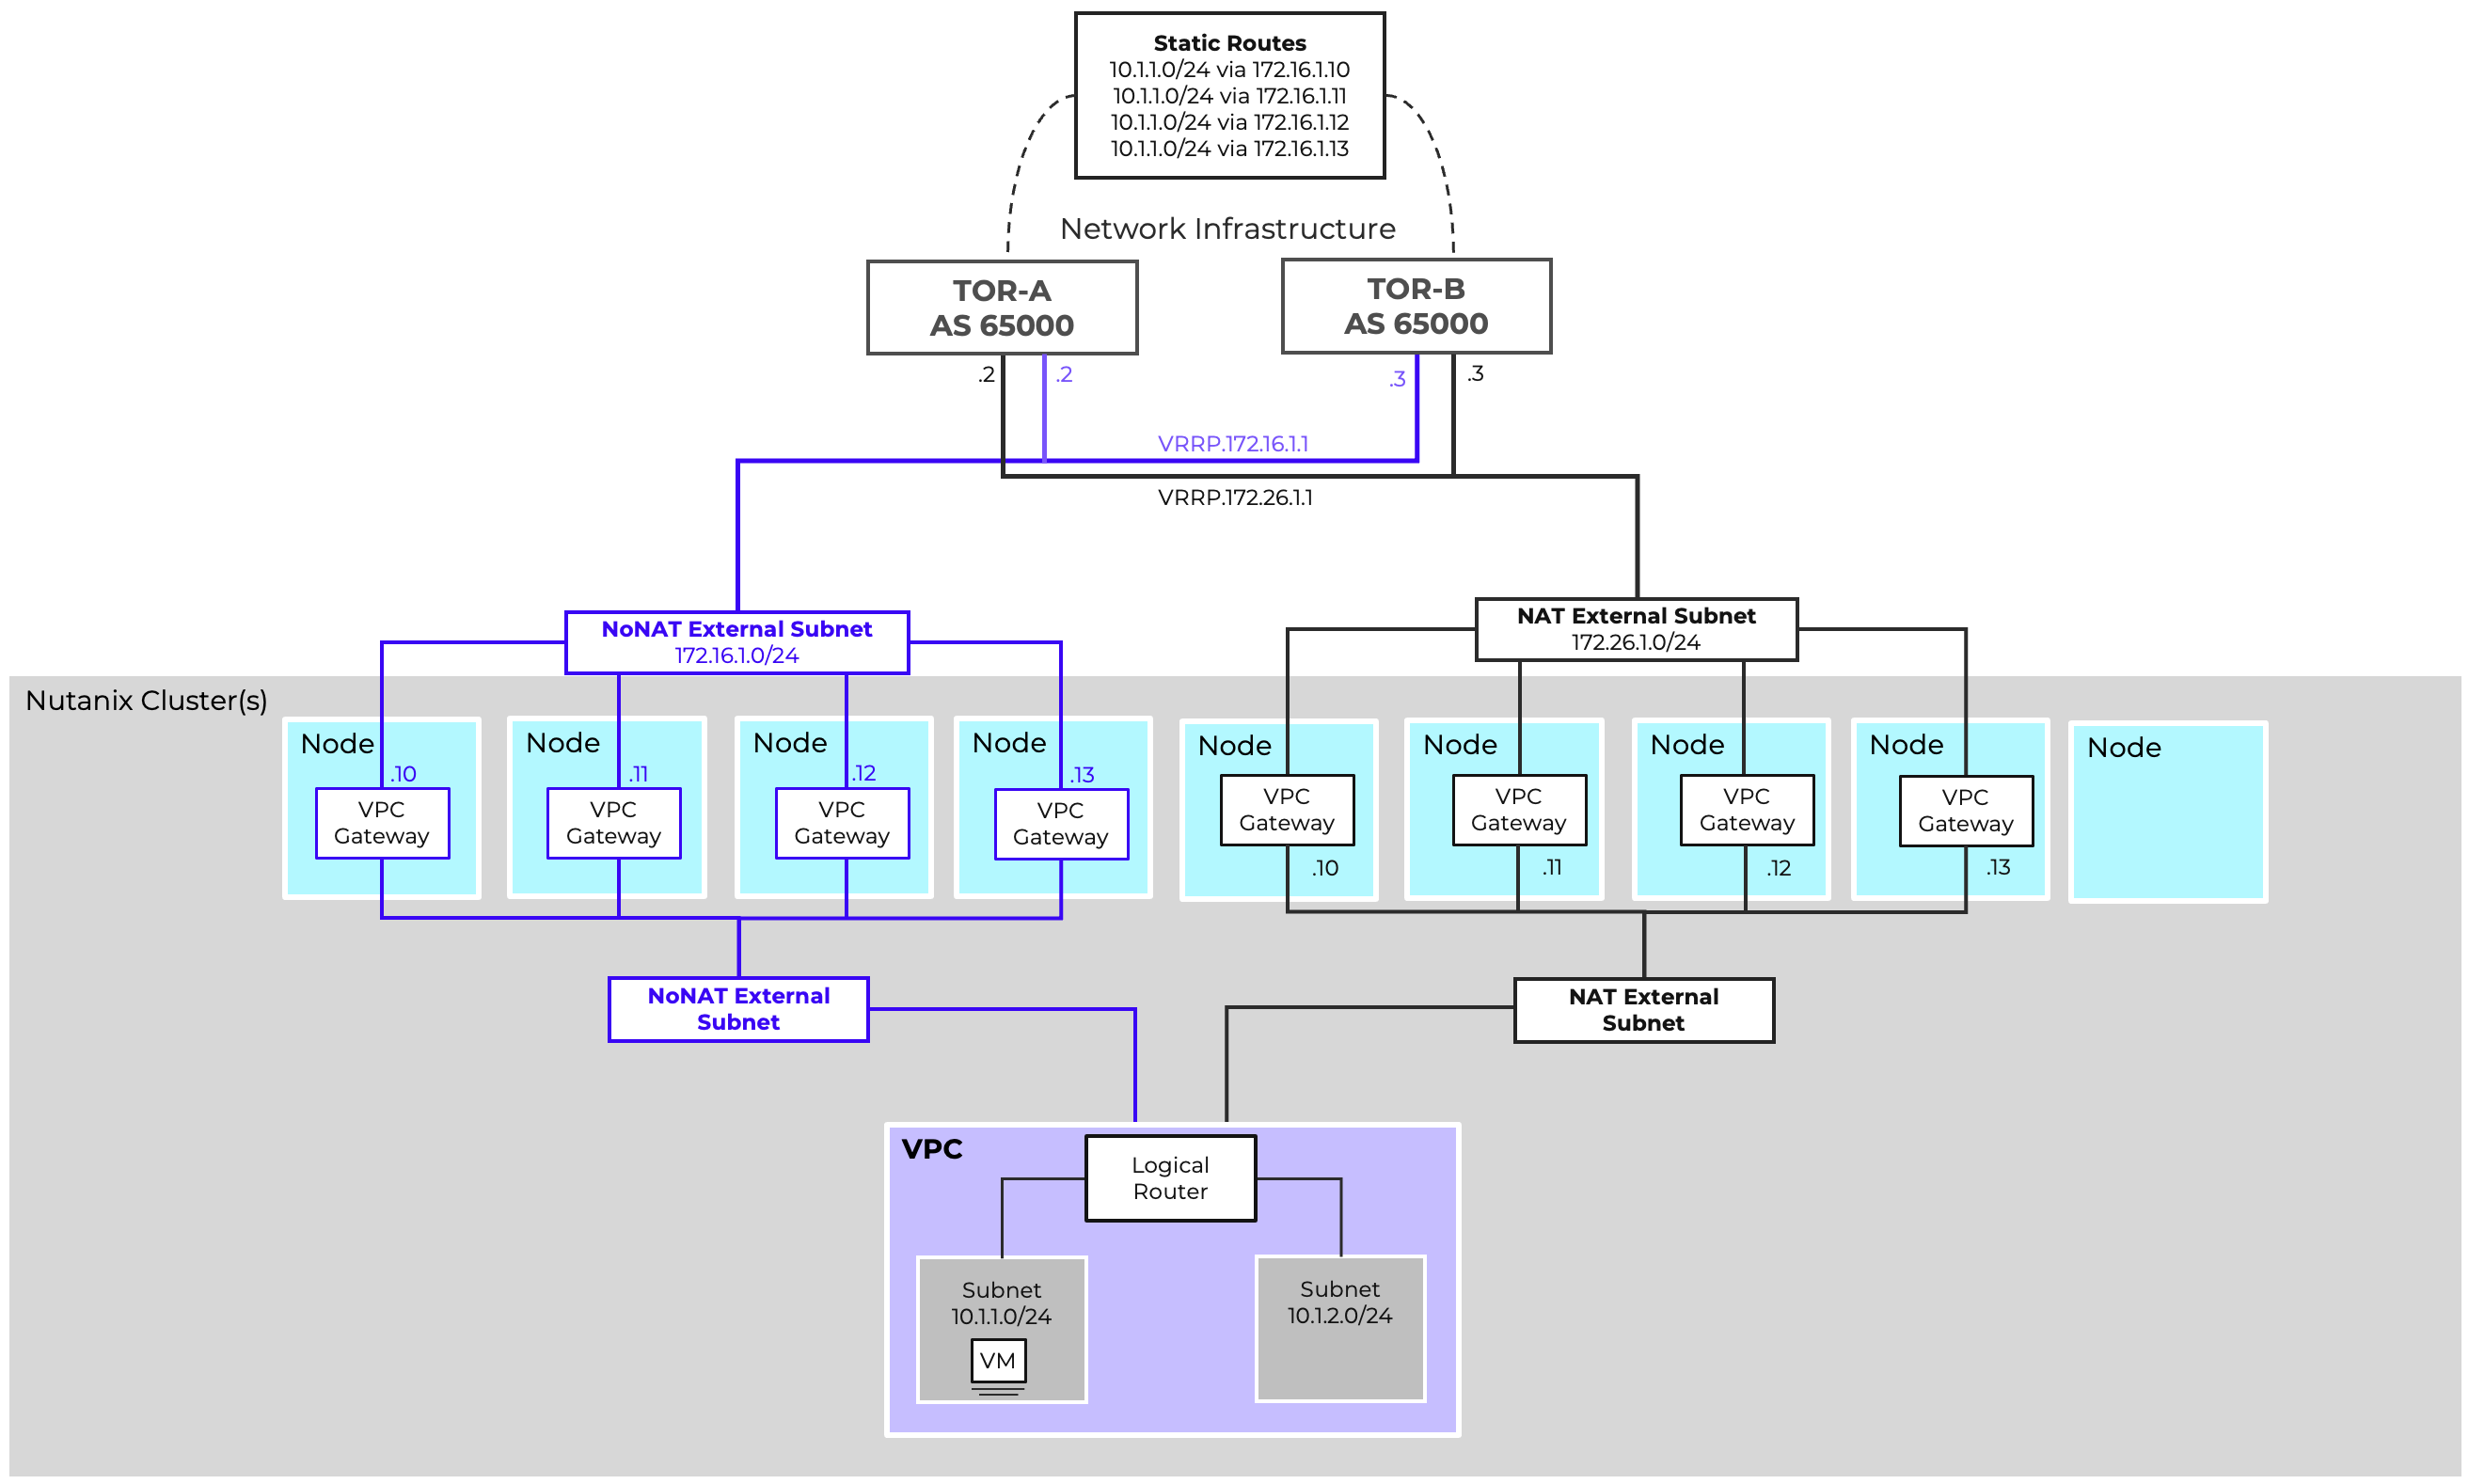
A single VPC with static routing is the most basic Flow Virtual Networking deployment. In this design, a 5-node AHV cluster running NCI 7.5 is installed, and all nodes are connected to the same pair of switches.
The following External Networks are configured:
| Name | Flow-Ext-NoNAT | Flow-Ext-NAT |
|---|---|---|
| VLAN ID | 200 | 201 |
| Virtual Switch | vs0 | vs0 |
| External Connectivity for VPCs | Enabled | Enabled |
| NAT | Disabled | Enabled |
| Network CIDR | 10.0.200.0/24 | 10.0.201.0/24 |
| Gateway | 10.0.200.1 | 10.0.201.1 |
| IP Pool | 10.0.200.10-10.0.200.19 | 10.0.200.10-10.0.200.250 |
A single VPC will be configured leveraging both of these external networks. It is preferred that the default route use the NoNAT external network. The NAT external network will be configured to allow for later assignment of Floating IPs as needed. The 10.10.0.0/16 address space has been allocated for use within the VPC, and does not overlap with anything external in our example. As such, the 10.10.0.0/16 IP space can be defined as externally routable. Modify this to suite your specific environment as needed. With the cluster containing five nodes, four nodes are available to act as gateway nodes. As such, for maximum north/south bandwidth, both external networks will be configured for 4 active gateway nodes. The following VPC configuration accomplishes this:
| Name | Prod-VPC |
|---|---|
| Transit VPC | No |
| Externally Routable IP Prefixes | 10.10.0.0/16 |
And the details of each External Subnet connected to the Prod-VPC follow:
| Name | Flow-Ext-NoNAT |
|---|---|
| Set this subnet as default next hop for outbound traffic. | Yes |
| Destination Prefixes | 0.0.0.0/0 |
| Router IP Assignment Mode | Custom Defined |
| Custom Router IP | 10.0.200.10, 10.0.200.11, 10.0.200.12, 10.0.200.13 |
| External Gateway Configuration: Number of Active Hosts | 4 |
| Name | Flow-Ext-NAT |
|---|---|
| Set this subnet as default next hop for outbound traffic. | No |
| Destination Prefixes | N/A |
| SNAT IP Assignment Mode | Custom Defined |
| Custom SNAT IP | 10.0.201.10, 10.0.201.11, 10.0.201.12, 10.0.201.13 |
| External Gateway Configuration: Number of Active Hosts | 4 |
This simple design leverages static routing. As such, the network infrastructure will need to be configured with static routes for the 10.10.0.0/16 IP block. To take advantage of gateway scale-out, a static route for the 10.10.0.0/16 destination should be configured with each Custom Router IP as the next hop.
Within the VPC, we are able to configure overlay subnets. Four example subnets are shown here, but this design allows full flexibility and usability of the 10.10.0.0/16 address space.
Dynamic Routing
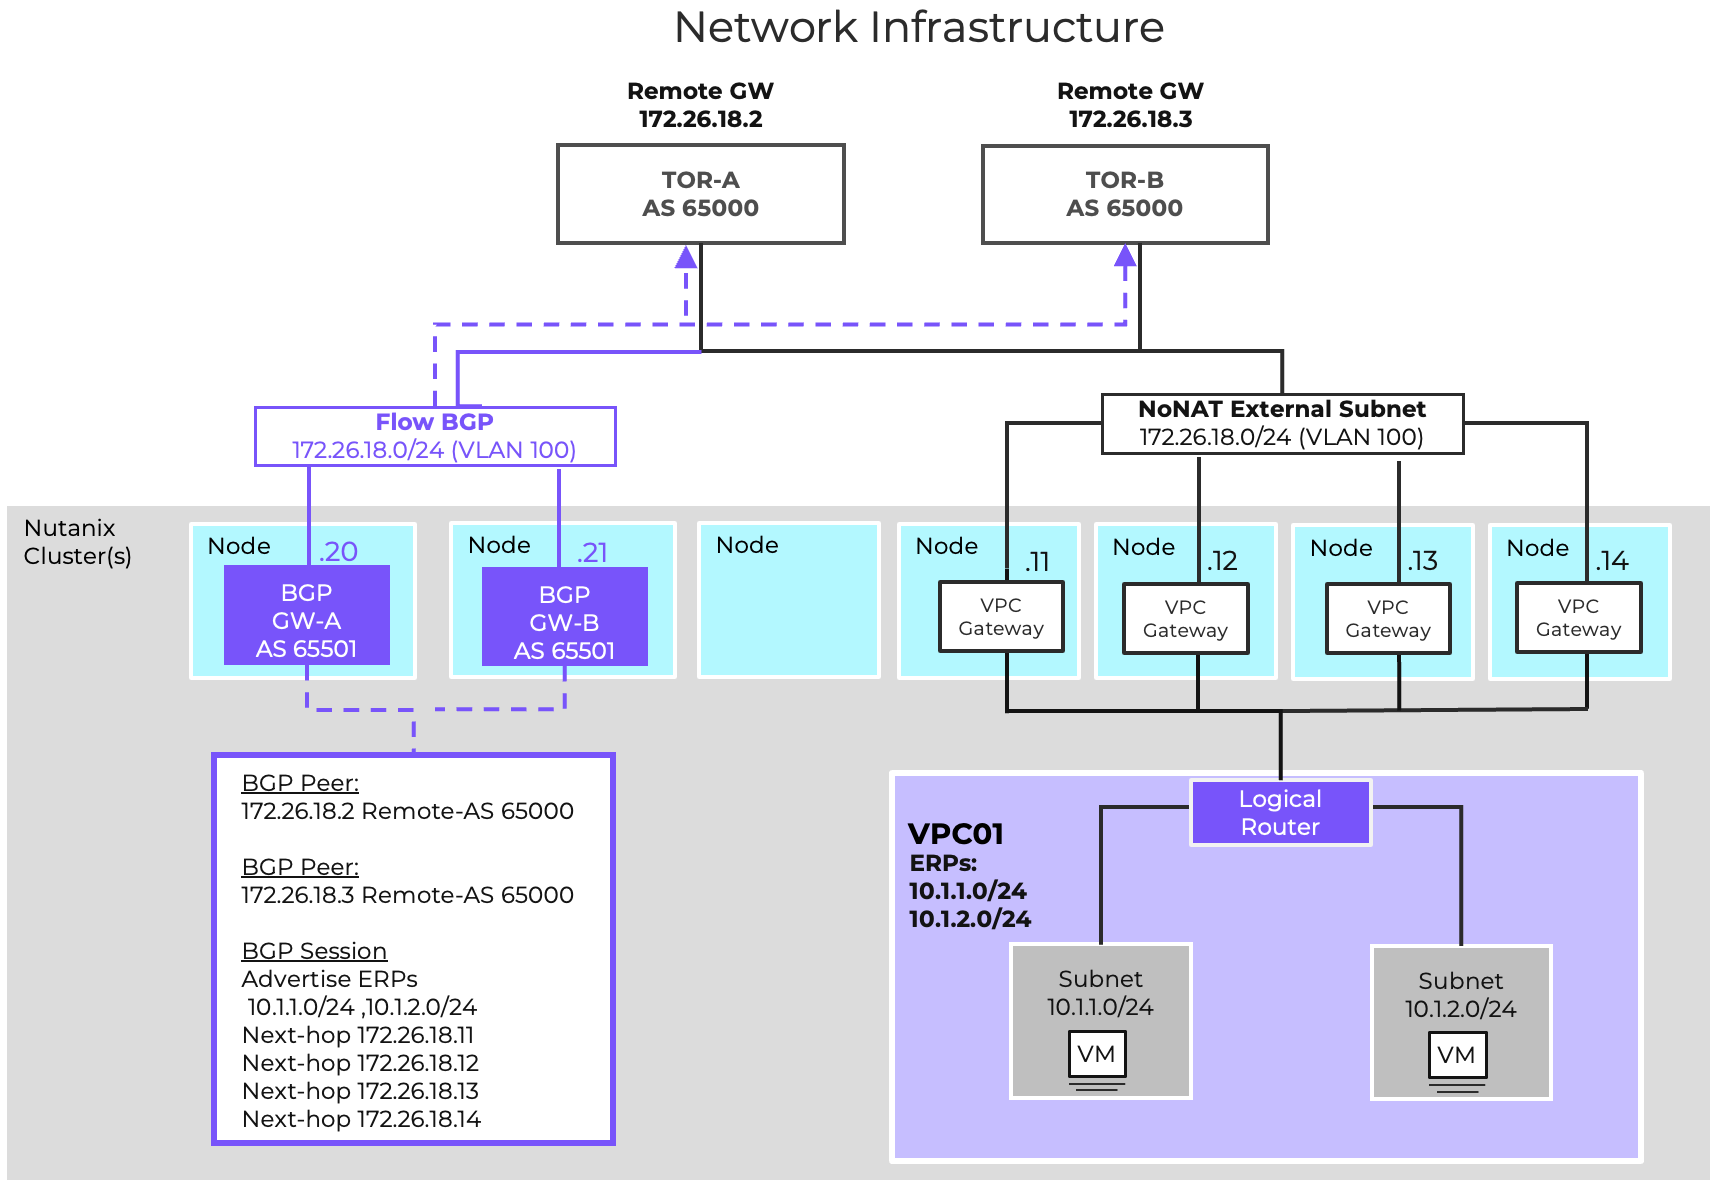
While static routing may be suitable for some deployments, many organizations require the flexibility of being able to allocate and utilize additional address spaces without requiring manual configuration of new routes on the physical network. The VPC design can be augmented with BGP to facilitate this.
For simplicity, we want to deploy the BGP gateways on the same VLAN as the VPC external network. As an External Network cannot be connected directly to a VM, we will create a non-external instance of VLAN200 called Flow-BGP. Configure this additional VLAN with External IPAM to avoid address conflicts. We will deploy two BGP gateways for high availability in Additional Paths mode to simplify configuration. The following Network Gateways will be configured:
| Gateway Name | BGP-GW-A | BGP-GW-B |
|---|---|---|
| Gateway Attachment | VLAN | VLAN |
| Subnet | Flow-BGP | Flow-BGP |
| DNS Configuration | Inherit from Cluster | Inherit from Cluster |
| NTP Configuration | Inherit from Cluster | Inherit from Cluster |
| Gateway Service | BGP | BGP |
| Serviced VPC | Prod-VPC | Prod-VPC |
| BGP Path Advertisement Configuration | Advertise Multiple Routes | Advertise Multiple Routes |
| Static IP Address | 10.0.200.20/24 | 10.0.200.21/24 |
| Default Gateway | 10.0.200.1 | 10.0.200.1 |
| eBGP ASN | 65001 | 65001 |
Each of the TOR switches will be configured as a remote gateway, and both BGP gateways will be peered to both TOR switches. This will enable the BGP gateways to advertise the configured Externally Routable IP Prefixes to both TORs with all four router IPs advertised as an eligible, installable path. The following Remote Gateways will be configured:
| Name | TOR-A | TOR-B |
|---|---|---|
| Gateway Service | BGP | BGP |
| Service IP Address | 10.0.200.2 | 10.0.200.3 |
| eBGP ASN | 65001 | 65001 |
The following BGP Sessions will be configured:
| Local Gateway | BGP-GW-A | BGP-GW-A | BGP-GW-B | BGP-GW-B |
|---|---|---|---|---|
| Remote Gateway | TOR-A | TOR-B | TOR-A | TOR-B |
| Session Name | GW-A-TOR-A | GW-A-TOR-B | GW-B-TOR-A | GW-B-TOR-B |
| Advertised Externally Routable Prefixes | All in VPC | All in VPC | All in VPC | All in VPC |
| Dynamic Route Priority | Automatically Set | Automatically Set | Automatically Set | Automatically Set |
| Password | None | None | None | None |
| AS Path Prepend | None | None | None | None |
| Advertised Communities | None | None | None | None |
Finally, we will want to configure the TORs to advertise a default route with the VRRP virtual IP as the next hop instead of their real IP. This is generally accomplished with a route map on most network infrastructure. When configuring BGP, it is no longer necessary to manually configure the Flow-Ext-NoNAT as the default next hop for the VPC.
With this added, new networks can be configured. Adding these addresses to the VPC’s Externally Routable IPs field will allow those addresses to be advertised to the physical network infrastructure.
2 - Enterprise Transit VPC Design
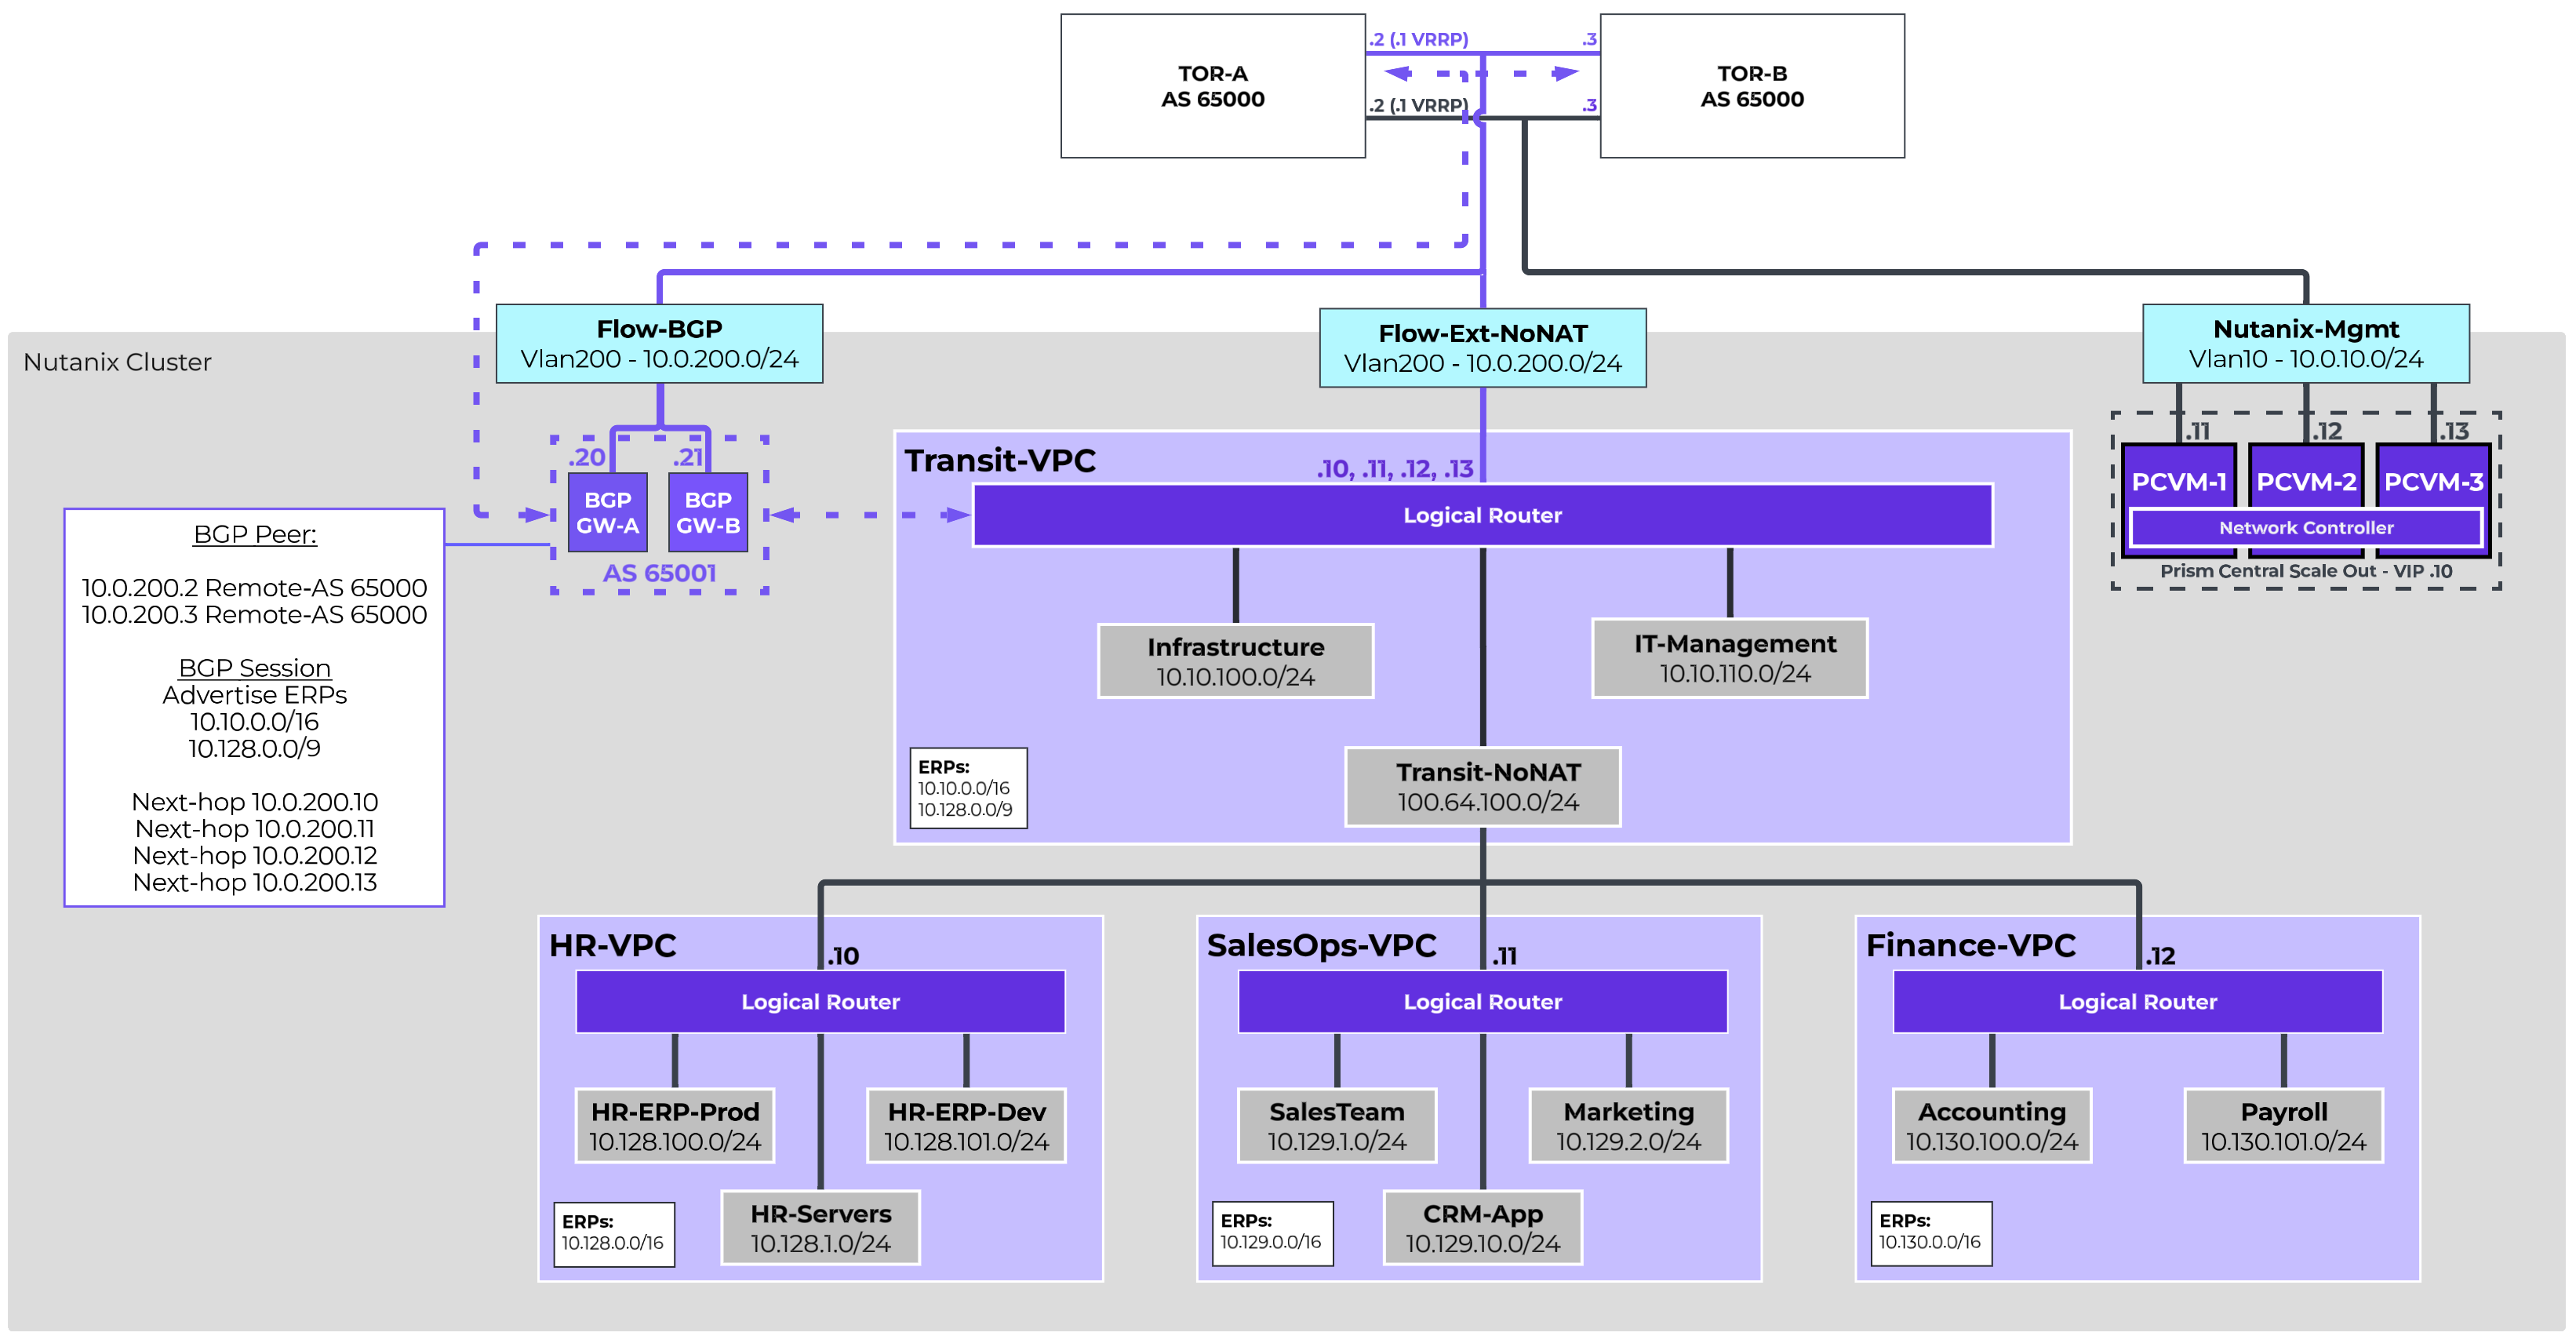
The Enterprise Transit VPC Design is a suitable starting point for larger organizations that want to provide dedicated network spaces for independent business units. This two-tier design utilizes a Transit VPC to provide centralized connectivity and services for multiple individually connected VPCs. In this design, a 10-node AHV cluster running NCI 7.5 is installed, and all nodes are connected to the same pair of switches.
VLAN-Backed Subnets
All resources in the environment will be allocated unique private IPs and should be directly addressable, so a Routed/NoNAT External Network will be sufficient. The 10.10.0.0/16 subnet is allocated for shared resources. 10.128.0.0/9 has been allocated for individual business unit environments, and individual /16s will be allocated for individual BU VPCs. Additionally, the network team requires that dynamic routing be utilized across the infrastructure, so BGP Gateways will be deployed to provide dynamic routing. We will configure two Subnets for VLAN200. One will be configured as the Routed External Network, and the other will allow the BGP Gateways to reside on the same network segment. To that end, the following VLAN-Backed Networks are configured:
| Name | Flow-Ext-NoNAT | Flow-BGP |
|---|---|---|
| VLAN ID | 200 | 200 |
| Virtual Switch | vs0 | vs0 |
| External Connectivity for VPCs | Enabled | Disabled |
| NAT | Disabled | N/A |
| IPAM | Nutanix IPAM | External IPAM |
| Network CIDR | 10.0.200.0/24 | 10.0.200.0/24 |
| Gateway | 10.0.200.1 | 10.0.200.1 |
| IP Pool | 10.0.200.10-10.0.200.19 | N/A |
Transit VPC
The Transit VPC will be configured leveraging the Flow-Ext-NoNAT as the only external network. There is no need to set the external network as the static default route as we will learn routing via BGP. The allocated address spaces will be configured as Externally Routable IP Prefixes.
| Name | Transit-VPC |
|---|---|
| Transit VPC | Yes |
| External Subnet: | Flow-Ext-NoNAT |
| Set this subnet as default next hop for outbound traffic | No |
| Destination Prefixes: | N/A |
| Router IP Assignment Mode: | Custom Defined Custom Router IP 10.0.200.10, 10.0.200.11, 10.0.200.12, 10.0.200.13 |
| External Gateway Configuration: Number of Active Hosts | 4 |
| Externally Routable IP Prefixes: | 10.10.0.0/16, 10.128.0.0/9 |
Like the basic VPC design, we want to deploy the BGP gateways on the same VLAN as the VPC external network. As an External Network cannot be connected directly to a VM, we will create a non-external instance of VLAN200 called Flow-BGP. Configure this additional VLAN with External IPAM to avoid address conflicts. We will deploy two BGP gateways for high availability in Additional Paths mode to simplify configuration. The following Network Gateways will be configured:
| Gateway Name | BGP-GW-A | BGP-GW-B |
|---|---|---|
| Gateway Attachment: | VLAN | VLAN |
| Subnet: | Flow-BGP | Flow-BGP |
| DNS Configuration: | Inherit from Cluster | Inherit from Cluster |
| NTP Configuration: | Inherit from Cluster | Inherit from Cluster |
| Gateway Service: | BGP | BGP |
| Serviced VPC: | Transit-VPC | Transit-VPC |
| BGP Path Advertisement Configuration: | Advertise Multiple Routes | Advertise Multiple Routes |
| Static IP Address: | 10.0.200.20/24 | 10.0.200.21/24 |
| Default Gateway: | 10.0.200.1 | 10.0.200.1 |
| eBGP ASN: | 65001 | 65001 |
Each of the TOR switches will be configured as a remote gateway, and both BGP gateways will be peered to both TOR switches. This will enable the BGP gateways to advertise the configured Externally Routable IP Prefixes to both TORs with all four router IPs advertised as an eligible, installable path. The following Remote Gateways will be configured:
| Name | TOR-A | TOR-B |
|---|---|---|
| Gateway Service: | BGP | BGP |
| Service IP Address: | 10.0.200.2 | 10.0.200.3 |
| eBGP ASN: | 65000 | 65000 |
The following BGP Sessions will be configured:
| Local Gateway | BGP-GW-A | BGP-GW-B | ||
|---|---|---|---|---|
| Remote Gateway: | TOR-A | TOR-B | TOR-A | TOR-B |
| Session Name: | GW-A-TOR-A | GW-A-TOR-B | GW-B-TOR-A | GW-B-TOR-B |
| Advertised Externally Routable Prefixes: | All in VPC | All in VPC | All in VPC | All in VPC |
| Dynamic Route Priority: | Automatically Set | Automatically Set | Automatically Set | Automatically Set |
| Password: | None | None | None | None |
| AS Path Prepend: | None | None | None | None |
| Advertised Communities: | None | None | None | None |
Finally, we will want to configure the TORs to advertise a default route with the VRRP virtual IP as the next hop instead of their real IP. This is generally accomplished with a route map on most network infrastructure. With this added, new networks can be configured, and adding those addresses to the Transit-VPC’s Externally Routable IPs field will cause those addresses to be advertised to the physical infrastructure.
Transit VPC Subnets
Infrastructure Services, like AD or Nutanix Files, as well as IT Management platforms, like monitoring and logging, are centrally hosted in the Transit VPC. Additionally, a single Overlay External Network will be configured to provide connectivity for connected VPCs. The 100.64.0.0 shared address space will be used for this. The following Subnets will be created in the Transit VPC:
| Name | Infrastructure | IT-Management | Transit-NoNAT |
|---|---|---|---|
| Subnet Type: | Overlay | Overlay | Overlay |
| VPC: | Transit-VPC | Transit-VPC | Transit-VPC |
| External Connectivity for VPCs: | No | No | Yes |
| NAT: | N/A | N/A | No |
| IPAM: | Nutanix IPAM | Nutanix IPAM | Nutanix IPAM |
| Network CIDR: | 10.10.100.0/24 | 10.10.110.0/24 | 100.64.100.0/24 |
| Gateway: | 10.10.100.1 | 10.10.110.1 | 100.64.100.1 |
| IP Pool: | 10.10.100.100-199 | 10.10.110.100-199 | 100.64.100.10-254 |
Connected Business Unit VPCs
Each individual business unit will be assigned a VPC with a /16 supernet allocated for use for VPC Overlay Networks. Each VPC will leverage the Transit-NoNAT Overlay External Network. This VPC layout also enables easy integration with Flow Network Security, allowing security to be defined at the business unit level as well as the network or VM level.
Three VPCs are defined in this design, but additional VPCs can be configured. The number of VPCs able to connect to a single Transit is determined by the deployed Prism Central size.
For each connected VPC, the defined Externally Routable IP Prefixes will cause static routes to be created in the Transit VPC for each prefix with the connected VPC’s Router IP as the next hop.
The following VPCs will be configured:
| Name | HR-VPC | SalesOps-VPC | Finance-VPC |
|---|---|---|---|
| Transit VPC: | No | No | No |
| External Subnet: | Transit-NoNAT | Transit-NoNAT | Transit-NoNAT |
| Set this subnet as default next hop for outbound traffic: | Yes | Yes | Yes |
| Destination Prefixes: | 0.0.0.0/0 | 0.0.0.0/0 | 0.0.0.0/0 |
| Router IP Assignment Mode: | Custom Defined | Custom Defined | Custom Defined |
| Custom Router IP: | 100.64.100.10 | 100.64.100.11 | 100.64.100.12 |
| Externally Routable IP Prefixes: | 10.128.0.0/16 | 10.129.0.0/16 | 10.130.0.0/16 |
VPC Overlay Subnets
Each VPC will then be configured with Overlay Subnets within their allocated supernet, allowing resources to be deployed and logically segmented according to business requirements.
HR-VPC Overlay Subnets
The Human Resources VPC houses an HR ERP system, with both production and development/testing environments. Additionally, HR has their own dedicated file servers with confidential employee data, as well as other HR-specific systems. The following networks are created to support those needs.
| Name | HR-Servers | HR-ERP-Prod | HR-ERP-Dev |
|---|---|---|---|
| Subnet Type: | Overlay | Overlay | Overlay |
| VPC: | HR-VPC | HR-VPC | HR-VPC |
| IPAM: | Nutanix IPAM | Nutanix IPAM | Nutanix IPAM |
| Network CIDR: | 10.128.1.0/24 | 10.128.100.0/24 | 10.128.101.0/24 |
| Gateway: | 10.128.1.1 | 10.128.100.1 | 10.128.101.1 |
| IP Pool: | 10.128.1.100-199 | 10.128.100.100-199 | 10.128.101.100-199 |
SalesOps-VPC Overlay Subnets
The Sales Operation VPC houses the Sales and Marketing teams, as well as a CRM system used jointly by both teams. The following networks are created to support those needs.
| Name | Sales | Marketing | CRM-App |
|---|---|---|---|
| Subnet Type: | Overlay | Overlay | Overlay |
| VPC: | SalesOps-VPC | SalesOps-VPC | SalesOps-VPC |
| IPAM: | Nutanix IPAM | Nutanix IPAM | Nutanix IPAM |
| Network CIDR: | 10.129.1.0/24 | 10.129.2.0/24 | 10.129.10.0/24 |
| Gateway: | 10.129.1.1 | 10.129.2.1 | 10.129.10.1 |
| IP Pool: | 10.129.1.100-199 | 10.129.2.100-199 | 10.129.10.100-199 |
Finance-VPC Overlay Subnets
The Finance VPC houses the Accounting and Payroll teams.
| Name | Accounting | Payroll |
|---|---|---|
| Subnet Type: | Overlay | Overlay |
| VPC: | HR-VPC | HR-VPC |
| IPAM: | Nutanix IPAM | Nutanix IPAM |
| Network CIDR: | 10.130.100.0/24 | 10.130.101.0/24 |
| Gateway: | 10.130.100.1 | 10.130.101.1 |
| IP Pool: | 10.130.100.100-199 | 10.130.101.100-199 |
3 - Software as a Service Provider with Development Environments
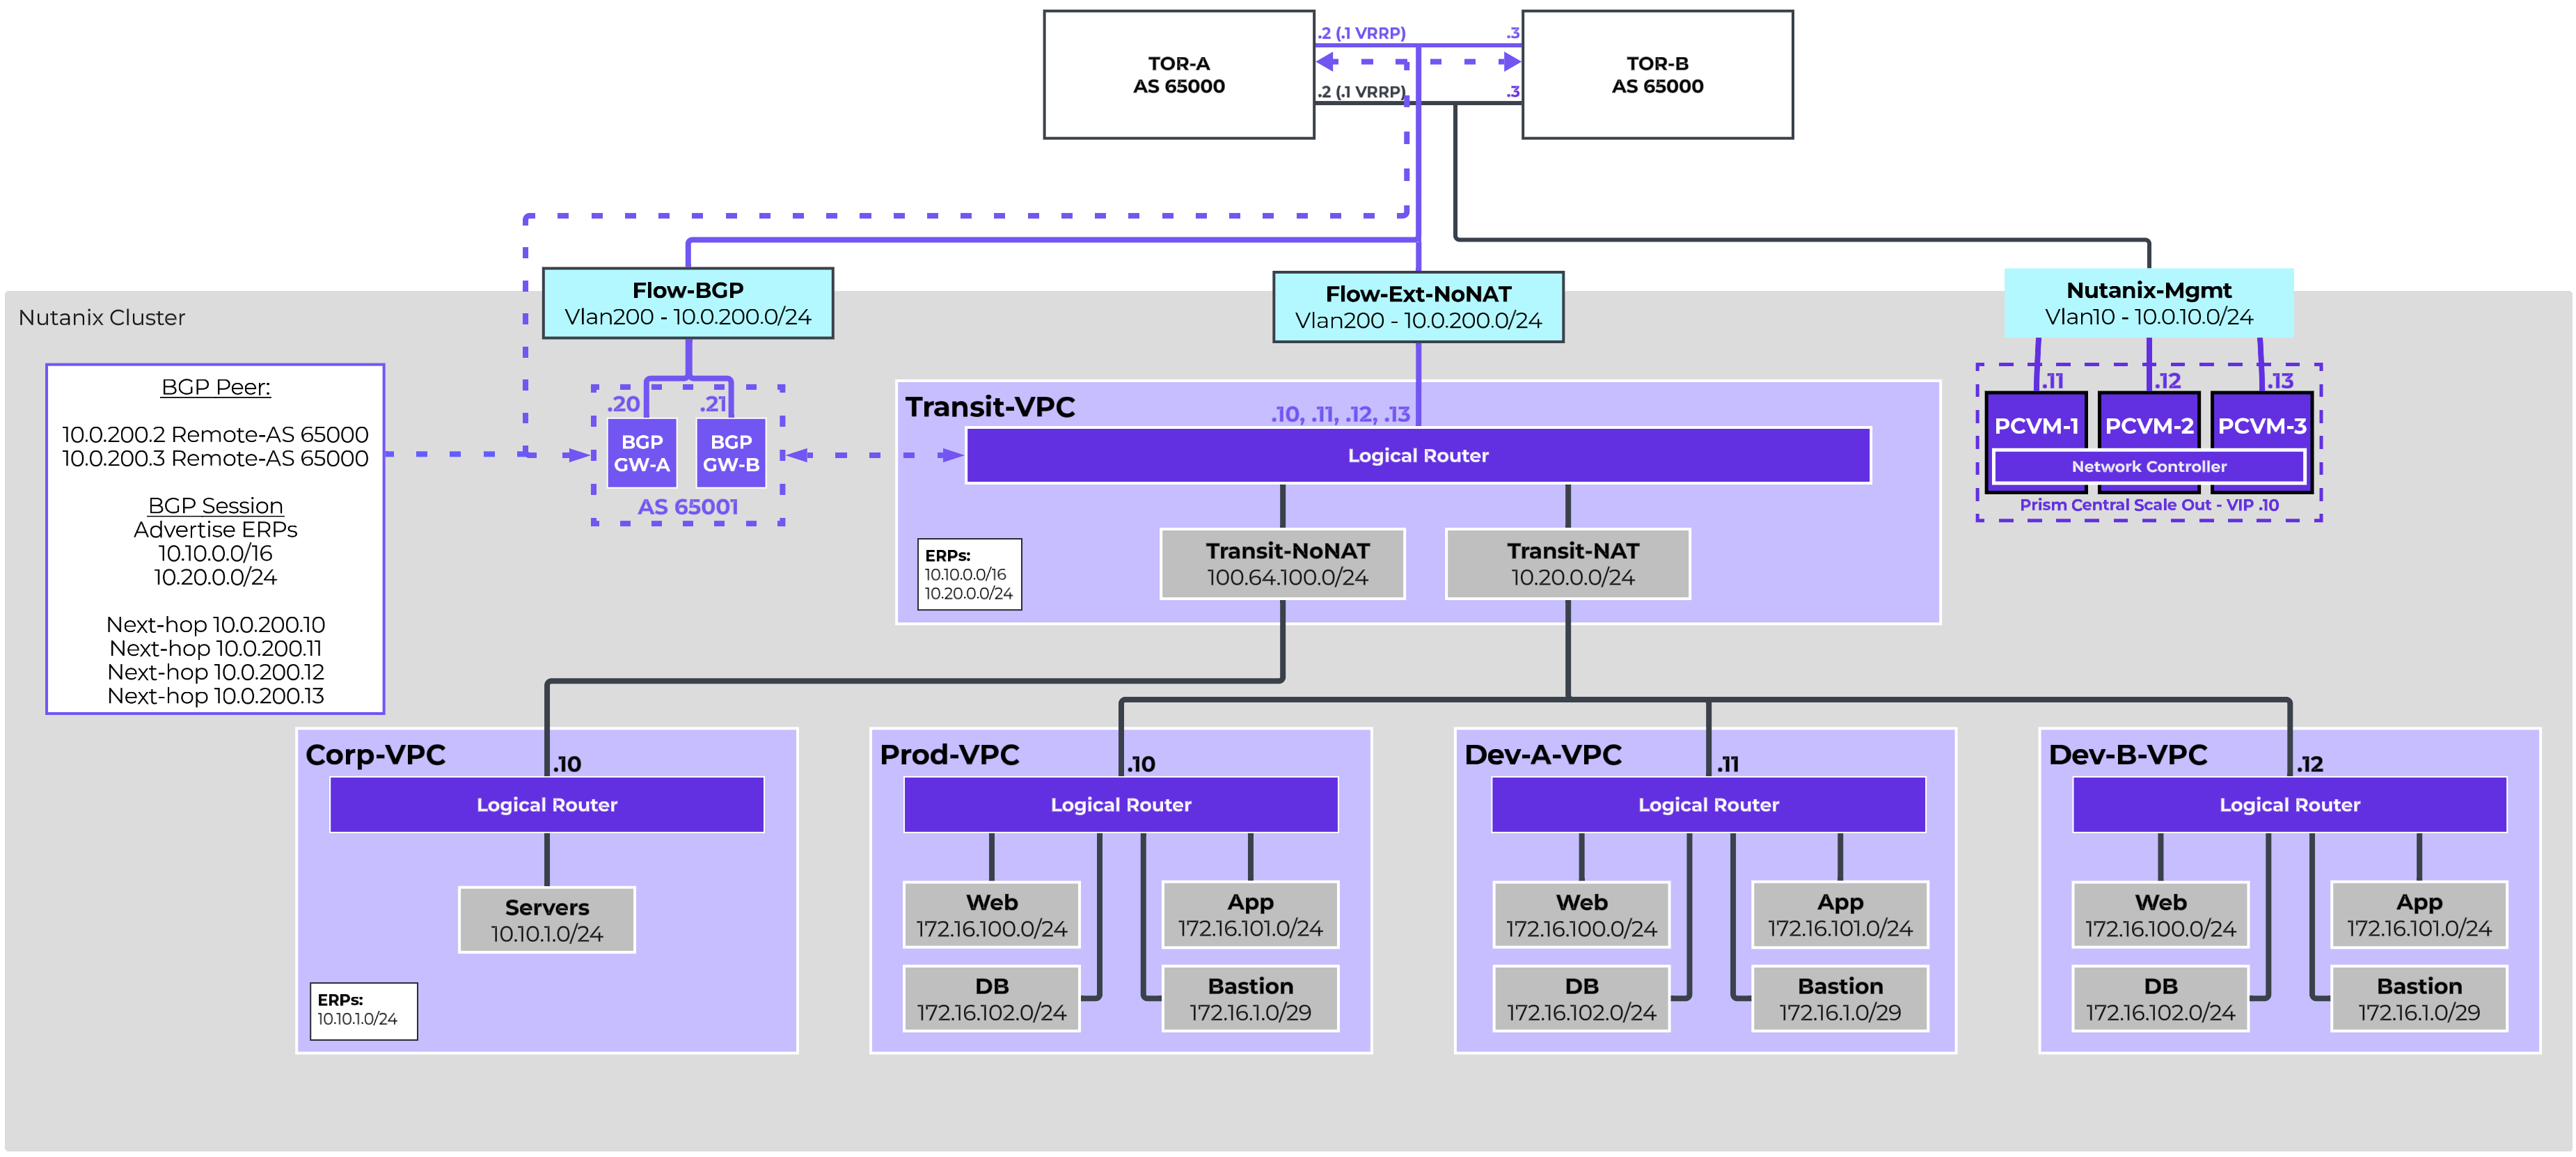
The Software as a Service Transit VPC Design is an example of how Flow Virtual Networking can simplify operations for a growing SaaS team looking for agility and security. This two-tier design utilizes a Transit VPC to provide centralized connectivity and services for multiple individually connected VPCs. Corporate resources are directly routable, while production and development environments are deployed using private repeated addressing.
VLAN-Backed Subnets
The Corp-VPC will be directly routable, with the 10.10.0.0/16 address space allocated, so we will configure a NoNAT VLAN-backed External Network for our Transit VPC.
The Prod-VPC and individual Dev-VPCs will not be directly routable, and in fact will all have overlapping addressing. However, this can be accomplished within the Transit VPC, so we do not need to configure a NAT VLAN-Backed External Network.
Additionally, the network team requires that dynamic routing be utilized across the infrastructure, so BGP Gateways will be deployed to provide dynamic routing. We will configure two Subnets for VLAN200. One will be configured as the Routed External Network, and the other will allow the BGP Gateways to reside on the same network segment. To that end, the following VLAN-Backed Networks are configured:
| Name | Flow-Ext-NoNAT | Flow-BGP |
|---|---|---|
| VLAN ID: | 200 | 200 |
| Virtual Switch: | vs0 | vs0 |
| External Connectivity for VPCs: | Enabled | Disabled |
| NAT: | Disabled | N/A |
| IPAM: | Nutanix IPAM | External IPAM |
| Network CIDR: | 10.0.200.0/24 | 10.0.200.0/24 |
| Gateway: | 10.0.200.1 | 10.0.200.1 |
| IP Pool: | 10.0.200.10-10.0.200.19 | N/A |
Transit VPC
The Transit VPC will be configured leveraging the Flow-Ext-NoNAT as the only external network. There is no need to set the external network as the static default route as we will learn routing via BGP. We will utilize 10.20.0.0/24 as a NAT pool for resources in connected VPCs, and thus we want to ensure that NAT range itself is considered externally routable, so we will define it as an Externally Routable IP Prefix along with the 10.10.0.0/16 that has been allocated for corporate resources.
| Name | Transit-VPC |
|---|---|
| Transit VPC: | Yes |
| External Subnet: | Flow-Ext-NoNAT |
| Set this subnet as default next hop for outbound traffic: | No |
| Destination Prefixes: | N/A |
| Router IP Assignment Mode: | Custom Defined |
| Custom Router IP: | 10.0.200.10, 10.0.200.11, 10.0.200.12, 10.0.200.13 |
| External Gateway Configuration: Number of Active Hosts | 4 |
| Externally Routable IP Prefixes: | 10.10.0.0/16, 10.20.0.0/24 |
Dynamic Routing
For simplicity, we want to deploy the BGP gateways on the same VLAN as the VPC external network. As an External Network cannot be connected directly to a VM, we will create a non-external instance of VLAN200 called Flow-BGP. Configure this additional VLAN with External IPAM to avoid address conflicts. We will deploy two BGP gateways for high availability in Additional Paths mode to simplify configuration. The following Network Gateways will be configured:
| Gateway Name | BGP-GW-A | BGP-GW-B |
|---|---|---|
| Gateway Attachment: | VLAN | VLAN |
| Subnet: | Flow-BGP | Flow-BGP |
| DNS Configuration: | Inherit from Cluster | Inherit from Cluster |
| NTP Configuration: | Inherit from Cluster | Inherit from Cluster |
| Gateway Service: | BGP | BGP |
| Serviced VPC: | Transit-VPC | Transit-VPC |
| BGP Path Advertisement Configuration: | Advertise Multiple Routes | Advertise Multiple Routes |
| Static IP Address: | 10.0.200.20/24 | 10.0.200.21/24 |
| Default Gateway: | 10.0.200.1 | 10.0.200.1 |
| eBGP ASN: | 65001 | 65001 |
Each of the TOR switches will be configured as a remote gateway, and both BGP gateways will be peered to both TOR switches. This will enable the BGP gateways to advertise the configured Externally Routable IP Prefixes to both TORs with all four router IPs advertised as an eligible, installable path. The following Remote Gateways will be configured:
| Name | TOR-A | TOR-B |
|---|---|---|
| Gateway Service: | BGP | BGP |
| Service IP Address: | 10.0.200.2 | 10.0.200.3 |
| eBGP ASN: | 65001 | 65001 |
The following BGP Sessions will be configured:
| Local Gateway | BGP-GW-A | BGP-GW-A | BGP-GW-B | BGP-GW-B |
|---|---|---|---|---|
| Remote Gateway: | TOR-A | TOR-B | TOR-A | TOR-B |
| Session Name: | GW-A-TOR-A | GW-A-TOR-B | GW-B-TOR-A | GW-B-TOR-B |
| Advertised Externally Routable Prefixes: | All in VPC | All in VPC | All in VPC | All in VPC |
| Dynamic Route Priority: | Automatically Set | Automatically Set | Automatically Set | Automatically Set |
| Password: | None | None | None | None |
| AS Path Prepend: | None | None | None | None |
| Advertised Communities: | None | None | None | None |
Finally, we will want to configure the TORs to advertise a default route with the VRRP virtual IP as the next hop instead of their real IP. This is generally accomplished with a route map on most network infrastructure. With this added, new networks can be configured, and adding those addresses to the Transit-VPC’s Externally Routable IPs field will cause those addresses to be advertised to the physical infrastructure.
Transit VPC Subnets
In this particular environment, there are no shared resources to deploy in the Transit. As such, we will only be configuring External Networks to provide connectivity to the connected VPC. Our NAT External Network will use the 10.20.0.0/24 address space, which will be advertised as routable and reachable by the Transit VPC’s BGP Gateways.
| Name | Transit-NAT | Transit-NoNAT |
|---|---|---|
| Subnet Type: | Overlay | Overlay |
| VPC: | Transit-VPC | Transit-VPC |
| External Connectivity for VPCs: | Yes | Yes |
| NAT: | Yes | No |
| IPAM: | Nutanix IPAM | Nutanix IPAM |
| Network CIDR: | 10.20.0.0/24 | 100.64.100.0/24 |
| Gateway: | 10.20.0.1 | 100.64.100.1 |
| IP Pool: | 10.20.0.10-254 | 100.64.100.10-254 |
Connected VPCs
VPCs will be created for Corporate resources, the Production environment, and individual Developer environments. This VPC is intended to be directly reachable, and will use the Transit-NoNAT External Network. The defined Externally Routable IP Prefixes will cause static routes to be created in the Transit VPC for each prefix with the connected VPC’s Router IP as the next hop.
The Production Environment and the Developer Environments will leverage identical IP addressing to ensure consistency across environments. However, they will each only have NAT Connectivity, helping to prevent accidental cross-communication. Floating IPs will be assigned to Network Load Balancer instances in each VPC that will be configured to balance HTTP and HTTPS traffic across the Web Servers.
Within the production and development environments, Bastion networks will be deployed to host jump servers. A Floating IP will be assigned to the Bastion host, allowing an entry point for management, monitoring, administration and development. There will be no direct inbound connectivity to the Web, App, or DB servers.
This design demonstrates a single production environment. However, additional VPCs can be created easily, with the number of VPCs dictated by the Prism Central sizing.
The following VPCs will be configured:
| Name | Corp-VPC | Prod-VPC | Dev-A-VPC | Dev-B-VPC |
|---|---|---|---|---|
| Transit VPC: | No | No | No | No |
| External Subnet: | Transit-NoNAT | Transit-NAT | Transit-NAT | Transit-NAT |
| Set this subnet as default next hop for outbound traffic: | Yes | Yes | Yes | Yes |
| Destination Prefixes: | 0.0.0.0/0 | 0.0.0.0/0 | 0.0.0.0/0 | 0.0.0.0/0 |
| Router IP Assignment Mode: | Custom Defined | Custom Defined | Custom Defined | Custom Defined |
| Custom Router IP: | 100.64.100.10 | 10.20.0.10 | 10.20.0.11 | 10.20.0.12 |
| Externally Routable IP Prefixes: | 10.10.0.0/16 | None | None | None |
Corp-VPC
The Corp-VPC holds corporate servers. Additional networks can be configured as needed for logical segmentation, but our initial design only requires a single server network.
| Name | Servers |
|---|---|
| Subnet Type: | Overlay |
| VPC: | Corp-VPC |
| IPAM: | Nutanix IPAM |
| Network CIDR: | 10.10.1.0/24 |
| Gateway: | 10.10.1.1 |
| IP Pool: | 10.10.1.100-199 |
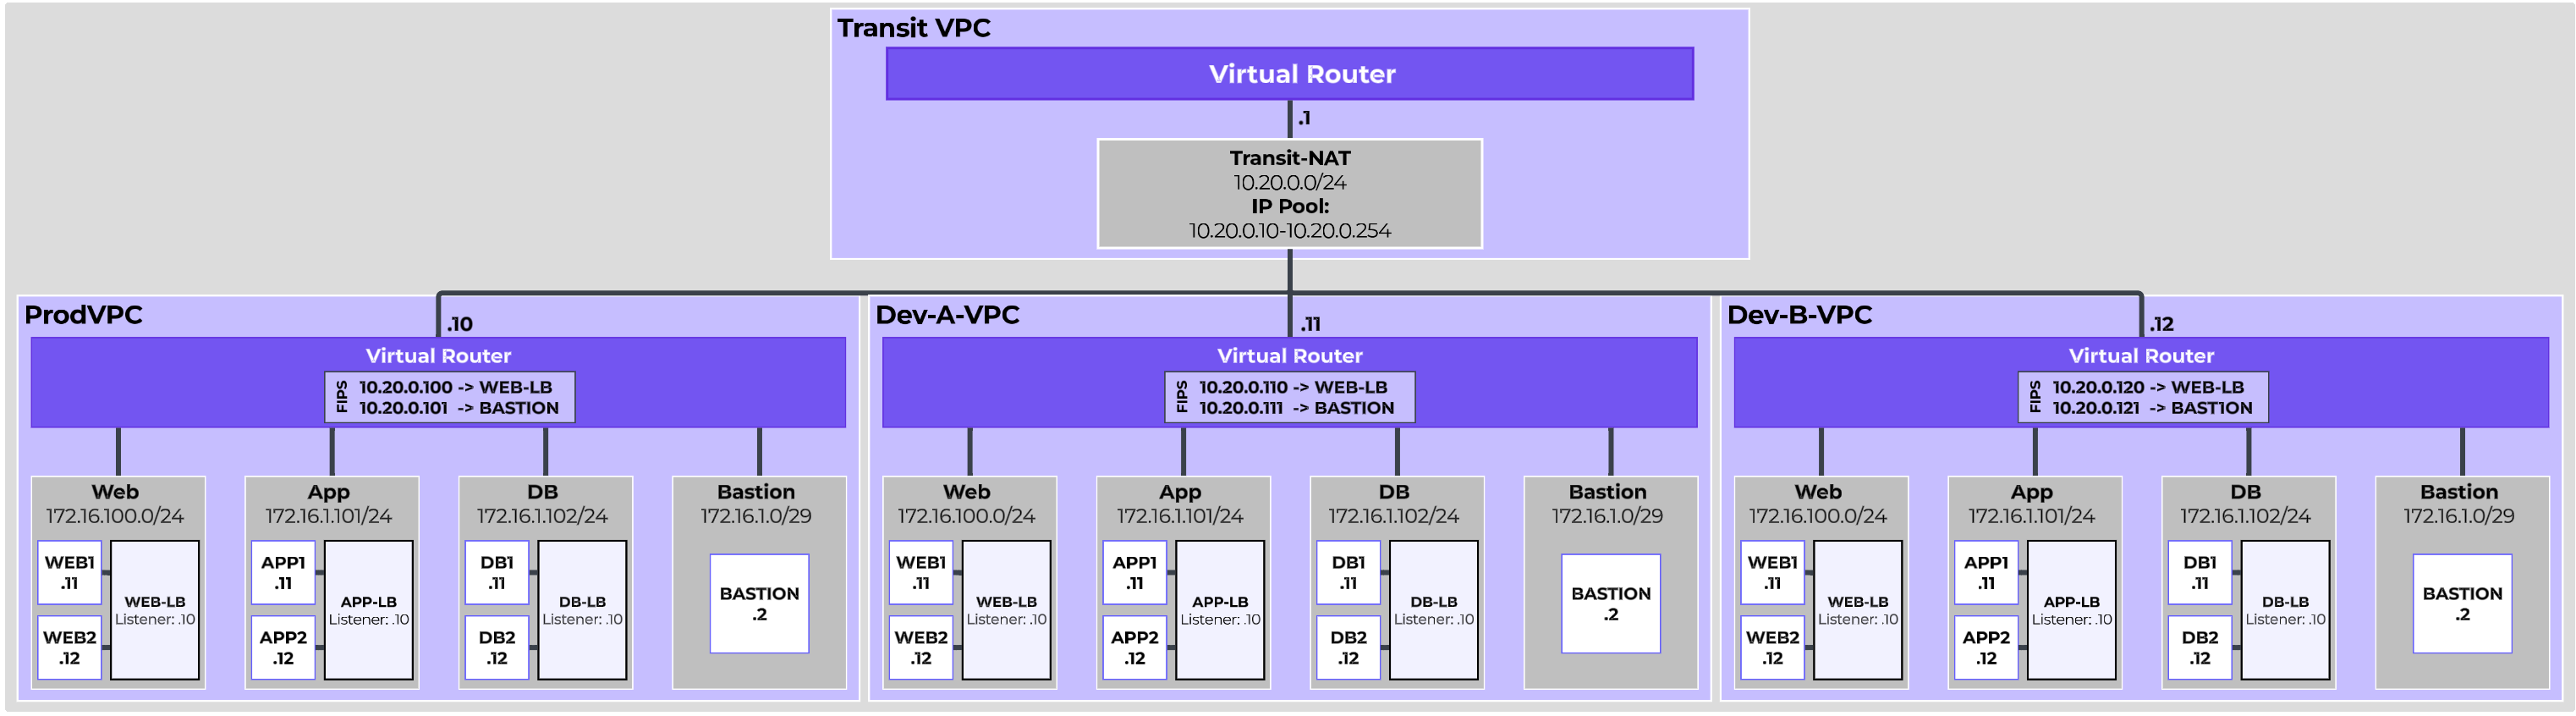
The Production and Development VPCs represent instances of the SaaS application, and will all have four identically configured subnets for ensuring consistency between dev and prod.The first three are for the Web, App, and DB servers for the application. The Bastion network is a small network for a jump server for administrative access, monitoring, and software deployment and distribution.
The subnets will be duplicated across multiple VPCs and look like this:
| Name | Web | App | DB | Bastion |
|---|---|---|---|---|
| Subnet Type: | Overlay | Overlay | Overlay | Overlay |
| VPC: | Multiple | Multiple | Multiple | Multiple |
| IPAM: | Nutanix IPAM | Nutanix IPAM | Nutanix IPAM | Nutanix IPAM |
| Network CIDR: | 172.16.100.0/24 | 172.16.101.0/24 | 172.16.102.0/24 | 172.16.1.0/29 |
| Gateway: | 172.16.100.1 | 172.16.101.1 | 172.16.102.1 | 172.16.1.1 |
| IP Pool: | 10.129.1.100-199 | 10.129.2.100-199 | 10.129.10.100-199 | 172.16.1.2-6 |
Each VPC will begin with two web servers, two app servers, two database servers, and a bastion host. Additionally, VPC Network Load Balancers will be deployed for all three tiers of the application. The Web Load Balancer will be assigned a Floating IP, allowing the Web Application to be accessible externally. The bastion host will also be assigned a Floating IP for external access. Naming for all resources will be prefixed to match the VPC. That is, Prod-VPC resources will be prefixed with ‘Prod-’.
The following Floating IPs will be allocated and assigned:
| External Subnet | Transit-NAT | Transit-NAT | Transit-NAT | Transit-NAT | Transit-NAT | Transit-NAT |
|---|---|---|---|---|---|---|
| Floating IP: | 10.20.0.100 | 10.20.0.101 | 10.20.0.110 | 10.20.0.111 | 10.20.0.120 | 10.20.0.121 |
| Assigned To: | Prod-Web-LB* | Prod-Bastion | Dev-A-Web-LB* | Dev-A-Bastion | Dev-B-Web-LB* | Dev-B-Bastion |
* Load balancer Floating IPs are pre-allocated and assigned during creation of the Load Balancer Session.
Network Load Balancer
Network Load Balancers will be configured identically in each VPC. The Web NLBs will be assigned Floating IPs for external reachability. The App and DB NLBs are only accessible within the VPC and therefore will not be assigned Floating IPs. The Network Load Balancers will be configured as follows:
| Name | <Prefix>-Web-LB | <Prefix>-App-LB | <Prefix>-DB-LB |
|---|---|---|---|
| Listener | |||
| Protocol | TCP | TCP | TCP |
| Port | 443 | 8080 | 3306 |
| Subnet | <Prefix>-Web | <Prefix>-App | <Prefix>-DB |
| Primary Assignment Type | Provide Static IP | Provide Static IP | Provide Static IP |
| IP Address | 172.16.100.10 | 172.16.101.10 | 172.16.102.10 |
| Floating IP | See Above | None | None |
| Targets | |||
| VM NIC Selection Method | Select VM NICs Individually | Select VM NICs Individually | Select VM NICs Individually |
| Target VM NICs | <Prefix>-Web1/2 | <Prefix>-App1/2 | <Prefix>-DB1/2 |
| Health Check | |||
| Check Run Every | 5 Seconds | 5 Seconds | 5 Seconds |
| Time Out After | 2 Seconds | 2 Seconds | 2 Seconds |
| Marked Health After | 3 Consecutive Successes | 3 Consecutive Successes | 3 Consecutive Successes |
| Marked Unhealthy After | 3 Consecutive Failures | 3 Consecutive Failures | 3 Consecutive Failures |
4 - Managed Service Provider Design
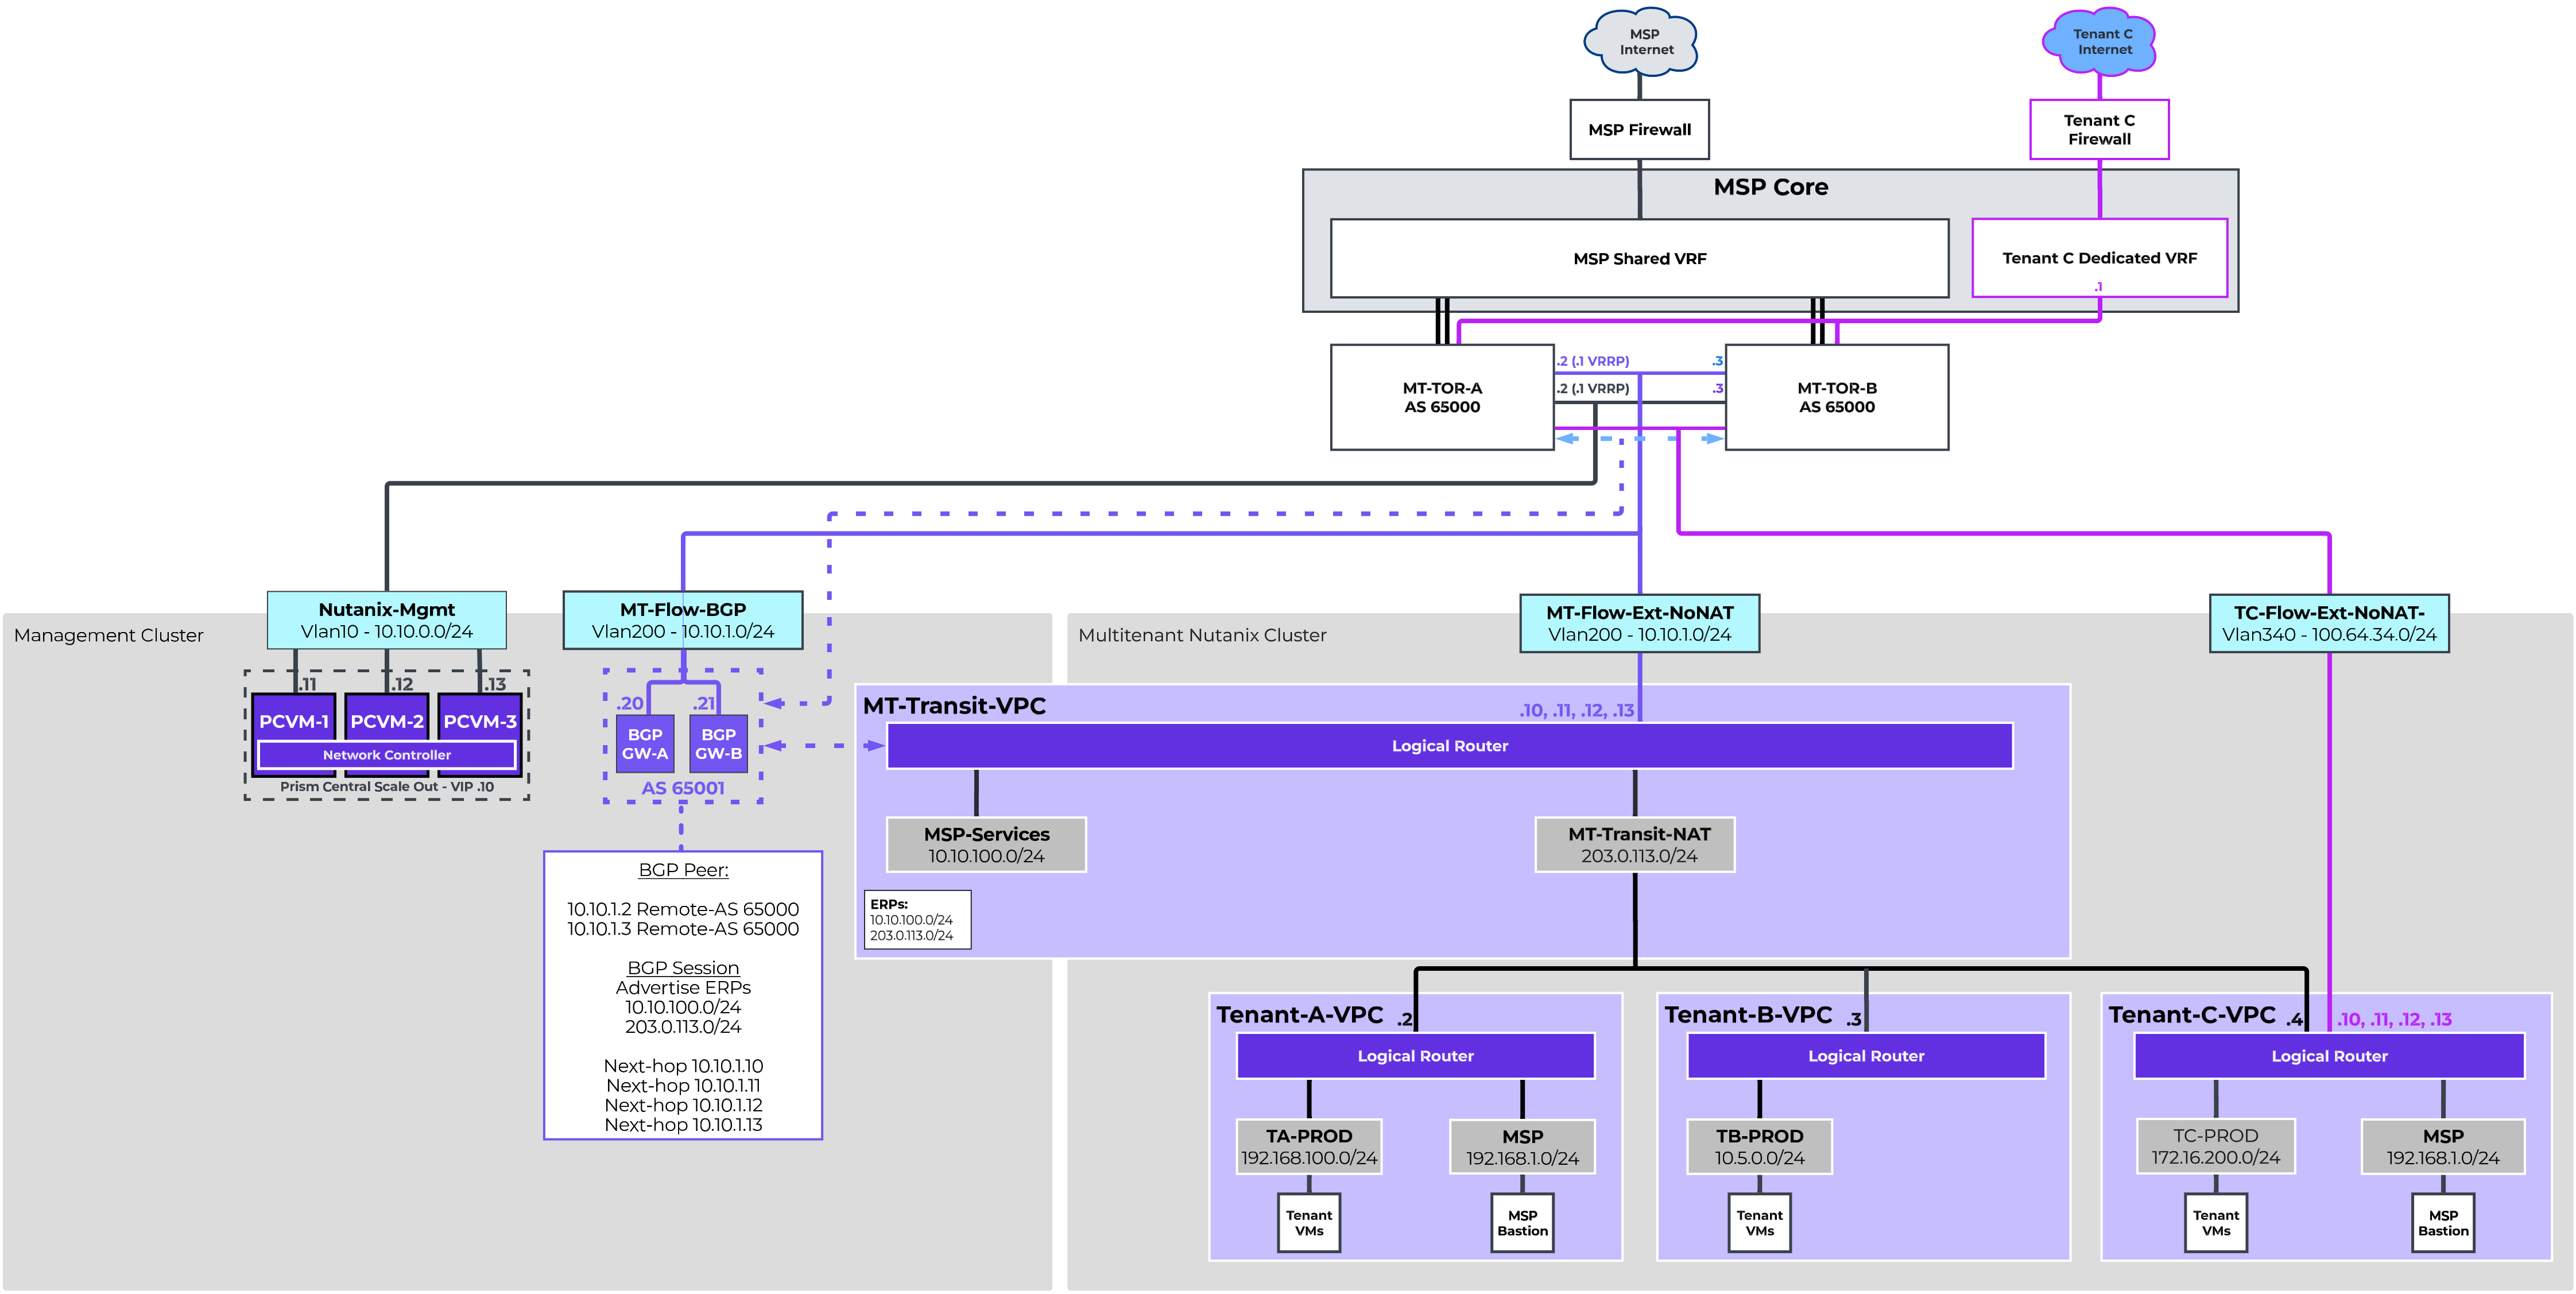
The Managed Service Provider Reference Architecture provides an example of how Flow Virtual Networking can provide isolated tenant networking within a shared provider environment, with the flexibility of both shared and dedicated connectivity deployment models.
This design includes two distinct clusters. A smaller management cluster hosts Prism Central and other provider management infrastructure. Client workloads are able to be distributed across one or more larger multitenant clusters.
A Transit VPC provides a centralized north/south NAT connectivity for tenants without their own dedicated connectivity. It also provides a connection point for access to optional MSP services, delivered via MSP bastion hosts. Tenants with their own dedicated connectivity can be provided dedicated External Networks. VRFs are an option to provide the network isolation for this dedicated connectivity on the physical network infrastructure.
VLAN-Backed Subnets
All VLAN backed connectivity will be routed. An External Network will be configured on the multitenant cluster to provide connectivity to the shared Transit VPC. An additional Subnet will be configured with the same VLAN ID on the management cluster for BGP Gateways. While NAT does need to happen for the shared connectivity, that will be handled in the Transit VPC via Overlay. In the example, While Tenants A and B will be utilizing the shared connectivity, Tenant C will be utilizing dedicated connectivity. We will therefore need to configure an additional external network dedicated to Tenant C. Tenant C has opted to use the shared network space for its NoNAT external network.
| Name | MT-Flow-Ext-NoNAT | MT-Flow-BGP | TC-Flow-Ext-NoNAT |
|---|---|---|---|
| VLAN ID: | 200 | 200 | 340 |
| Virtual Switch: | vs0 - Multitenant Cluster | vs0 - Mgmt Cluster | vs0 - Multitenant Cluster |
| External Connectivity for VPCs: | Enabled | Disabled | Enabled |
| NAT: | Disabled | N/A | Disabled |
| IPAM: | Nutanix IPAM | External IPAM | Nutanix IPAM |
| Network CIDR: | 10.10.1.0/24 | N/A | 100.64.34.0/24 |
| Gateway: | 10.10.1.1 | N/A | 100.64.34.1 |
| IP Pool: | 10.10.1.10-100 | N/A | 100.64.34.10-19 |
Shared Transit VPC
The Shared Transit VPC provides centralized north/south NAT connectivity as well as hosts shared resources for managing and monitoring the environment. It will be configured leveraging the Flow-Ext-NoNAT-MT as the only external network. There is no need to set the external network as the static default route as we will learn routing via BGP.
The MSP has allocated a block of Public IPs, 203.0.113.0/24, to be provided to clients as external SNAT IPs and Floating IPs. Thus we want to ensure that NAT range itself is considered externally routable, so we will define it as an Externally Routable IP Prefix along with the 10.10.100.0/24 that has been allocated for MSP Management resources.
| Name | MT-Transit-VPC |
|---|---|
| Transit VPC: | Yes |
| External Subnet: | MT-Flow-Ext-NoNAT |
| Set this subnet as default next hop for outbound traffic: | No |
| Destination Prefixes: | N/A |
| Router IP Assignment Mode: | Custom Defined |
| Custom Router IP: | 10.10.1.10, 10.10.1.11, 10.10.1.12, 10.10.1.13 |
| External Gateway Configuration: Number of Active Hosts | 4 |
| Externally Routable IP Prefixes: | 10.10.100.0/24, 203.0.113.0/24 |
Dynamic Routing
Like the other VPC design examples, we want to deploy the BGP gateways on the same VLAN as the VPC external network. As we want to house the BGP gateways on the Management Cluster, the Flow-BGP-MT subnet was built on the management cluster’s vs0. Configure this additional VLAN with External IPAM to avoid address conflicts. We will deploy two BGP gateways for high availability in Additional Paths mode to simplify configuration. The following Network Gateways will be configured:
| Gateway Name | BGP-GW-A | BGP-GW-B |
|---|---|---|
| Gateway Attachment: | VLAN | VLAN |
| Cluster: | Management | Management |
| Subnet: | MT-Flow-BGP | MT-Flow-BGP |
| DNS Configuration: | Inherit from Cluster | Inherit from Cluster |
| NTP Configuration: | Inherit from Cluster | Inherit from Cluster |
| Gateway Service: | BGP | BGP |
| Serviced VPC: | MT-Transit-VPC | MT-Transit-VPC |
| BGP Path Advertisement Configuration: | Advertise Multiple Routes | Advertise Multiple Routes |
| Static IP Address: | 10.10.1.20/24 | 10.10.1.21/24 |
| Default Gateway: | 10.10.1.1 | 10.10.1.1 |
| eBGP ASN: | 65001 | 65001 |
Each of the TOR switches will be configured as a remote gateway, and both BGP gateways will be peered to both TOR switches. This will enable the BGP gateways to advertise the configured Externally Routable IP Prefixes to both TORs with all four router IPs advertised as an eligible, installable path. The following Remote Gateways will be configured:
| Name | TOR-A | TOR-B |
|---|---|---|
| Gateway Service: | BGP | BGP |
| Service IP Address: | 10.10.1.2 | 10.10.1.3 |
| eBGP ASN: | 65000 | 65000 |
The following BGP Sessions will be configured:
| Local Gateway | BGP-GW-A | BGP-GW-B | ||
|---|---|---|---|---|
| Remote Gateway: | TOR-A | TOR-B | TOR-A | TOR-B |
| Session Name: | GW-A-TOR-A | GW-A-TOR-B | GW-B-TOR-A | GW-B-TOR-B |
| Advertised Externally Routable Prefixes: | All in VPC | All in VPC | All in VPC | All in VPC |
| Dynamic Route Priority: | Automatically Set | Automatically Set | Automatically Set | Automatically Set |
| Password: | None | None | None | None |
| AS Path Prepend: | None | None | None | None |
| Advertised Communities: | None | None | None | None |
Finally, we will want to configure the TORs to advertise a default route with the VRRP virtual IP as the next hop instead of their real IP. This is generally accomplished with a route map on most network infrastructure. With this added, new networks can be configured, and adding those addresses to the MT-Transit-VPC’s Externally Routable IPs field will cause those addresses to be advertised to the physical infrastructure.
Transit VPC Subnets
The MSP has management and monitoring resources deployed in the Transit, so an MSP-Management network will be configured. Flow Network Security policies can be configured to secure access to/from these resources as needed.
A NAT Overlay External Network will be configured. The public IP block 203.0.113.0/24 has been assigned for this purpose. This NAT Overlay Network will primarily be used to provide access to shared ISP connectivity, but it also serves as an entry point for MSP Management access. Floating IPs can be assigned to tenant workloads for external access as needed. Floating IPs will also be assigned to MSP management Bastion hosts to provide access.
| Name | MSP-Management | MT-Transit-NAT |
|---|---|---|
| Subnet Type: | Overlay | Overlay |
| VPC: | MT-Transit-VPC | MT-Transit-VPC |
| External Connectivity for VPCs: | No | Yes |
| NAT: | N/A | Yes |
| IPAM: | Nutanix IPAM | Nutanix IPAM |
| Network CIDR: | 10.10.100.0/24 | 203.0.113.0/24 |
| Gateway: | 10.10.100.1 | 203.0.113.1 |
| IP Pool: | 10.10.100.100-199 | 203.0.113.2-254 |
Tenant VPCs
Tenant VPCs will provide isolated network spaces for each tenant. Tenants have the option to leverage shared MSP connectivity or dedicated connectivity.
Tenants that purchase MSP services that require the MSP be able to monitor and manage Tenant VMs directly will have a MSP Bastion VM put on an MSP network in their VPC, and a Floating IP will be assigned to the Bastion VM.
Tenant VPCs that leverage dedicated connectivity can also connect to the Transit VPC for access to MSP management resources, and Tenant C is configured in this manner. VPC Network Policies are configured to policy route the Bastion VM through the NAT External Network. Tenant C has procured their own ISP connection and firewalls. A VRF is provisioned on the MSP network infrastructure to support this dedicated, isolated connectivity. Tenant C will not be leveraging dynamic routing. Static routes will be provisioned in their dedicated VRF as needed, and their VPC will be configured with a static default route.
In our design, the following VPCs will be configured.
| Name | Tenant-A-VPC | Tenant-B-VPC | Tenant-C | Tenant-C |
|---|---|---|---|---|
| Transit VPC: | No | No | No | No |
| External Subnet: | MT-Transit-NAT | MT-Transit-NAT | MT-Transit-NAT | TC-Flow-Ext-NoNAT |
| Set this subnet as default next hop for outbound traffic: | Yes | Yes | No | Yes |
| Destination Prefixes: | 0.0.0.0/0 | 0.0.0.0/0 | 0.0.0.0/0 | |
| Router IP Assignment Mode: | Auto-Assigned | Auto-Assigned | Auto-Assigned | Custom Defined |
| Custom Router IP: | N/A | N/A | N/A | 100.64.34.10,11,12,13 |
| Externally Routable IP Prefixes: | None | None | None | 172.16.200.0/24 |
Tenant A - Shared Connectivity & Management Services
Tenant A leverages shared connectivity via MT-Transit-VPC and also subscribes to management services. The following overlay subnets will be configured for Tenant A.
| Name | TA-Prod | MSP |
|---|---|---|
| Subnet Type: | Overlay | Overlay |
| VPC: | Tenant-A-VPC | Tenant-A-VPC |
| IPAM: | Nutanix IPAM | Nutanix IPAM |
| Network CIDR: | 192.168.100.0/24 | 192.168.1.0/24 |
| Gateway: | 192.168.100.1 | 192.168.1.1 |
| IP Pool: | 192.168.100.100-199 | 192.168.1.100-199 |
An MSP Bastion VM will be deployed in the MSP network, and a Floating IP will be allocated from MT-Transit-NAT’s IP Pool. VPC Network Policies and/or Flow Network Security can be used to limit the traffic allowed to/from the MSP Bastion VM.
Tenant B - Shared Connectivity Only
Tenant B leverages shared connectivity via MT-Transit-VPC, but does not subscribe to any management services. The following overlay subnet will be configured for Tenant B.
| Name | TB-PROD |
|---|---|
| Subnet Type: | Overlay |
| VPC: | Tenant-B-VPC |
| IPAM: | Nutanix IPAM |
| Network CIDR: | 10.5.0.0/24 |
| Gateway: | 10.5.0.1 |
| IP Pool: | 10.5.0.2-254 |
Tenant C - Dedicated Connectivity & Management Services
Tenant C has purchased dedicated connectivity, and also subscribes to MSP Management services. The following overlay subnets will be configured for Tenant C.
| Name | TC-PROD | MSP |
|---|---|---|
| Subnet Type: | Overlay | Overlay |
| VPC: | Tenant-C-VPC | Tenant-C-VPC |
| IPAM: | Nutanix IPAM | Nutanix IPAM |
| Network CIDR: | 172.16.200.0/24 | 192.168.1.0/24 |
| Gateway: | 172.16.200.1 | 192.168.1.1 |
| IP Pool: | 172.16.200.5-100 | 192.168.1.2-254 |
An MSP Bastion VM will be deployed in the MSP network, and a Floating IP will be allocated from MT-Transit-NAT’s IP Pool. VPC Network Policies and/or Flow Network Security can be used to limit the traffic allowed to/from the MSP Bastion VM.
Additionally, a VPC Network Policy will be configured to ensure all traffic sourced from the MSP network and bound for an external destination is forwarded to the MT-Transit-NAT external network’s default gateway. This Network Policy is configured as shown:
| Policy Priority | 900 |
|---|---|
| Source | Custom |
| Source Subnet IP | 192.168.1.0/24 |
| Destination | External |
| Protocol | Any |
| Action | Forward |
| Forward IP | 203.0.113.1 |
Hybrid Multicloud
Nutanix in the Public CloudCreate your hybrid cloud environment with Nutanix Clusters in the public cloud.
» Download this section as PDF (opens in a new tab/window)
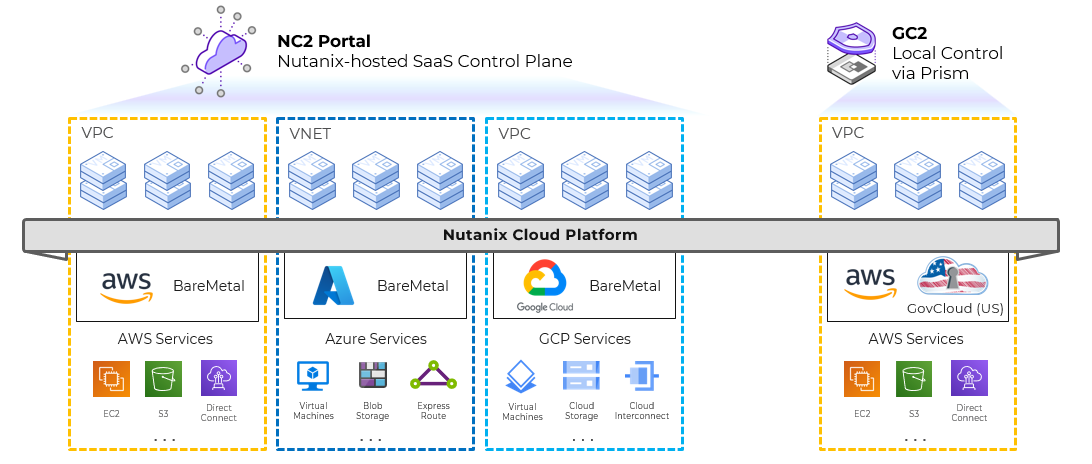 Nutanix In The Public Cloud - Overview
Leveraging the public cloud means being able to scale your applications and data on-demand within minutes. Nutanix Cloud Clusters (NC2) and Government Cloud Clusters (GC2) allows you to use a single management plane to manage both your Nutanix private cloud and your public cloud resources in the same Prism interface, allowing for a seamless experience.
This book will go into the technical details of the architecture, networking, storage, and other aspects of running NC2 and GC2.
Nutanix is currently supported on AWS commercial and Gov Cloud, Azure and Google Cloud.
» Download this section as PDF (opens in a new tab/window)
Nutanix Cloud Clusters (NC2) on AWS provides on-demand clusters running in target cloud environments using bare metal resources. This allows for true on-demand capacity with the simplicity of the Nutanix platform you know. Once provisioned the cluster appears like any traditional AHV cluster, just running in a cloud providers datacenters.
Supported Configurations
The solution is applicable to the configurations below (list may be incomplete, refer to documentation for a fully supported list):
Core Use Case(s):
- On-Demand / burst capacity
- Backup / DR
- Cloud Native
- Geo Expansion / DC consolidation
- App migration
Management interfaces(s):
- Nutanix Clusters Portal - Provisioning
- Prism Central (PC) - Nutanix Management
-
AWS Console - AWS Management
- EC2 Metal Instance Types:
- m5d.metal
- z1d.metal
- i3en.metal
- g4dn.metal
- i4i.metal
- m6d.metal
- i7i.metal-48xl
- i7ie.metal-48xl
Upgrades:
- Part of AOS
Compatible Features:
- AOS Features
- AWS Services
Key terms / Constructs
The following key items are used throughout this section and defined in the following:
- Nutanix Clusters Portal
- The Nutanix Clusters Portal is responsible for handling cluster provisioning requests and interacting with AWS and the provisioned hosts. It creates cluster specific details and handles the dynamic CloudFormation stack creation.
- Region
- A geographic landmass or area where multiple Availability Zones (sites) are located. A region can have two or more AZs. These can include regions like US-East-1 or US-West-1.
- Availability Zone (AZ)
- An AZ consists of one or more discrete datacenters inter-connected by low latency links. Each site has it’s own redundant power, cooling, network, etc. Comparing these to a traditional colo or datacenter, these would be considered more resilient as a AZ can consist of multiple independent datacenters. These can include sites like US-East-1a or US-West-1a.
- VPC
- A logically isolated segment of the AWS cloud for tenants. Provides a mechanism to to secure and isolate environment from others. Can be exposed to the internet or other private network segments (other VPCs, or VPNs).
- S3
- Amazon’s object service which provides persistent object storage accessed via the S3 API. This is used for archival / restore.
- EBS
- Amazon’s volume / block service which provides persistent volumes that can be attached to AMIs.
- Cloud Formation Template (CFT)
- A Cloud Formation Template simplifies provisioning, but allowing you to define a “stack” of resources and dependencies. This stack can then be provisioned as a whole instead of each individual resource.
Cluster Architecture
From a high-level the Nutanix Clusters Portal is the main interface for provisioning Nutanix Clusters on AWS and interacting with AWS.
The provisioning process can be summarized with the following high-level steps:
- Create cluster in NC2 Portal
- Deployment specific inputs (e.g. Region, AZ, Instance type, VPC/Subnets, etc.)
- The NC2 Portal creates associated resources
- Host agent in Nutanix AMI checks-in with Nutanix Clusters on AWS
- Once all hosts as up, cluster is created
The following shows a high-level overview of the NC2A interaction:
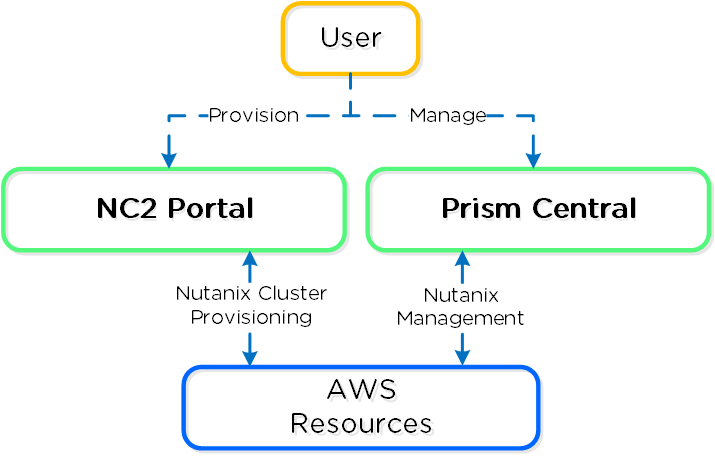 NC2A - Overview
The following shows a high-level overview of a the inputs taken by the NC2 Portal and some created resources:
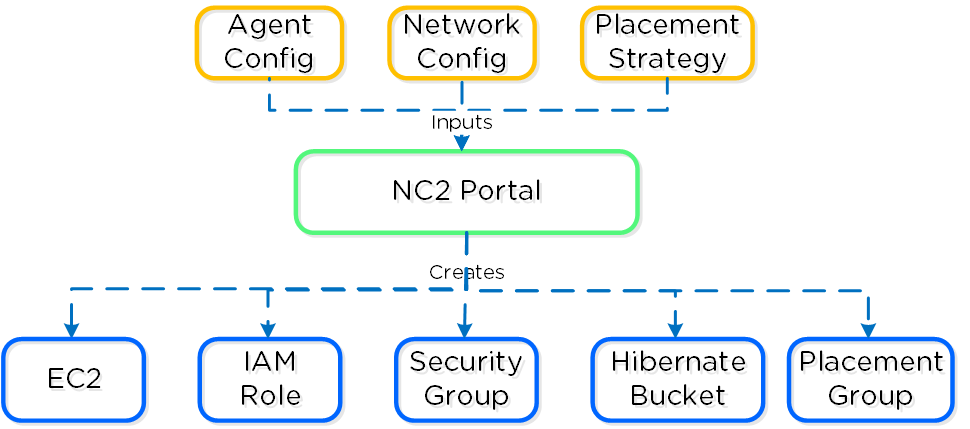 Nutanix Clusters on AWS - Cluster Orchestrator Inputs
The following shows a high-level overview of a node in AWS:
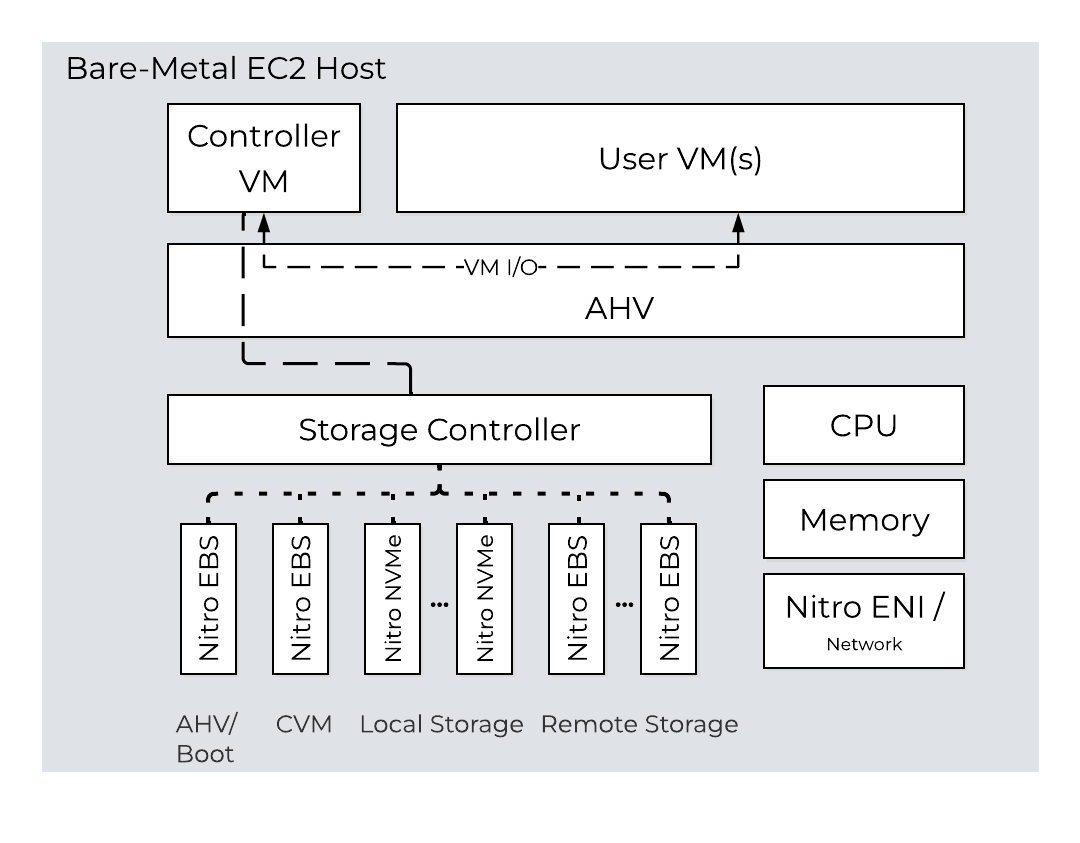 NC2A - Node Architecture
Storage for Nutanix Cloud Clusters on Amazon Web Services
The primary storage for NC2 comes from the locally attached NVMe disks. The locally attached disks are the first tier that the CVMs use to persist the data. Each AWS node also consumes two AWS Nitro EBS volumes that are attached to the bare-metal node. One of those EBS volumes is used for AHV and the other for the CVM. When you provision the NC2 instance in the NC2 portal, you can add more Nitro EBS volumes to each bare-metal node in the cluster as remote storage, scaling your storage to meet business needs without adding more bare-metal nodes. If you initially create the cluster with Nitro EBS volumes, you can add more Nitro EBS volumes later.
Given the hosts are bare metal, we have full control over storage and network resources similar to a typical on-premises deployment. For the CVM and AHV host boot, EBS volumes are used. NOTE: certain resources like EBS interaction run through the AWS Nitro card which appears as a NVMe controller in the AHV host.
When you add EBS volumes to a cluster, they’re added in a uniform manner throughout the cluster. The total amount of storage follows the same AOS limitations (Nutanix portal credentials required) in terms of the maximum amount storage that can be added, with the additional constraint that the maximum storage can’t be more than 20 percent of the local storage for the bare-metal node. If you use the I4i.metal instance, which has 30 TB of local AWS Nitro NVMe-based storage, you can reach the current AOS node limit with the other 80 percent when using snapshots.
Through the NC2 portal, you can add a small amount of EBS storage during the initial deployment and add more later. If you have a disaster recovery use case with NC2, you can deploy a three-node cluster with a small amount of EBS storage to cover the storage usage for tier-1 workloads that need fast recovery. If your needs change, you can scale up the storage later. At failover, you can use Prism Central playbooks or the NC2 portal to add NC2 nodes to cover any RAM usage not supplied by the three bare-metal nodes.
Nutanix recommends keeping the minimum number of additional nodes greater than or equal to your cluster’s redundancy factor. Expand the cluster in multiples of your redundancy factor for the additional nodes.
Note: If you use EBS volumes for storage, only use homogenous clusters (all the nodes must be the same type).
The data tiering process for NC2 on AWS is the same as the process for a hybrid configuration on-premises.
Placement policy
Nutanix uses a partition placement strategy when deploying nodes inside an AWS Availability Zone. One Nutanix cluster can’t span different Availability Zones in the same Region, but you can have multiple Nutanix clusters replicating between each other in different zones or Regions. Using up to seven partitions, Nutanix places the AWS bare-metal nodes in different AWS racks and stripes new hosts across the partitions.
NC2 on AWS supports combining heterogenous node types in a cluster. You can deploy a cluster of one node type and then expand that cluster’s capacity by adding heterogenous nodes to it. This feature protects your cluster if its original node type runs out in the Region and provides flexibility when expanding your cluster on demand. If you’re looking to right-size your storage solution, support for heterogenous nodes can give you more instance options to choose from.
NC2 on AWS allows you to use a combination of i3.metal, i3en.metal, and i4i.metal instance types or z1d.metal, m5d.metal, and m6id.metal instance types while creating a new cluster or expanding the cluster capacity of an already running cluster.
NC2 on AWS allows you to create a heterogeneous cluster depending on the following conditions:
NC2 on AWS supports a combination of i3.metal, i3en.metal, and i4i.metal instance types or z1d.metal, m5d.metal, and m6id.metal instance types. The AWS region must have these instance types supported by NC2 on AWS. For more information, see Supported Regions and Bare-metal Instances.
Note: You can only create homogenous clusters with g4dn.metal; it cannot be used to create a heterogeneous cluster.
Nutanix recommends that the minimum number of additional nodes must be equal to or greater than your cluster’s redundancy factors (RF), and the cluster must be expanded in multiples of RF for the additional nodes. A warning is displayed if the number of nodes is not evenly divisible by the RF number.
UVMs that have been created and powered ON in the original cluster running a specific node or a combination of compatible nodes, as listed below, cannot be live migrated across different node types when other nodes are added to the cluster. After successful cluster expansion, all UVMs must be powered OFF and powered ON to enable live migration.
If z1d.metal is present in the heterogeneous cluster either as the initial node type of the cluster or as the new node type added to an existing cluster. If i4i.metal is the initial node type of the cluster and any other compatible node is added. If m6id.metal is the initial node type of the cluster and any other compatible node is added. If i3en.metal is the initial node type of the cluster and the i3.metal node is added.
You can expand or shrink the cluster with any number of i3.metal, i3en.metal, and i4i.metal instance types or z1d.metal, m5d.metal, and m6id.metal instance types as long as the cluster size remains within the cap of a maximum of 28 nodes
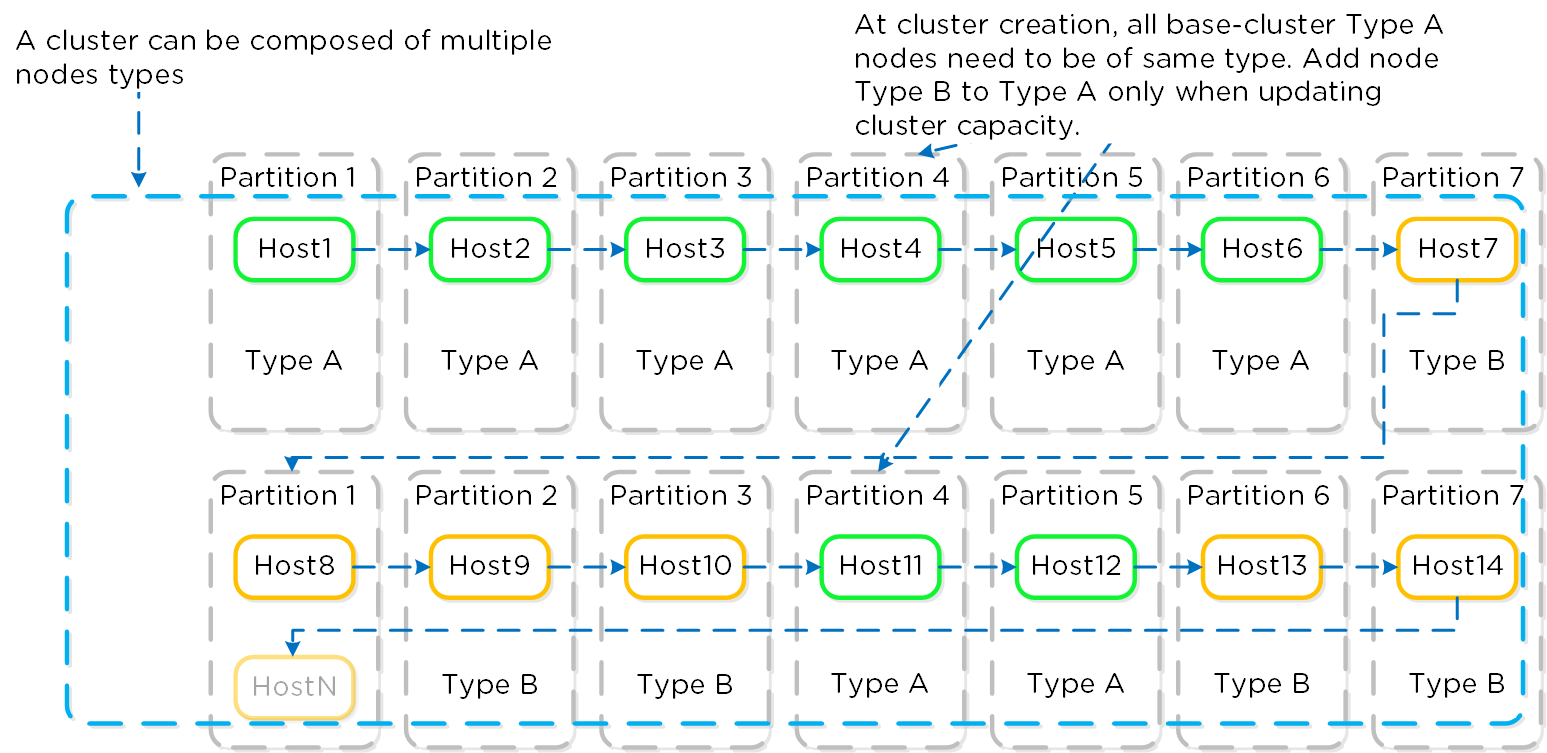 NC2A - Partition Placement
When you’ve formed the Nutanix cluster, the partition groups map to the Nutanix rack-awareness feature. AOS Storage writes data replicas to other racks in the cluster to ensure that the data remains available for both replication factor 2 and replication factor 3 scenarios in the case of a rack failure or planned downtime.
Storage
Storage for Nutanix Cloud Clusters on AWS can be broken down into two core areas:
- Core / Active
- Hibernation
Core storage is the exact same as you’d expect on any Nutanix cluster, passing the “local” storage devices to the CVM to be leveraged by Stargate.
Note
Instance Storage
Given that the "local" storage is backed by the AWS instance store, which isn't fully resilient in the event of a power outage / node failure additional considerations must be handled.
For example, in a local Nutanix cluster in the event of a power outage or node failure, the storage is persisted on the local devices and will come back when the node / power comes back online. In the case of the AWS instance store, this is not the case.
In most cases it is highly unlikely that a full AZ will lose power / go down, however for sensitive workloads it is recommended to:
- Leverage a backup solution to persist to S3 or any durable storage
- Replicate data to another Nutanix cluster in a different AZ/Region/Cloud (on-prem or remote)
One unique ability with NC2A is the ability to “hibernate” a cluster allowing you to persist the data while spinning down the EC2 compute instances. This could be useful for cases where you don’t need the compute resources and don’t want to continue paying for them, but want to persist the data and have the ability to restore at a later point.
When a cluster is hibernated, the data will be backed up from the cluster to S3. Once the data is backed up the EC2 instances will be terminated. Upon a resume / restore, new EC2 instances will be provisioned and data will be loaded into the cluster from S3.
Networking
Networking can be broken down into a few core areas:
- Host / Cluster Networking
- Guest / UVM Networking
- WAN / L3 Networking
Note
Native vs. Overlay
Instead of running our own overlay network, we decided to run natively on AWS subnets, this allows VMs running on the platform to natively communicate with AWS services with zero performance degradation.
NC2A are provisioned into an AWS VPC, the following shows a high-level overview of an AWS VPC:
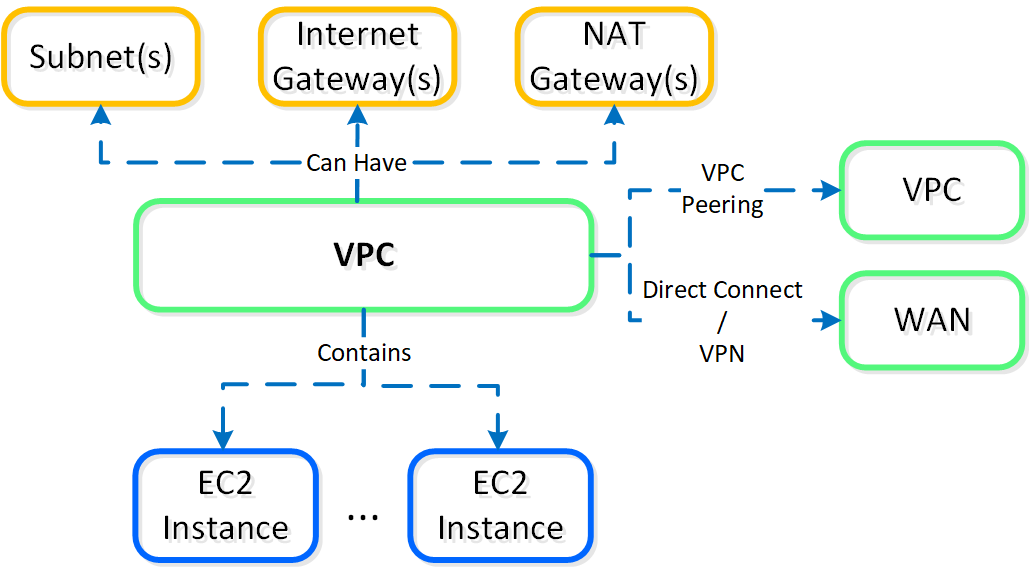 NC2A - AWS VPC
Note
New vs. Default VPC
AWS will create a default VPC/Subnet/Etc. with a 172.31.0.0/16 ip scheme for each region.
It is recommended to create a new VPC with associated subnets, NAT/Internet Gateways, etc. that fits into your corporate IP scheme. This is important if you ever plan to extend networks between VPCs (VPC peering), or to your existing WAN. This should be treated as you would treat any site on the WAN.
Nutanix Cloud Networking
Nutanix delivers a truly hybrid multicloud experience because you can use the standalone native cloud networking or Flow Virtual Networking, which gives you the option for the low overhead of native networking with the same operational model as the rest of your hybrid multicloud.
Native Networking
Nutanix integration with the AWS networking stack means that every VM deployed on NC2 on AWS receives a native AWS IP address when using native networking, so that applications have full access to all AWS resources as soon as you migrate or create them on NC2 on AWS. Because the Nutanix network capabilities are directly on top of the AWS overlay, network performance remains high and resource consumption is low because you don’t need additional network components.
AHV uses Open vSwitch (OVS) for all VM networking. You can configure VM networking through Prism or the aCLI, and each vNIC connects to a tap interface. Native networking uses the same networking stack as on-premises. Flow Virtual Networking uses separate ENIs to allow traffic to exit the cluster. The following figure shows a conceptual diagram of the OVS architecture.
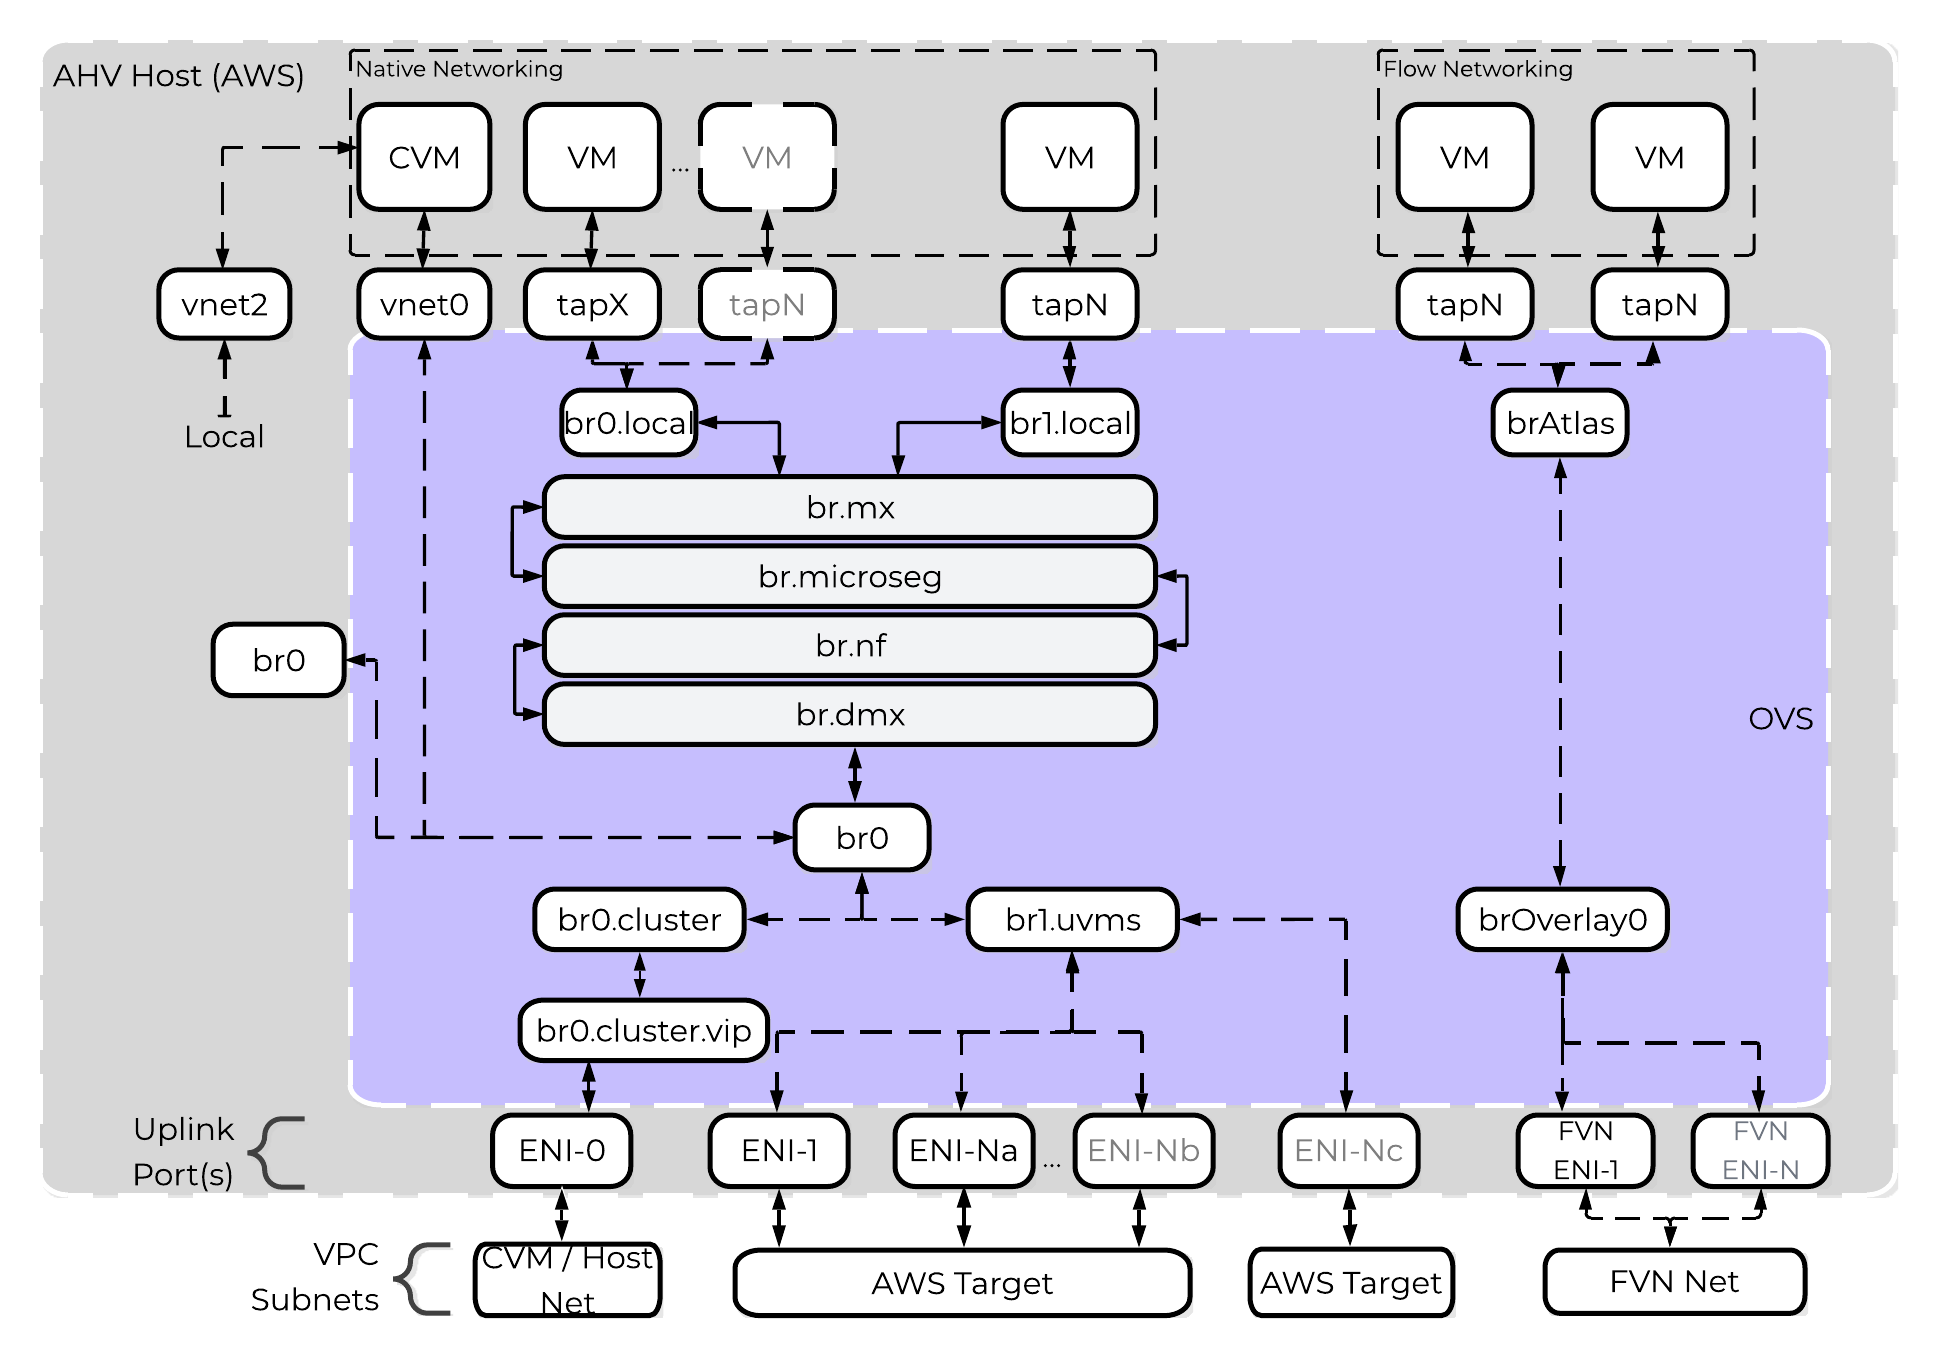 NC2 on AWS - OVS Architecture
The AHV host, VMs, and physical interfaces use ports to connect to the bridges, and both bridges communicate with the AWS overlay network. Each host has the required drivers to use the AWS overlay network.
With native network integration, you can deploy NC2 in existing AWS VPCs. Because existing AWS environments apply change control and security processes, you only need to allow NC2 on AWS to talk to an NC2 console. With this integration, you can increase security in your cloud environments.
Nutanix uses native AWS API calls to deploy AOS on bare-metal EC2 instances and consume network resources. Each bare-metal EC2 instance has full access to its bandwidth through an ENI, so if you deploy Nutanix to an i3.metal instance, each node has access up to 25 Gbps. An ENI is a logical networking component in a VPC that represents a virtual network card, and each ENI can have one primary IP address and up to 49 secondary IP addresses. AWS hosts can support up to 15 ENIs.
When deployed with NC2 on AWS, AHV runs the Cloud Network Controller (CNC) service on each node as a leaderless service and runs an OpenFlow controller. CNC uses an internal service called Cloud Port Manager to create and delete ENIs and assign ENI IP addresses to guest VMs.
Cloud Port Manager can map large CIDR ranges from AWS and allows AHV to consume all or a subset of the range. If you use an AWS subnet of 10.0.0.0/24 and then create an AHV subnet of 10.0.0.0/24, Cloud Port Manager uses 1 ENI (cloud port) until all secondary IP addresses are consumed by active VMs. When the 49 secondary IP addresses are used, Cloud Port Manager attaches an additional ENI to the host and repeats the process. Because each new subnet uses a different ENI on the host, this process can lead to ENI exhaustion if you use many AWS subnets for your deployment.
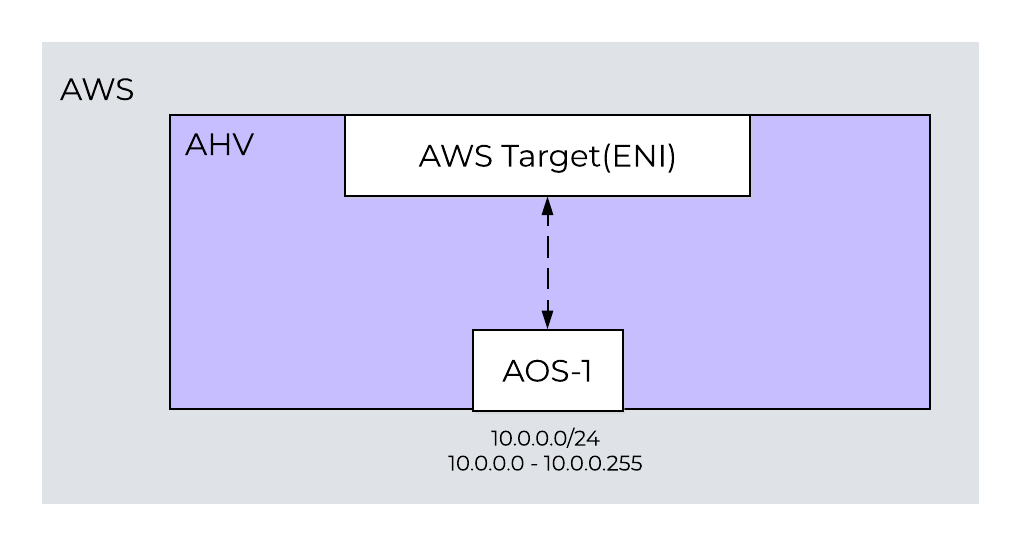 One-to-One Nutanix AHV and AWS Subnet Mapping
To prevent ENI exhaustion, use an AWS subnet of 10.0.2.0/23 as your AWS target. In AHV, create two subnets of 10.0.2.0/24 and 10.0.3.0/24. With this configuration, Cloud Port Manager maps the AHV subnets to one ENI, and you can use many subnets without exhausting the bare-metal nodes’ ENIs. Because an NC2 cluster can have multiple AWS subnets if enough ENIs are available, you can dedicate ENIs to any subnet for more throughput.
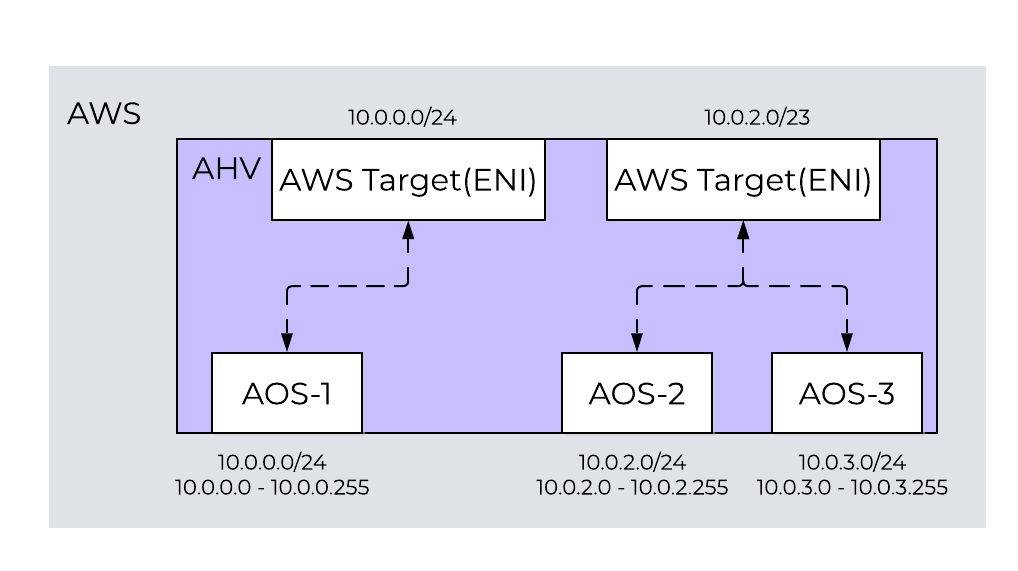 One-to-One and One-to-Many Nutanix AHV and AWS Subnet Mapping
When you consume multiple AHV subnets in a large AWS CIDR range, the network controller generates an Address Resolution Protocol (ARP) request for the AWS default gateway with the ENI address as the source. Once the AWS default gateway responds, the network controller installs ARP proxy flows for all AHV subnets with active VMs on the ENI (cloud port). The ARP requests to a network’s default gateway reach the proxy flow and receive the MAC address of the AWS gateway in response. This configuration allows traffic to enter and exit the cluster, and it configures OVS flow rules to ensure traffic enters and exits on the correct ENI.
For more information on the Nutanix implementation of OVS, see the AHV Administration Guide.
NC2 on AWS creates a single default security group for guest VMs running in the Nutanix cluster. Any ENIs created to support guest VMs are members of this default security group, which allows all guest VMs in a cluster to communicate with each other. In addition to security groups, you can use Nutanix Flow Network Security to provide greater security controls for east-west network traffic.
From the AWS VPC dashboard, click on ‘subnets’ then click on ‘Create Subnet’ and input the network details:
Creating a Subnet
An AWS Region is a distinct geographic area. Each Region has multiple, isolated locations known as Availability Zones (AZs), which are logical datacenters available for any AWS customer in that Region to use. Each AZ in a Region has redundant and separate power, networking, and connectivity to reduce the likelihood of two AZs failing simultaneously.
Create a subnet in AWS in a VPC, then connect it to AOS in Prism Element. Cloud network, a new service in the CVM, works with AOS configuration and assigns a VLAN ID (or VLAN tag) to the AWS subnet and fetches relevant details about the subnet from AWS. The network service prevents you from using the AHV or CVM subnet for guest VMs by not allowing you to create a network with the same subnet.
You can use each ENI to manage 49 secondary IP addresses. A new ENI is also created for each subnet that you use. The AHV host, VMs, and physical interfaces use ports to connect to the bridges, and both bridges communicate with the AWS overlay network. Because each host already has the drivers that it needs for a successful deployment, you don’t need to do any additional work to use the AWS overlay network.
Always keep the following best practices in mind:
-
Don’t share AWS guest-VM subnets between clusters.
-
Have separate subnets for management (AHV and CVM) and guest VMs.
-
If you plan to use VPC peering, use nondefault subnets to ensure uniqueness across AWS Regions.
-
Divide your VPC network range evenly across all usable AZs in a Region.
-
In each AZ, create one subnet for each group of hosts that has unique routing requirements (for example, public versus private routing).
-
Size your VPC CIDR and subnets to support significant growth.
Guest AHV IP Address Management
AHV uses IP address management (IPAM) to integrate with native AWS networking. NC2 on AWS uses the native AHV IPAM to inform the AWS DHCP server of all IP address assignments using API calls. NC2 relies on AWS to send gratuitous Address Resolution Protocol (ARP) packets for any additions to an ENI’s secondary IP addresses. We rely on these packets to ensure that each hypervisor host is notified when an IP address moves or new IP addresses become reachable. For guest VMs, you can’t share a given AWS subnet between two NC2 on AWS deployments. You can, however, use the same management subnet (AHV and CVMs) for multiple clusters.
The cloud network controller, a service in the AHV host, helps with ENI creation. The cloud network controller runs an OpenFlow controller, which manages the OVS in the AHV hosts and handles mapping, unmapping, and migrating guest-VM secondary IP addresses between ENIs or hosts. A subcomponent of the cloud network controller called cloud port manager provides the interface and manages AWS ENIs.
IPAM avoids address overlap by sending AWS API calls to inform AWS which addresses are being used.
The AOS leader assigns an IP address from the address pool when it creates a managed vNIC, and it releases the address back to the pool when the vNIC or VM is deleted.
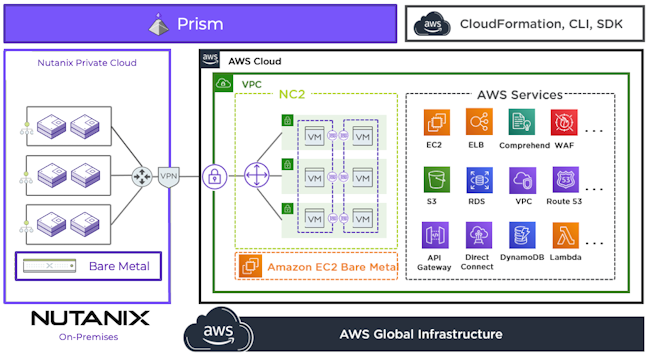 Overview of NC2 on AWS
By using native AWS networking, you quickly establish connectivity so that cloud administrators can focus on their tasks instead of managing additional networking technologies. The NC2 instance has full access to all AWS services, such as S3 and other EC2 instances running in the same Amazon Virtual Private Cloud. For a walkthrough of a typical deployment, see the Creating a Cluster section of the Nutanix Cloud Clusters on AWS Deployment and User Guide.
Flow Virtual Networking Flow Virtual Networking builds on the native networking stack in AWS to provide the same network virtualization and control that is offered in other NC2-supported clouds.
Flow Virtual Networking is a software-defined networking solution that provides multitenant isolation, self-service provisioning, and IP address preservation using Nutanix VPCs, subnets, and other virtual components that are separate from the physical network (AWS overlay) for the AHV clusters. It integrates tools to deploy networking features like virtual LANs (VLANs), VPCs, virtual private networks (VPNs), layer 2 virtual network extensions using a VPN or virtual tunnel end-points (VTEPs), and Border Gateway Protocol (BGP) sessions to support flexible networking that focuses on VMs and applications.
Flow Virtual Networking on AWS
Running Flow Virtual Networking requires that you run Prism Central on one of your NC2 on AWS clusters. Multiple NC2 clusters can use Flow Virtual Networking. The NC2 deployment process deploys Prism Central with high availability, and Prism Central hosts the control plane for Flow Virtual Networking.
You need two new subnets when deploying Flow Virtual Networking: one for Prism Central and one for Flow Virtual Networking. The Prism Central subnet is automatically added to the Prism Element instance where it’s deployed using a native AWS subnet. The Flow Virtual Networking subnet is also added to every bare-metal node.
The Flow Virtual Networking subnet works as the external network for traffic from a Nutanix VPC. A VPC is an independent and isolated IP address space that functions as a logically isolated virtual network made of one or more subnets that are connected through a logical or virtual router. The IP addresses in a VPC must be unique, but IP addresses can overlap across VPCs.
In AWS, Nutanix uses a two-tier topology to provide external access to the Nutanix VPCs. Deploying the first cluster in AWS with Flow Virtual Networking automatically creates a transit VPC that contains an external subnet called overlay-external-subnet-nat. The transit VPC requires this external subnet to act as the Nutanix Flow VPC gateway by using an AWS ENI for north and south traffic out of the Nutanix VPC. You can create an additional external network in the transit VPC for routed traffic, also known as no-NAT networking. Both the NAT and no-NAT networks use a private address space to route traffic from the Nutanix user VPC and the transit VPC to the AWS ENI that hosts the Nutanix VPC gateway.
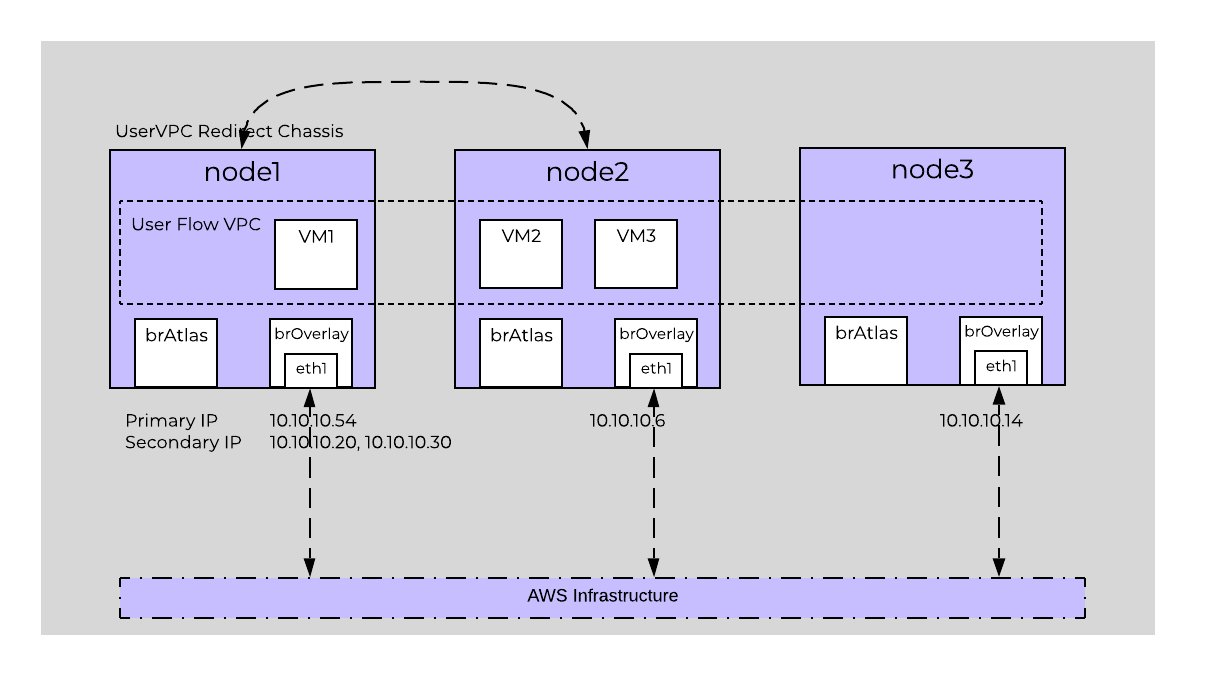 Flow Virtual Networking Traffic on AWS
In the previous diagram, the AWS ENI used at the Nutanix Flow gateway for UserVPC is node1. Flow Virtual Networking uses the host of the VPC gateway as the redirect chassis for AHV. The redirect chassis is the exit point for all traffic out of the VPC to the underlay network. Traffic for VM1 exits the redirect chassis to the transit VPC and out to the ENI, which is eth1 on node1.
VM2 and VM3 on node2’s traffic path use the redirect chassis on node1. Traffic uses a Generic Network Virtualization Encapsulation (GENEVE) tunnel between hosts on the AHV network. The traffic is decapsulated and sent to the ENI for routing to the rest of the AWS network.
The Flow Virtual Networking native AWS subnet consumes the Source Network Address Translation (SNAT) IP addresses and any floating IP addresses that are given to user VMs that need inbound traffic to enter the user VPC. Each NC2 bare-metal node consumes the primary ENI IP address, and 60 percent of the native Flow Virtual Networking subnet range is available for floating IP addresses.
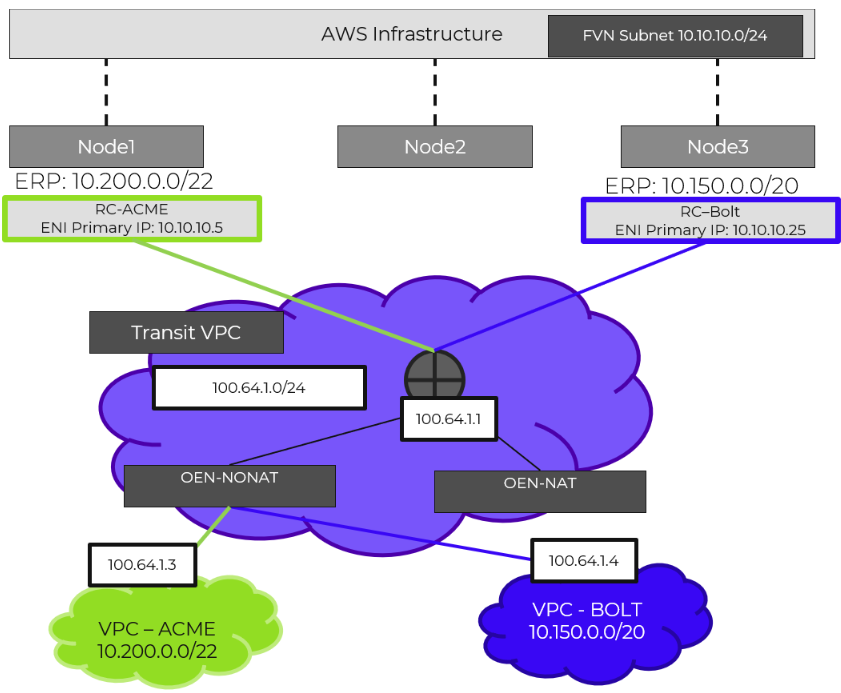 Path for Nutanix VPC Traffic to the AWS Network
Traffic exits the transit VPC through the AWS ENI link that is hosted on one of the NC2 nodes. Even though all NC2 nodes have the Flow Virtual Networking subnet connected, each VPC has only one Nutanix Flow gateway. You can host multiple Nutanix Flow VPC gateways on the same ENI. The transit gateway automatically assigns an IP address from its private network to each Nutanix user VPC. In the previous figure, the VPC named ACME is assigned 100.64.1.3, and the VPC named BOLT is assigned 100.64.1.4.
When you configure an externally routable prefix (ERP) for a user VPC subnet in Prism Central, a route is added to the default route table in AWS that points the ERP CIDR range to the ENI. In the previous figure, the Nutanix Flow VPC gateway for ACME is on node1 with an ERP of 10.200.0.0/22. AWS traffic sees the route for all traffic destined to 10.200.0.0/22 and sends it to the ENI. Once traffic reaches the ENI, the transit gateway routes the traffic to 100.64.1.3. With this design, each node in the cluster can host multiple Nutanix Flow VPC gateways.
In the transit-VPC page in Prism Central, you can see which NC2 bare-metal node hosts the peer-to-peer link by clicking Associated External Subnets in the Summary tab.
WAN / L3 Networking
In most cases deployments will not be just in AWS and will need to communicate with the external world (Other VPCs, Internet or WAN).
For connecting VPCs (in the same or different regions), you can use VPC peering which allows you to tunnel between VPCs. NOTE: you will need to ensure you follow WAN IP scheme best practices and there are no CIDR range overlaps between VPCs / subnets.
The following shows a VPC peering connection between a VPC in the eu-west-1 and eu-west-2 regions:
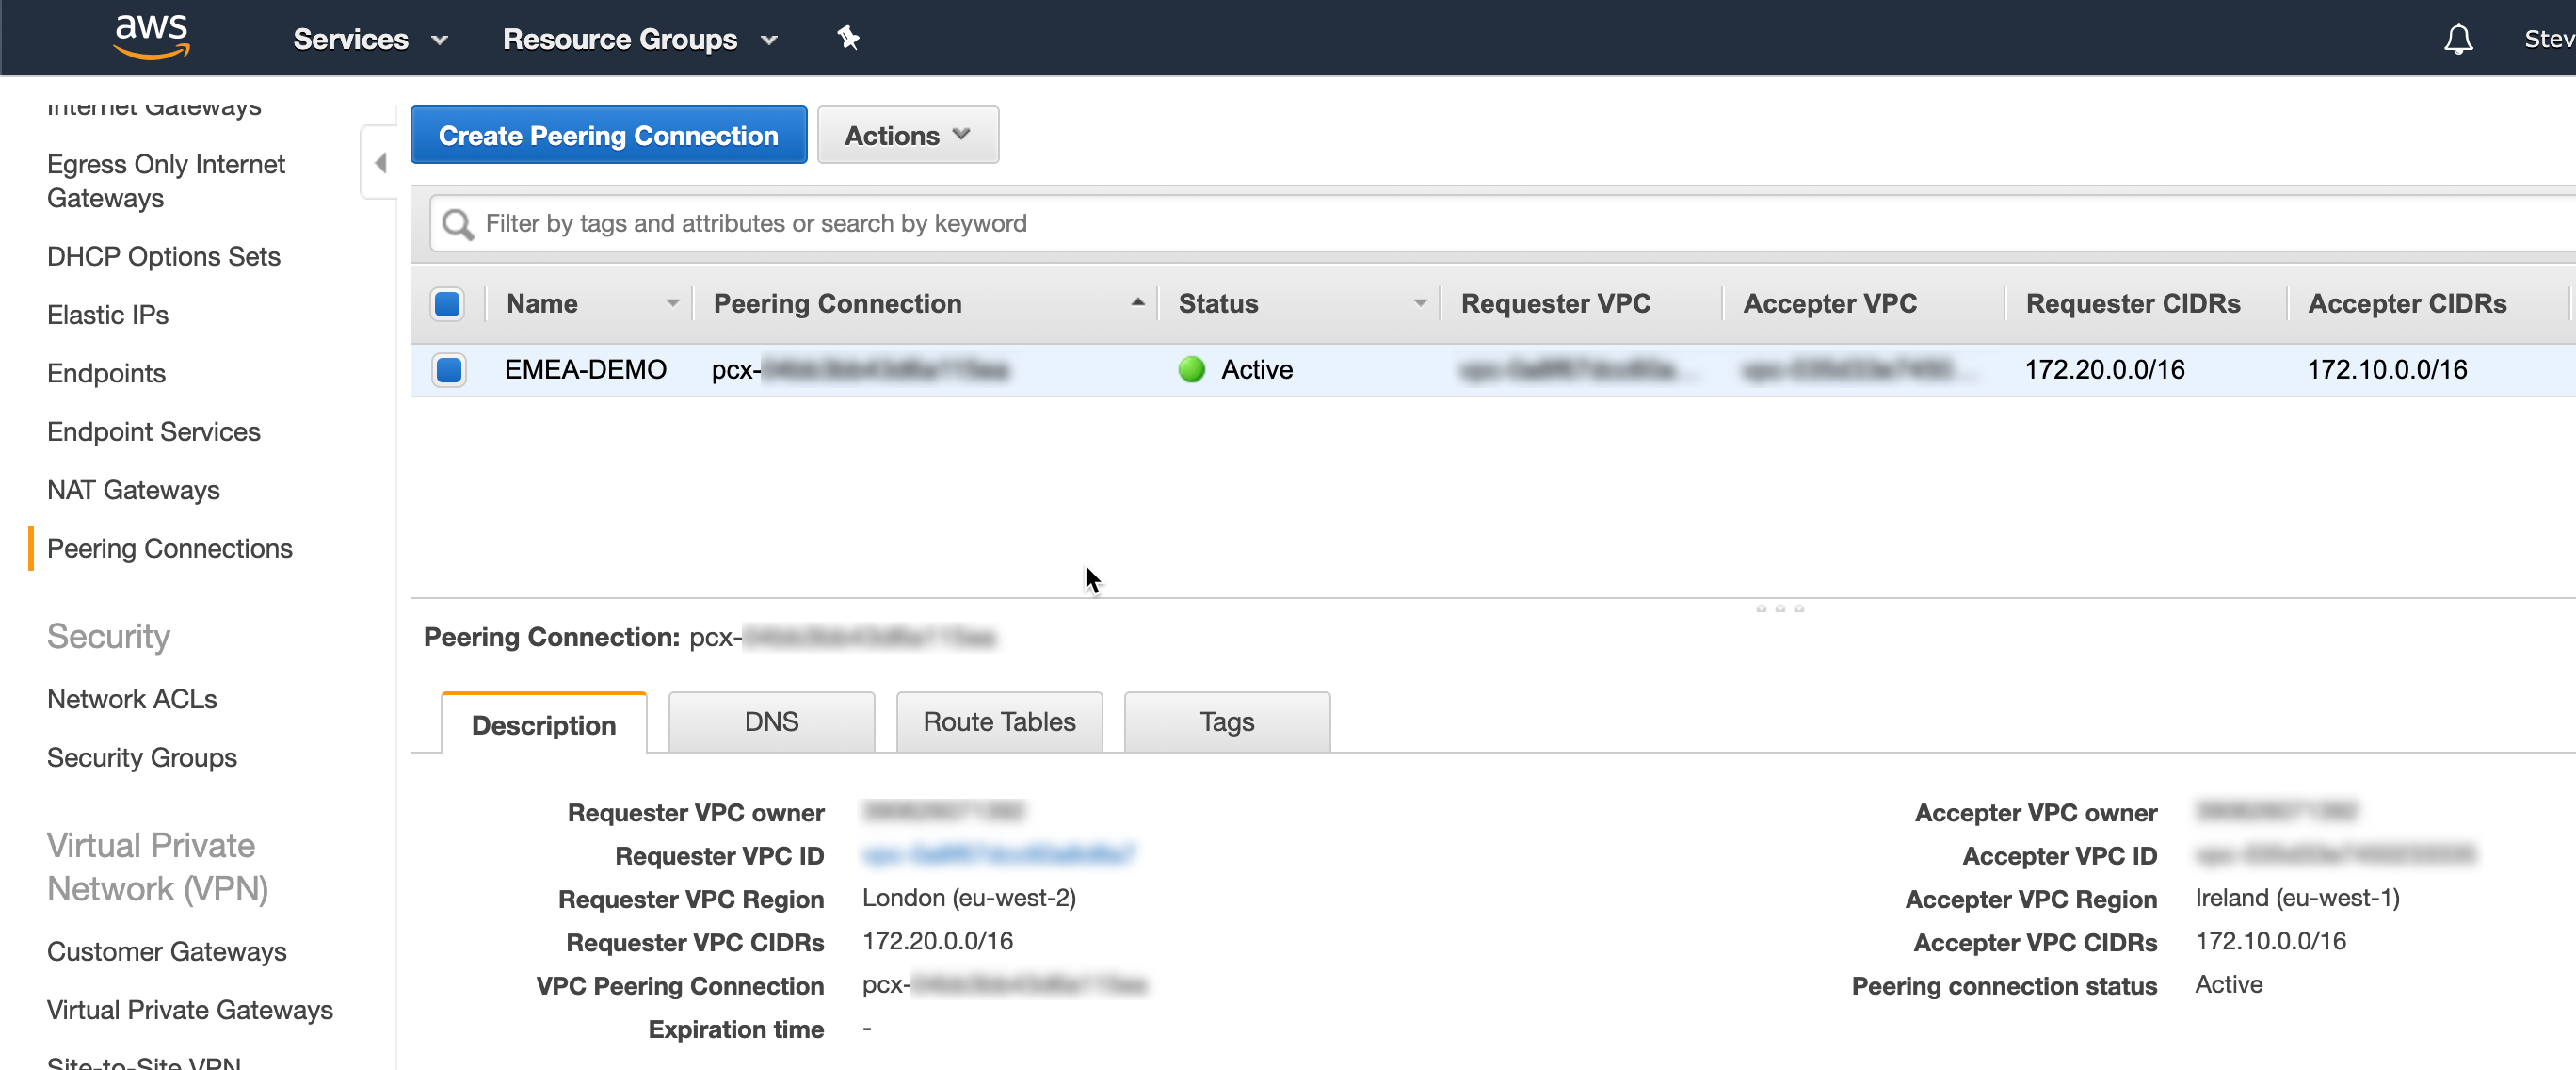 NC2A - VPC Peering
The route table for each VPC will then route traffic going to the other VPC over the peering connection (this will need to exist on both sides if communication needs to be bi-directional):
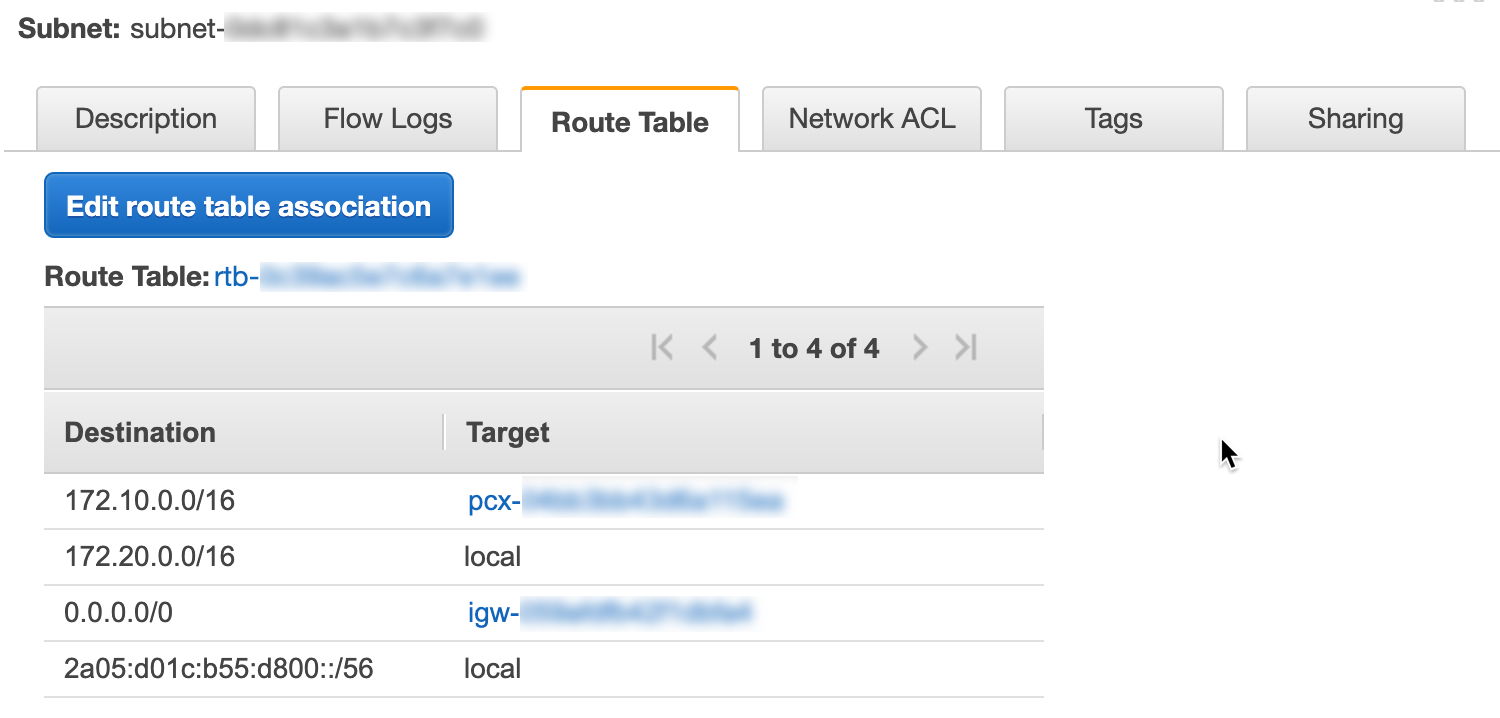 NC2A - Route Table
For network expansion to on-premises / WAN, either a VPN gateway (tunnel) or AWS Direct Connect can be leveraged.
Security
Given these resources are running in a cloud outside our full control security, data encryption and compliance is a very critical consideration.
The recommendations can be characterized with the following:
- Enable data encryption
- Only use private subnets (no public IP assignment)
- Lock down security groups and allowed ports / IP CIDR blocks
- For more granular security, leverage Flow
AWS Security Groups
You can use AWS security groups and network access control lists to secure your cluster relative to other AWS or on-premises resources. When you deploy Flow Virtual Networking, a fourth security group is deployed for Prism Central that has all the necessary rules for the Flow Virtual Networking control plane. If you plan to use Nutanix Disaster Recovery to protect AWS, edit this security group to allow traffic from the on-premises Prism Central instance. You can also use existing groups in your environment.
With AWS security groups, you can limit access to the AWS CVMs, AHV host, and guest VMs to only allow traffic from your on-premises management network and CVMs. You can control replication from on-premises to AWS down to the port level, and you can easily migrate workloads because the replication software is embedded in the CVMs at both ends. AOS 6.7 and later versions support custom AWS security groups, which provide additional flexibility so that AWS security groups can apply to the VPC domain and at the cluster and subnet levels.
Attaching the ENI to the bare-metal host applies your custom AWS security groups. You can use and reuse existing security groups across different clusters without additional scripting to maintain and support the prior custom security groups.
The cloud network service—a distributed service that runs in the CVM and provides cloud-specific back-end support for subnet management, IP address event handling, and security group management—uses tags to evaluate which security groups to attach to the network interfaces. You can use these tags with any AWS security group, including custom security groups. The following list is arranged in dependency order:
- Scope: VPC
- Key: tag:nutanix:clusters:external
- Value: <none> (leave this tag blank)
You can use this tag to protect multiple clusters in the same VPC.
- Scope: VPC or cluster
- Key: tag:nutanix:clusters:external:cluster-uuid
- Value: <cluster-uuid>
This tag protects all the UVMs and interfaces that the CVM and AHV use.
- Scope: VPC, cluster, network, or subnet
- Key: tag:nutanix:clusters:external:networks
- Value: <cidr1, cidr2, cidr3>
This tag only protects the subnets you provide.
If you want to apply a tag based on the subnet or CIDR, you need to set both external and cluster-uuid for the network or subnet tag to be applied. The following subsections provide configuration examples.
Default Security Groups
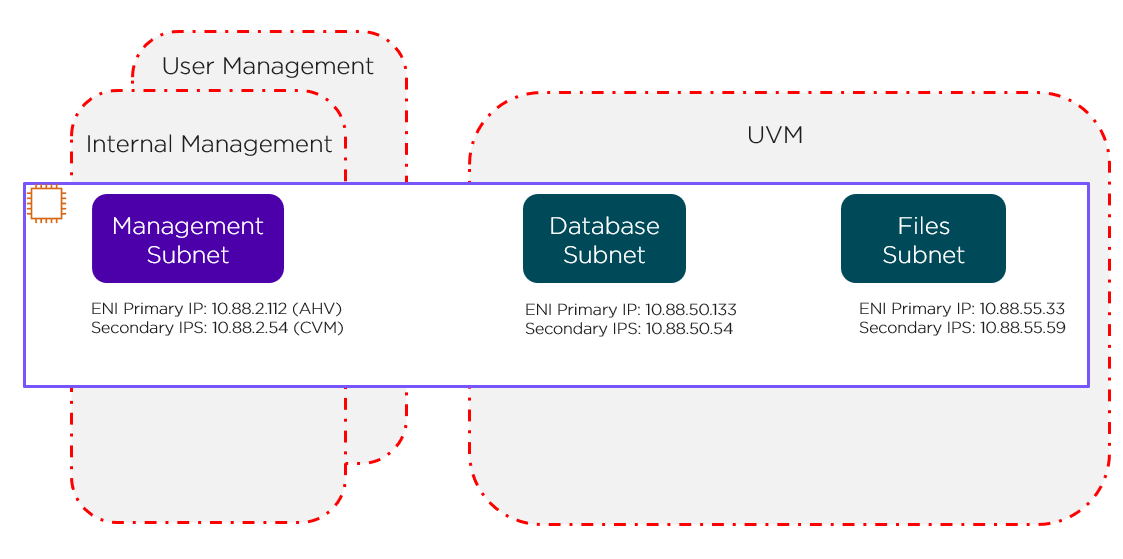
The red lines in the preceding figure represent the standard AWS Security Groups that deploy with the cluster.
- Internal management Security Group: Allows all internal traffic between all CVMs and AHV hosts (EC2 bare-metal hosts). Don’t edit this group without approval from Nutanix Support.
- User management Security Group: Allows users to access Prism Element and other services running on the CVM.
- UVM Security Group: Allows UVMs to talk to each other. By default, all UVMs on all subnets can talk to each other. This Security Group doesn’t offer subnet granularity.
VPC Level
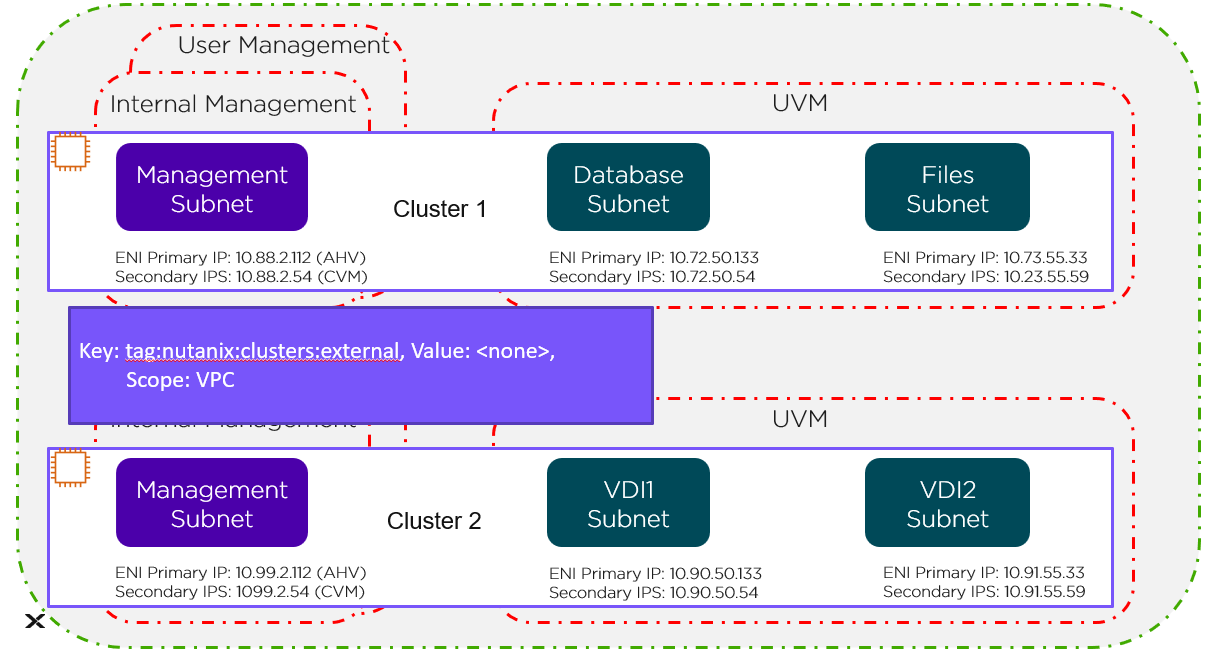
The green line in the preceding figure represents the VPC-level tag protecting Cluster 1 and Cluster 2.
Cluster Level
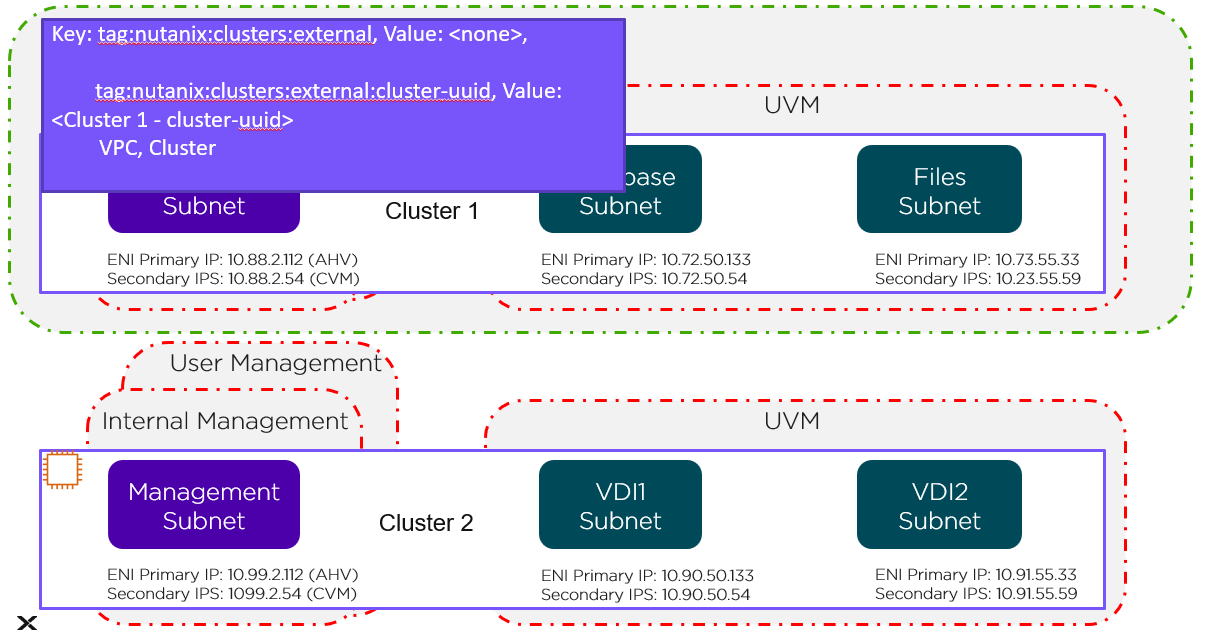
The green line in the preceding figure represents the cluster-level tag. Changes to these Security Groups affect the management subnet and all the UVMs running in Cluster 1.
Network Level
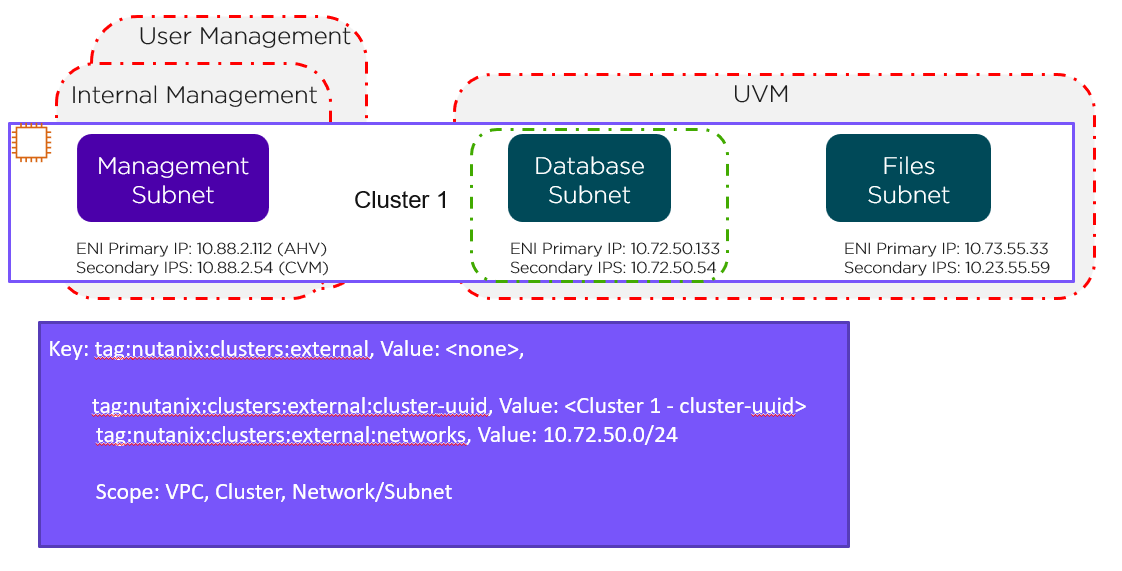
This network-level custom Security Group covers just the database subnet, as shown by the green line in the preceding figure. To cover the Files subnet with this Security Group, simply change the tag as follows:
- tag:nutanix:clusters:external:networks, Value: 10.72.50.0/24, 10.73.55.0/24
Usage and Configuration
The following sections cover how to configure and leverage NC2A.
The high-level process can be characterized into the following high-level steps:
- Create AWS Account(s)
- Configure AWS network resources (if necessary)
- Provision cluster(s) via Nutanix Clusters Portal
- Leverage cluster resources once provisioning is complete
- Protect your cluster
Native Backup with Nutanix Cluster Protection
Even when you migrate your application to the cloud, you still must provide all of the same day-two operations as you would if the application was on-premises. Nutanix Cluster Protection provides a native option for backing up Nutanix Cloud Clusters (NC2) running on AWS to S3 buckets, including user data and Prism Central with its configuration data. Cluster Protection backs up all user-created VMs and volume groups on the cluster.
As you migrate from on-premises to the cloud, you can be sure that there is another copy of your applications and data in the event of an AWS Availability Zone (AZ) failure. Nutanix already provides native protection for localized failures at the node and rack level, and Cluster Protection extends that protection to the cluster’s AZ. Because this service is integrated, high-performance applications are minimally affected as the backup process uses native AOS snapshots to send the backup directly to S3.
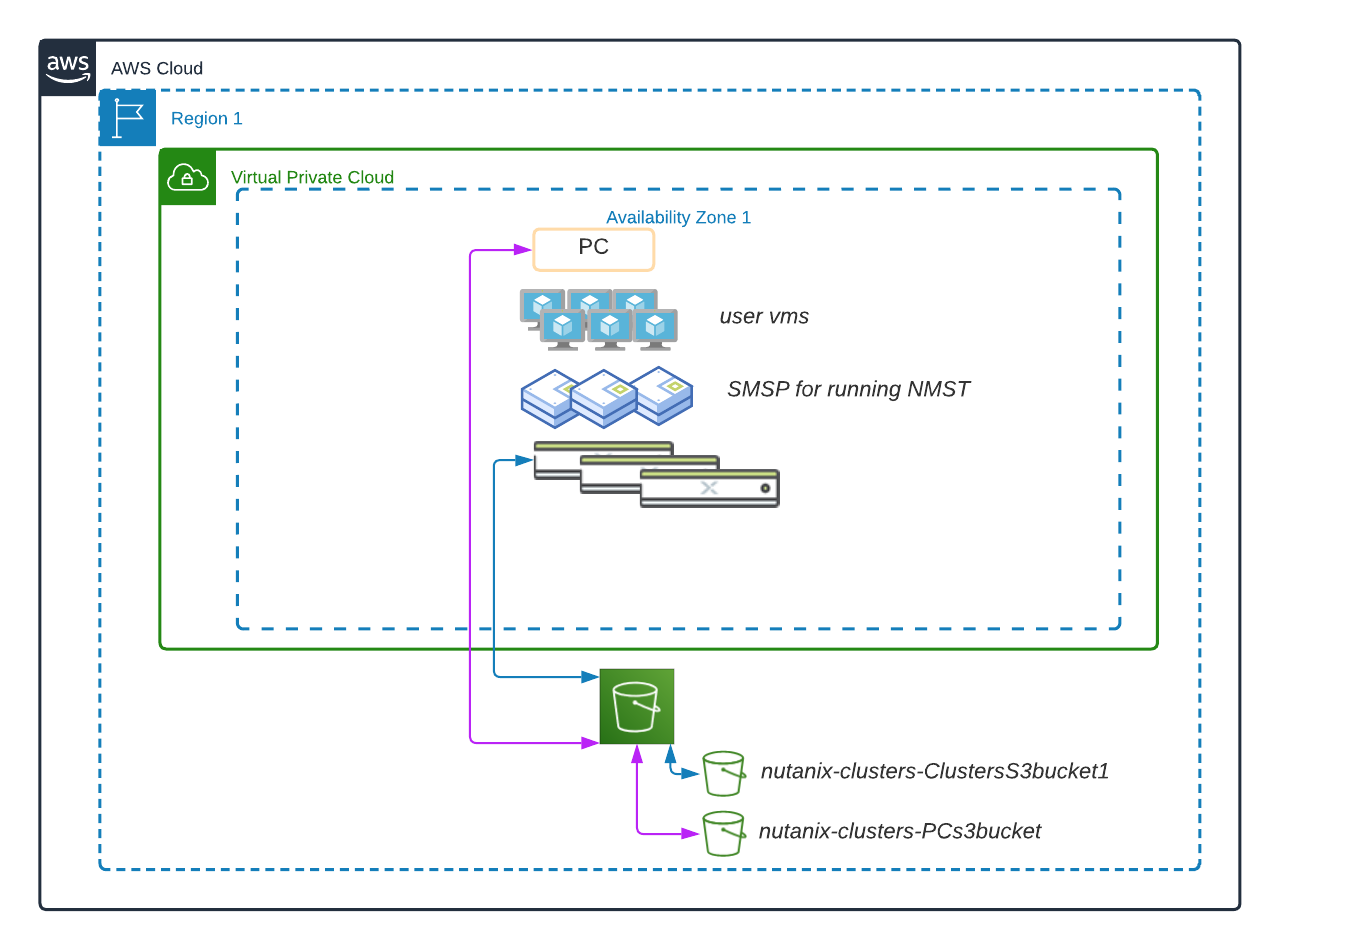
Two Nutanix services help deliver Cluster Protection:
- Prism Central Disaster Recovery is responsible for backing up the Prism Central data. Instead of backing up to an AOS storage container, you can now supply a new S3 bucket to point the backup to.
- Nutanix Multicloud Snapshot Technology (NMST) replicates native Nutanix AOS snapshots to object storage. In the Cluster Protection design, the you supply a second new S3 bucket in AWS to send all the protected clusters’ snapshots to the same S3 bucket. The Cloud Snapshot Engine runs on the Prism Central instance in AWS.
The following high-level process describes how to protect your clusters and Prism Central in AWS.
- Deploy a one- or three-node Prism Central instance in AWS.
- Create two S3 Buckets: one for Prism Central and one for your cloud clusters.
- Enable Prism Central protection.
- Deploy NMST.
- Protect your AWS cloud clusters.
The system takes both the Prism Central and AOS snapshots every hour and retains up to two snapshots in S3. A Nutanix Disaster Recovery category protects all of the user-created VMs and volume groups on the clusters. A service watches for create or delete events and assigns them a Cluster Protection category.
The following high-level process describes how to recover your Prism Central instances and clusters on AWS.
- The NC2 console automatically deploys a new NC2 cluster during the recovery process.
- Add your Prism Central subnet and any user VM networks to your recreated cloud cluster.
- Recover your Prism Central configuration from the S3 bucket.
- Register your Prism Central instance with the recovered cluster.
- Recover NMST.
- Create a recovery plan.
- Run the recovery plan from Prism Central.
Once the NMST is recovered, you can restore using the recovery plan in Prism Central. The recovery plan has all the VMs you need to restore. By using Nutanix Disaster Recovery with this new service, administrators can easily recover when disaster strikes.
Nutanix Disaster Recovery to S3 With NMST, you can send AOS snapshots from any Nutanix-based cluster to S3. This feature allows you to offload snapshots that you don’t regularly access or applications that have higher recovery time objectives (RTOs) to optimize performance and capacity in the primary storage infrastructure.
When you use NMST on an NC2 cluster with at least three nodes (which we refer to as a pilot cluster), NMST redirects the AOS snapshots to S3. You can recover snapshots to the NC2 cluster or back to the primary site if a healthy Nutanix cluster is available. If you need additional space to recover the S3-based snapshots to the NC2 cluster, you can add more nodes to the cluster using the NC2 portal or the NC2 portal API.
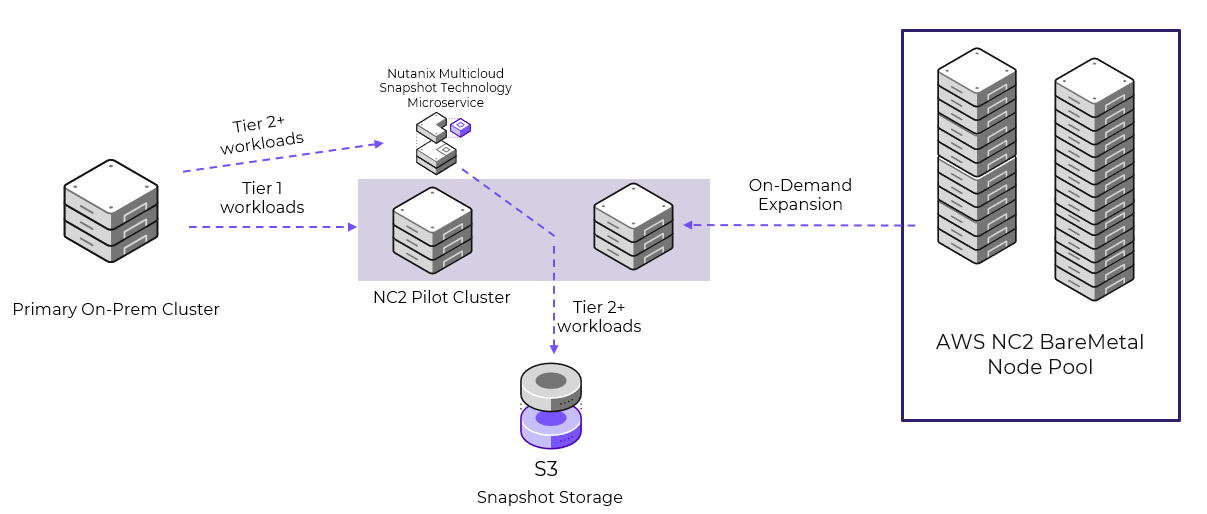
This model supports fast RTOs for tier-1 applications by sending snapshots directly to the pilot cluster for quick restores and using S3 to store snapshots for tier-2 applications. Combined with using EBS as additional storage for tier-1 applications, this model can drastically reduce business costs while meeting requirements.
» Download this section as PDF (opens in a new tab/window)
Nutanix Cloud Clusters (NC2) on Azure provides on-demand clusters running in target cloud environments using bare metal resources. This allows for true on-demand capacity with the simplicity of the Nutanix platform you know. Once provisioned the cluster appears like any traditional AHV cluster, just running in a cloud provider’s datacenter(s).
Supported Configurations
The solution is applicable to the configurations below (list may be incomplete, refer to documentation for a fully supported list):
Core Use Case(s):
- On-Demand / burst capacity
- Backup / DR
- Cloud Native
- Geo Expansion / DC consolidation
- App migration
- Etc.
Management interfaces(s):
- Nutanix Clusters Portal - Provisioning
- Prism Central (PC) - Nutanix Management
- Azure Portal - Azure Management
Supported Environment(s):
- Cloud:
- AWS
- Azure
- Bare Metal Instance Types:
- AN36
- AN36P
- AN64
Upgrades:
- Part of AOS
Compatible Features:
- AOS Features
- Azure Services
Key terms / Constructs
The following key items are used throughout this section and defined in the following:
- Nutanix Clusters Portal
- The Nutanix Clusters Portal is responsible for handling cluster provisioning requests and interacting with Azure and the provisioned hosts. It creates cluster specific details and handles the cluster creation and helps to remediate hardware problems.
- Region
- A geographic landmass or area where multiple Availability Zones (sites) are located. A region can have two or more AZs. These can include regions like East US (Virginia) or West US 2 (Washington).
- Availability Zone (AZ)
- An AZ consists of one or more discrete datacenters interconnected by low latency links. Each site has its own redundant power, cooling, network, etc. Comparing these to a traditional colo or datacenter, these would be considered more resilient as a AZ can consist of multiple independent datacenters.
- VNet
- A logically isolated segment of the Azure cloud for tenants. Provides a mechanism to secure and isolate environment from others. Can be exposed to the internet or other private network segments (other VNets, or VPNs).
Cluster Architecture
From a high-level the Nutanix Clusters (NC2) Portal is the main interface for provisioning Nutanix Clusters on Azure and interacting with Azure.
The provisioning process can be summarized with the following high-level steps:
- Create cluster in NC2 Portal
- Deployment specific inputs (e.g. Region, AZ, Instance type, VNets/Subnets, etc.)
- The NC2 Portal creates associated resources
- Host agent running on AHV checks-in with Nutanix Clusters on Azure
- Once all hosts as up, cluster is created
The following shows a high-level overview of the NC2 on Azure interaction:
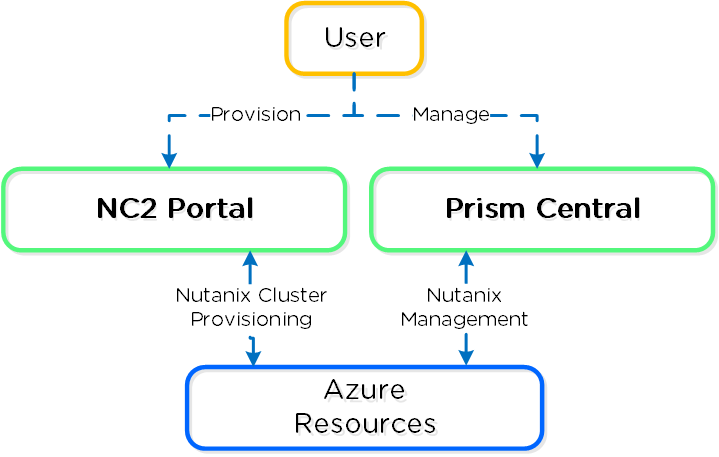 NC2 on Azure - Overview
The following shows a high-level overview of a the inputs taken by the NC2 Portal and some created resources:
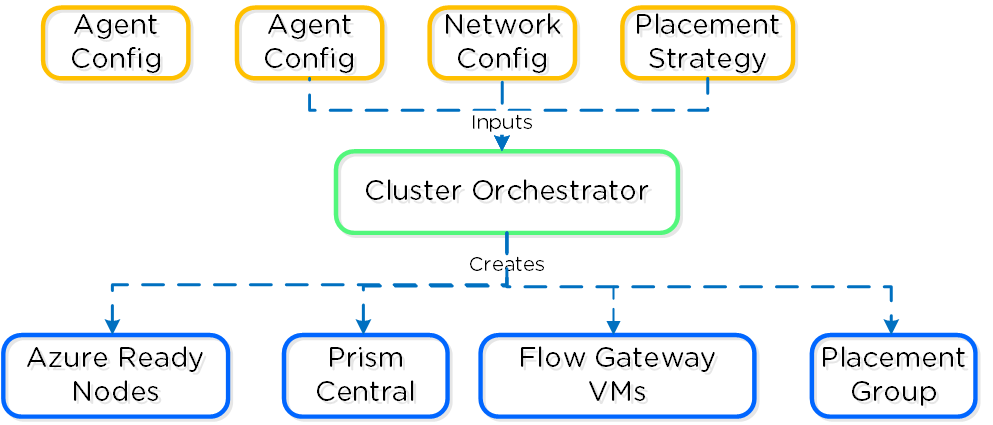 Nutanix Clusters on Azure - Cluster Orchestrator Inputs
Node Architecture
Given the hosts are bare metal, we have full control over storage and network resources similar to a typical on-premises deployment. We are consuming Ready Nodes as our building blocks. Unlike AWS, Azure-based nodes are not consuming any additional services for the CVM or AHV.
Placement policy
Nutanix Clusters on Azure uses a partition placement policy with 7 partitions by default. Hosts are striped across these partitions which correspond with racks in Nutanix. This ensures you can have 1-2 full “rack” failures and still maintain availability.
The following shows a high-level overview of the partition placement strategy and host striping:
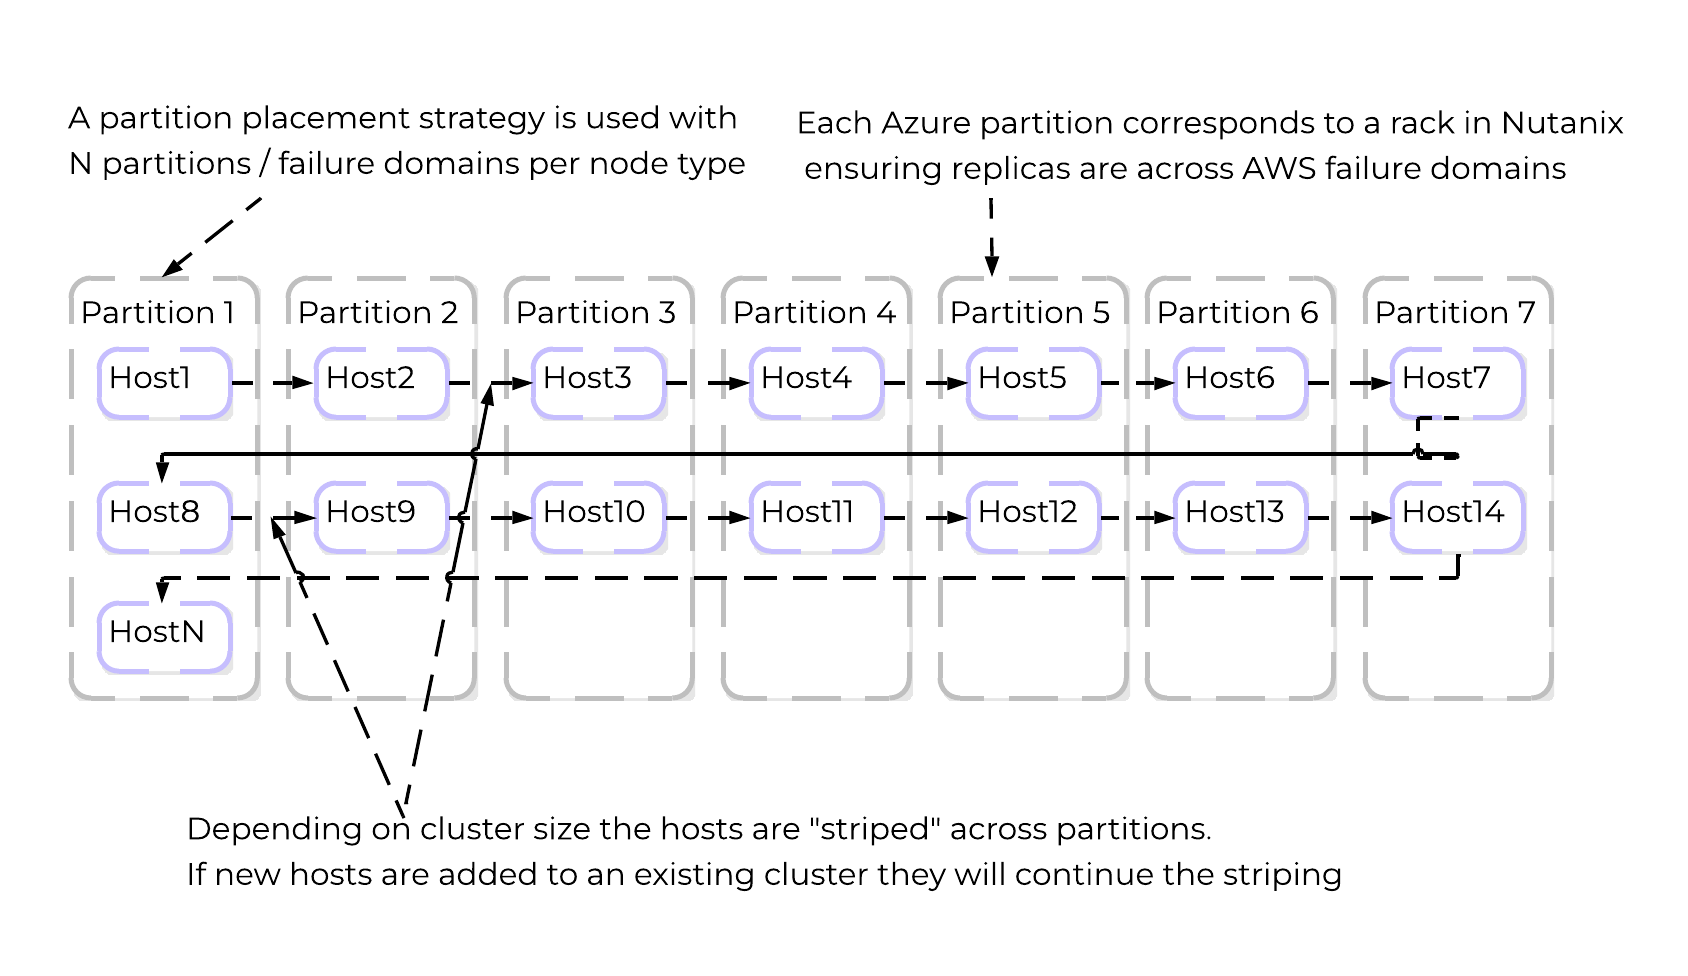 NC2 on Azure - Partition Placement
Storage
Core storage is the exact same as you’d expect on any Nutanix cluster, passing the “local” storage devices to the CVM to be leveraged by Stargate.
Note
Instance Storage
Given that the "local" storage is backed by the local flash, it is fully resilient in the event of a power outage.
Networking
NC2 utilizes Flow Virtual Networking in Azure to create an overlay network to ease administration for Nutanix administrators and reduce networking constraints across Cloud vendors. Flow Virtual Networking is used to abstract the Azure native network by creating overlay virtual networks. On the one hand this abstracts the underlying network in Azure, while at the same time, it allows the network substrate (and its associated features and functionalities) to be consistent with the customer’s on-premises Nutanix deployments. You will be able to create new virtual networks (called Virtual Private Clouds or VPCs) within Nutanix, subnets in any address range, including those from the RFC1918 (private) address space and define DHCP, NAT, routing, and security policy right from the familiar Prism Central interface.
Flow Virtual Networking can mask or reduce Cloud constraints by providing an abstraction layer. As an example, Azure only allows for one delegated subnet per VNet. Subnet delegation enables you to designate a specific subnet for an Azure PaaS service of your choice that needs to be injected into your virtual network. NC2 needs a management subnet delegated to the Microsoft.BareMetal/AzureHostedService. Once your subnet is delegated to the BareMetal service the Clusters Portal will be able to use that subnet to deploy your Nutanix Cluster. The AzureHostedService is what the Clusters portal uses to deploy and configure networking on the bare-metal nodes.
Every subnet used for user native VM networking also needs to be delegated to the same service. Since a VNet can only have one delegated subnet, networking configuration would get out of hand with needing to peer VNets among each other to allow communication. With Flow Virtual Networking we can drastically reduce the amount of VNets needed to allow communication of the workloads running on Clusters and Azure. Flow Virtual Networking will allow you to create over 500 subnets while only consuming 1 Azure VNet.
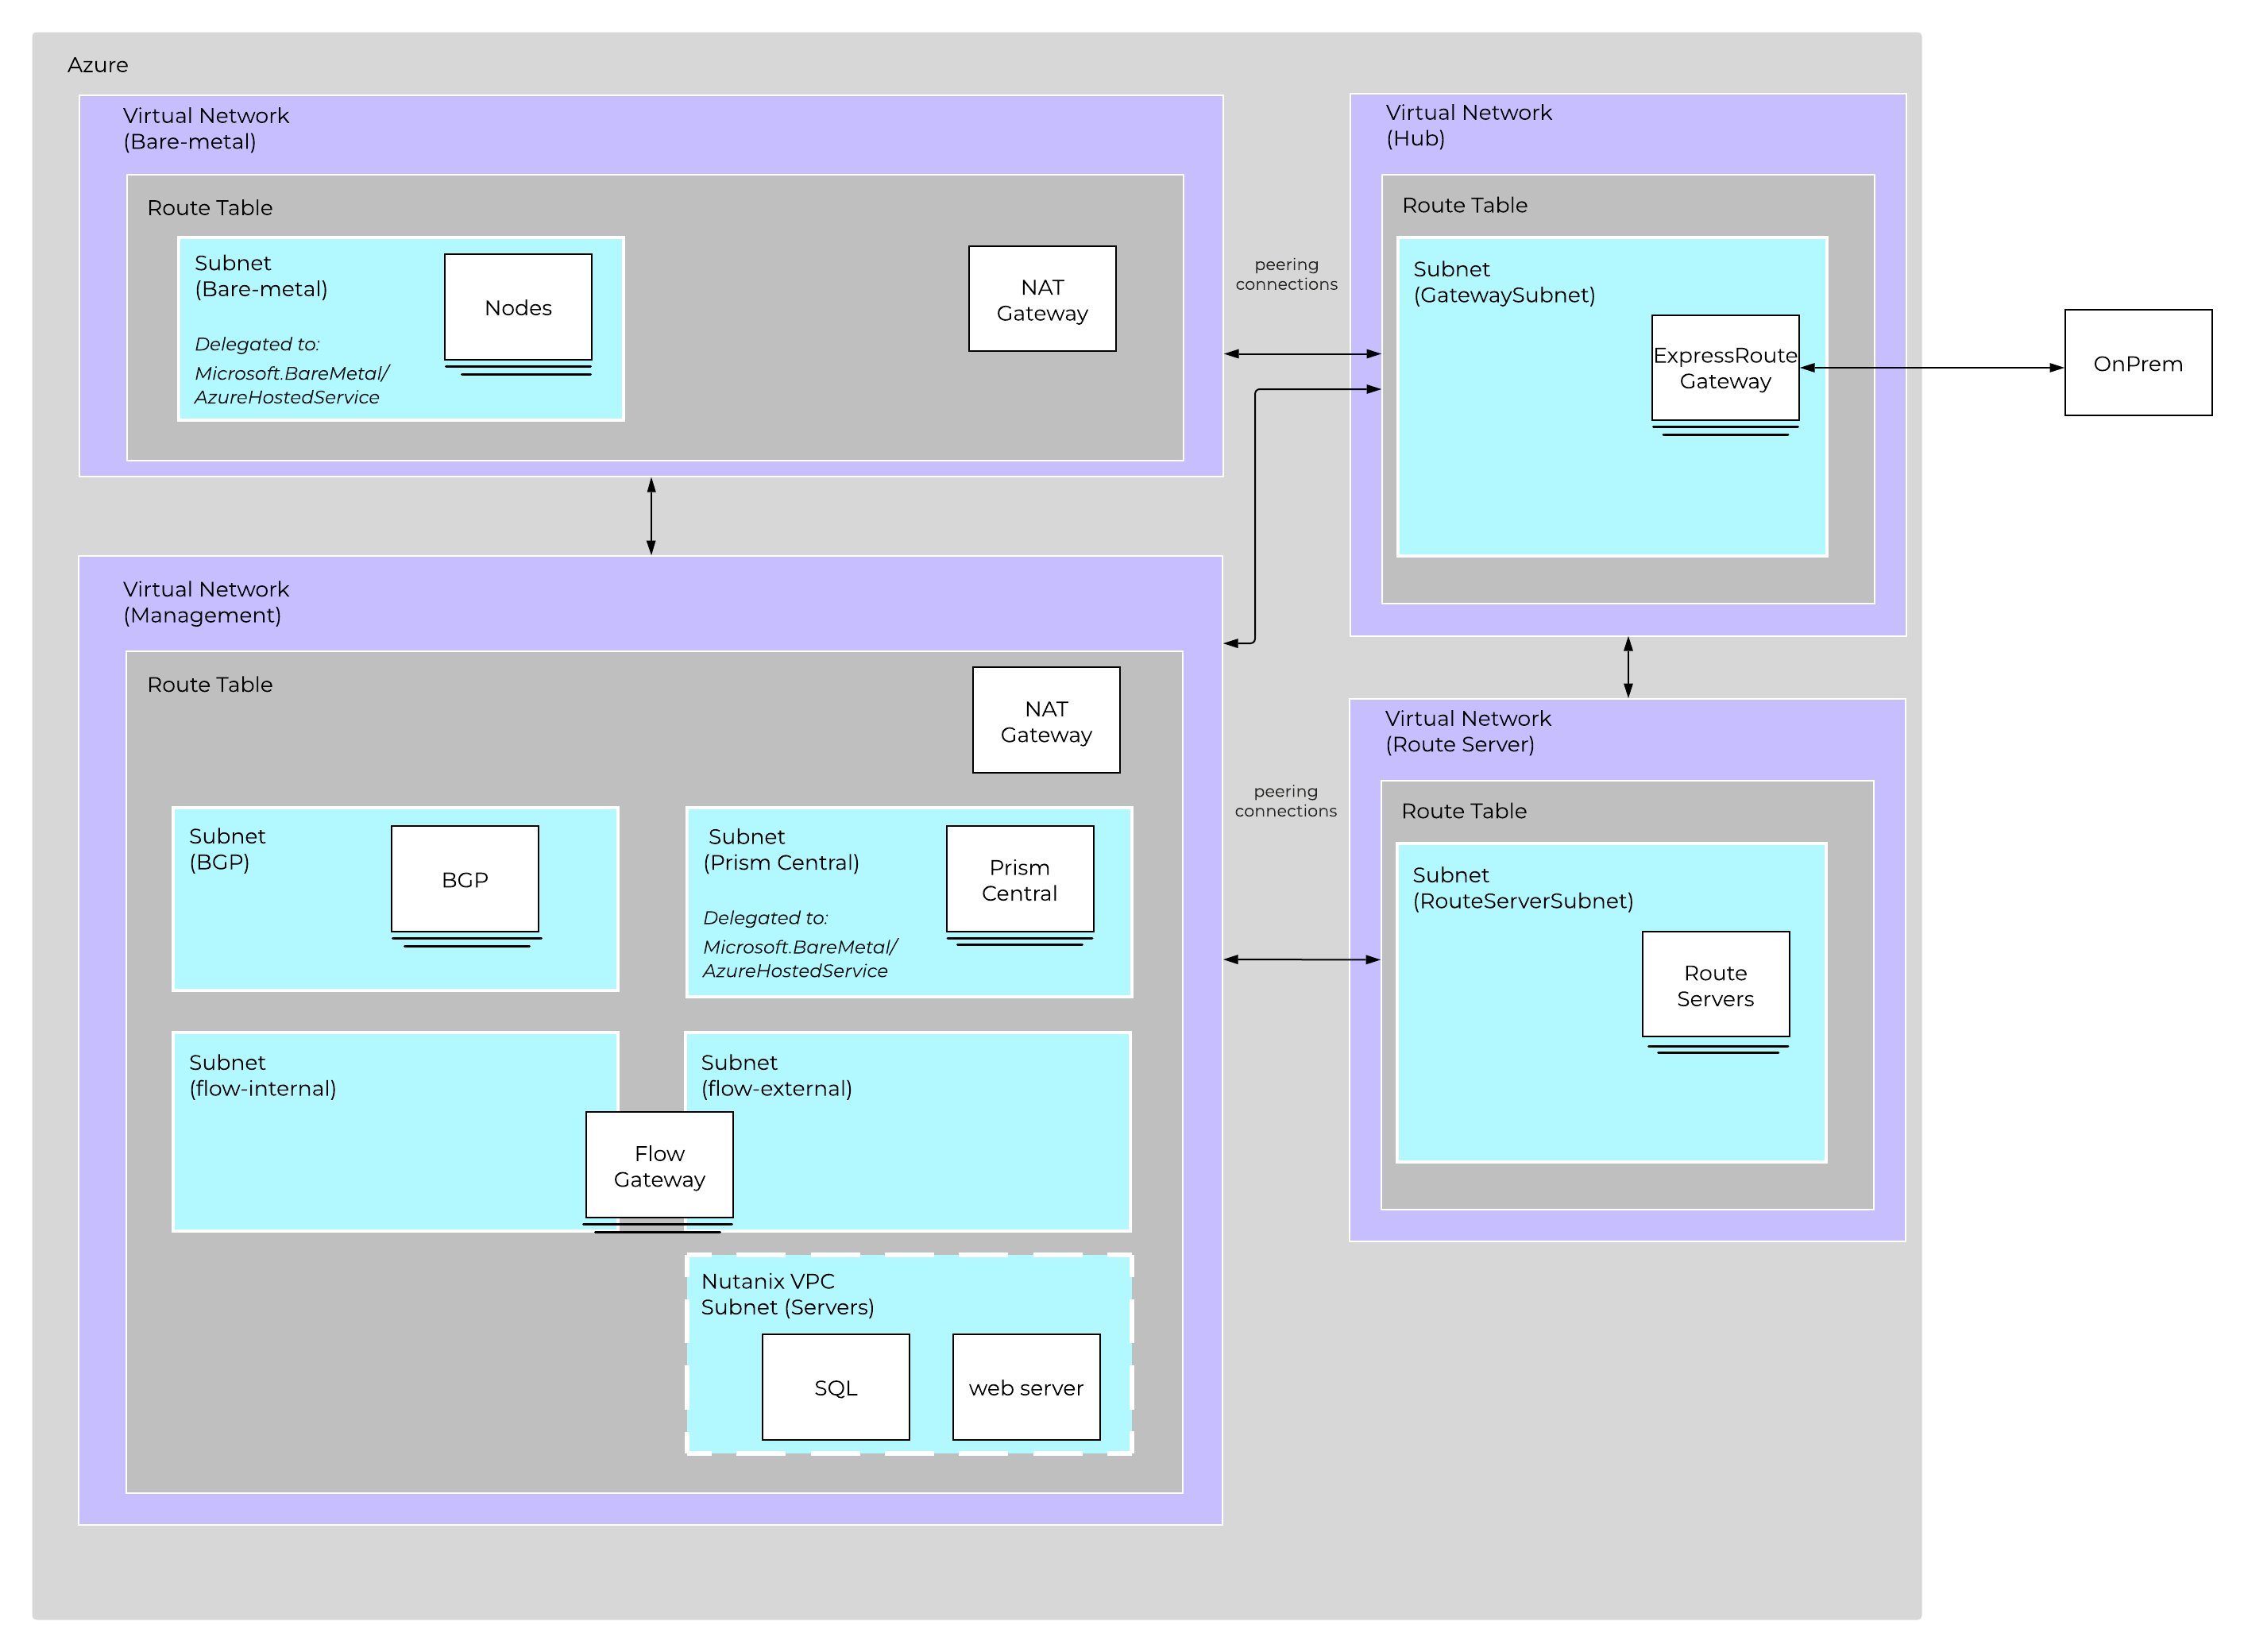
It is recommended to create a new VPC with associated subnets, NAT/Internet Gateways, etc. that fits into your corporate IP scheme. This is important if you ever plan to extend networks between VPCs (VPC peering), or to your existing WAN. I treat this as I would any site on the WAN.
Prism Central (PC) will be deployed onto the Nutanix Cluster after deployment. Prism Central contains the control plane for Flow Virtual Networking. The subnet for PC will be delegated to the Microsoft.BareMetal/AzureHostedService so native Azure networking can be used to distribute IPs for PC. Once PC is deployed, the Flow Gateway will be deployed into the same subnet PC is using. The Flow Gateway allows the User VMs using the Flow VPC(s) to communicate to native Azure services and allows the VMs to have parity with native Azure VMs, such as:
- User defined routes - You can create custom, or user-defined (static), routes in Azure to override Azure’s default system routes, or to add additional routes to a subnet’s route table. In Azure, you create a route table, then associate the route table to zero or more virtual network subnets.
- Load Balancer Deployment - The ability to front-end services offered by UVMs with Azure-native load balancer.
- Network Security Groups - The ability to write stateful firewall policies.
The Flow Gateway VM is responsible for all VM traffic going north and south bound from the cluster. During deployment you can pick different sizes for the Flow Gateway VM based on how much bandwidth you need. It’s important to realize that CVM replication between other CVMs and on-prem do not flow through the Flow Gateway VM so you don’t have to size for that traffic.
Flow Virtual Networking Gateway VM High Availability
When you initially deploy your first cluster, you’re able to choose how many FGW VMs you want to create (2 - 4). Prior to AOS 6.7, If you deploy only one gateway VM, the NC2 portal redeploys a new FGW VM with an identical configuration when it detects that the original VM is down. Because this process invokes various Azure APIs, it can take about 5 minutes before the new FGW VM is ready to forward traffic, which can affect the north-south traffic flow.
To reduce this downtime, NC2 on Azure has moved to an active-active configuration. This setup provides a flexible scale-out configuration when you need more traffic throughput.
The following workflow describes what happens when you turn off a FGW VM gracefully for planned events like updates.
- The NC2 portal disables the FGW VM.
- Prism Central removes the VM from the traffic path
- The NC2 portal deletes the original VM and creates a new FGW VM with an identical configuration.
- The NC2 portal registers the new instance with Prism Central.
- Prism Central adds the new instance back to the traffic path.
For ungraceful or unplanned failures, the NC2 portal and Prism Central both have their own detection mechanisms based on keepalives. They take similar actions to those for the graceful or planned cases.
Network Address Translation (NAT): UVMs that want to communicate with AHV/CVM/PC and Azure resources will flow though the external network card on the Flow Gateway VM. The NAT provided uses native Azure address to ensure routing to all resources. User defined routes in Azure can be used to talk directly to Azure resources if using a NAT is not preferred. This allows for fresh installs to communicate with Azure right away but also gives customers options for more advanced configurations.
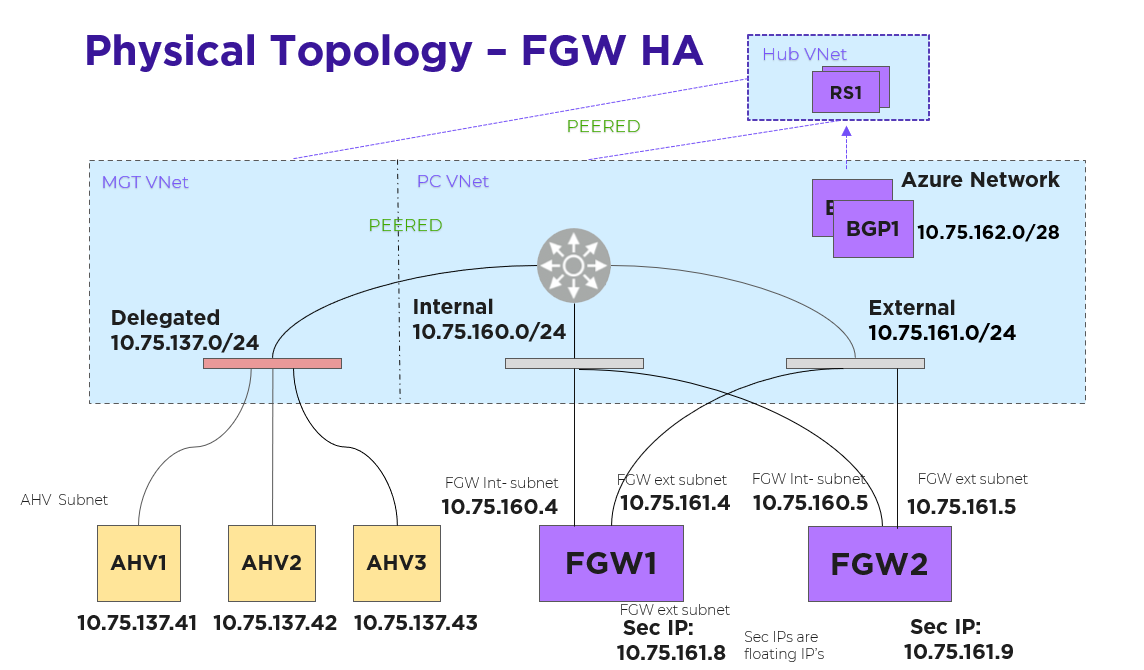
Each FGW instance has two NICs: one on the internal subnet that exchanges traffic with AHV and another on the external subnet that exchanges traffic with the Azure network. Each FGW instance registers with Prism Central and is added to the traffic path. A point-to-point external subnet is created for each FGW and the transit VPC is attached to it, with the FGW instance hosting the corresponding logical-router gateway port. In the following diagram, EN-NONAT1 and EN-NONAT2 are the point-to-point external subnets.
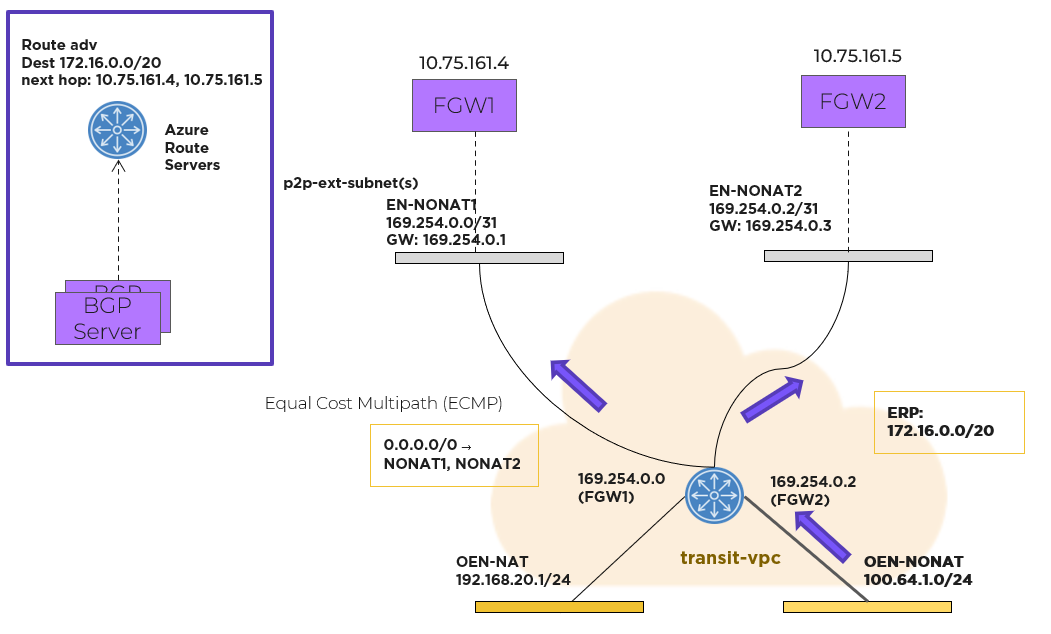
Flow Virtual Networking Gateway Using the NoNAT Path
For northbound traffic, the transit VPC has an equal-cost multi-path (ECMP) default route, with all the point-to-point external subnets as possible next hops. In this case, the transit VPC distributes traffic across multiple external subnets hosted on different FGWs.
For southbound traffic using more than one FGW, a Border Gateway Protocol (BGP) gateway is deployed as an Azure native VM instance in the Prism Central Virtual Network (VNet). Azure Route Servers deploy in the same Prism Central VNet. With an Azure Route Server, you can exchange routing information directly through BGP between any network virtual appliance that supports BGP and the Azure VNet without the need to manually configure or maintain route tables.
The BGP gateway peers with the Azure Route Servers. The BGP gateway advertises the externally routable IP addresses to the Azure Route Server with each active FGW external IP address as the next hop. Externally routable IP addresses compose the address range that you’ve created and want advertised to the rest of the network in your Flow Virtual Networking user VPCs. Once the externally routable IP address is set in Prism Central at the user VPC, the Azure network distributes southbound packets across all the FGW instances.
Prism Central determines which FGW instance should host a given NAT IP address and then configures each NAT IP address as a secondary IP address on each FGW. Packets sourced from those IP addresses can be forwarded through the corresponding FGW only. No NAT traffic distributes across all FGWs.
NAT traffic originating from the Azure network and destined to a floating IP address goes to the FGW VM that owns the IP address because Azure knows which NIC currently has it.
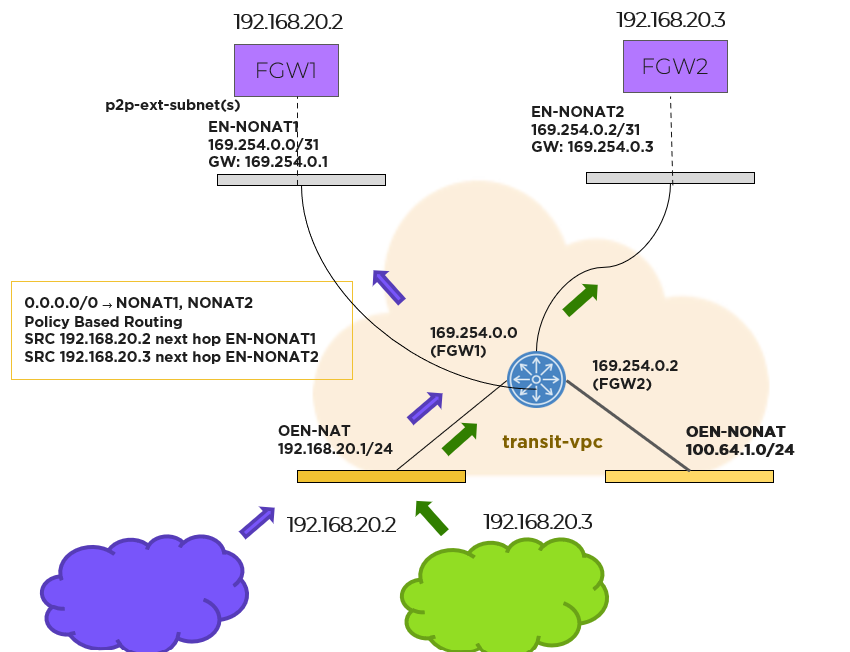
Prism Central uses policy-based routing to support forwarding based on the source IP address matching the floating IP address. The custom forwarding policy-based routing rules built into Flow Virtual Networking are used to auto install routes in the transit VPC.
Host Networking
The hosts running on baremetal in Azure are traditional AHV hosts, and thus leverage the same OVS based network stack.
The following shows a high-level overview of a Azure AHV host’s OVS stack:
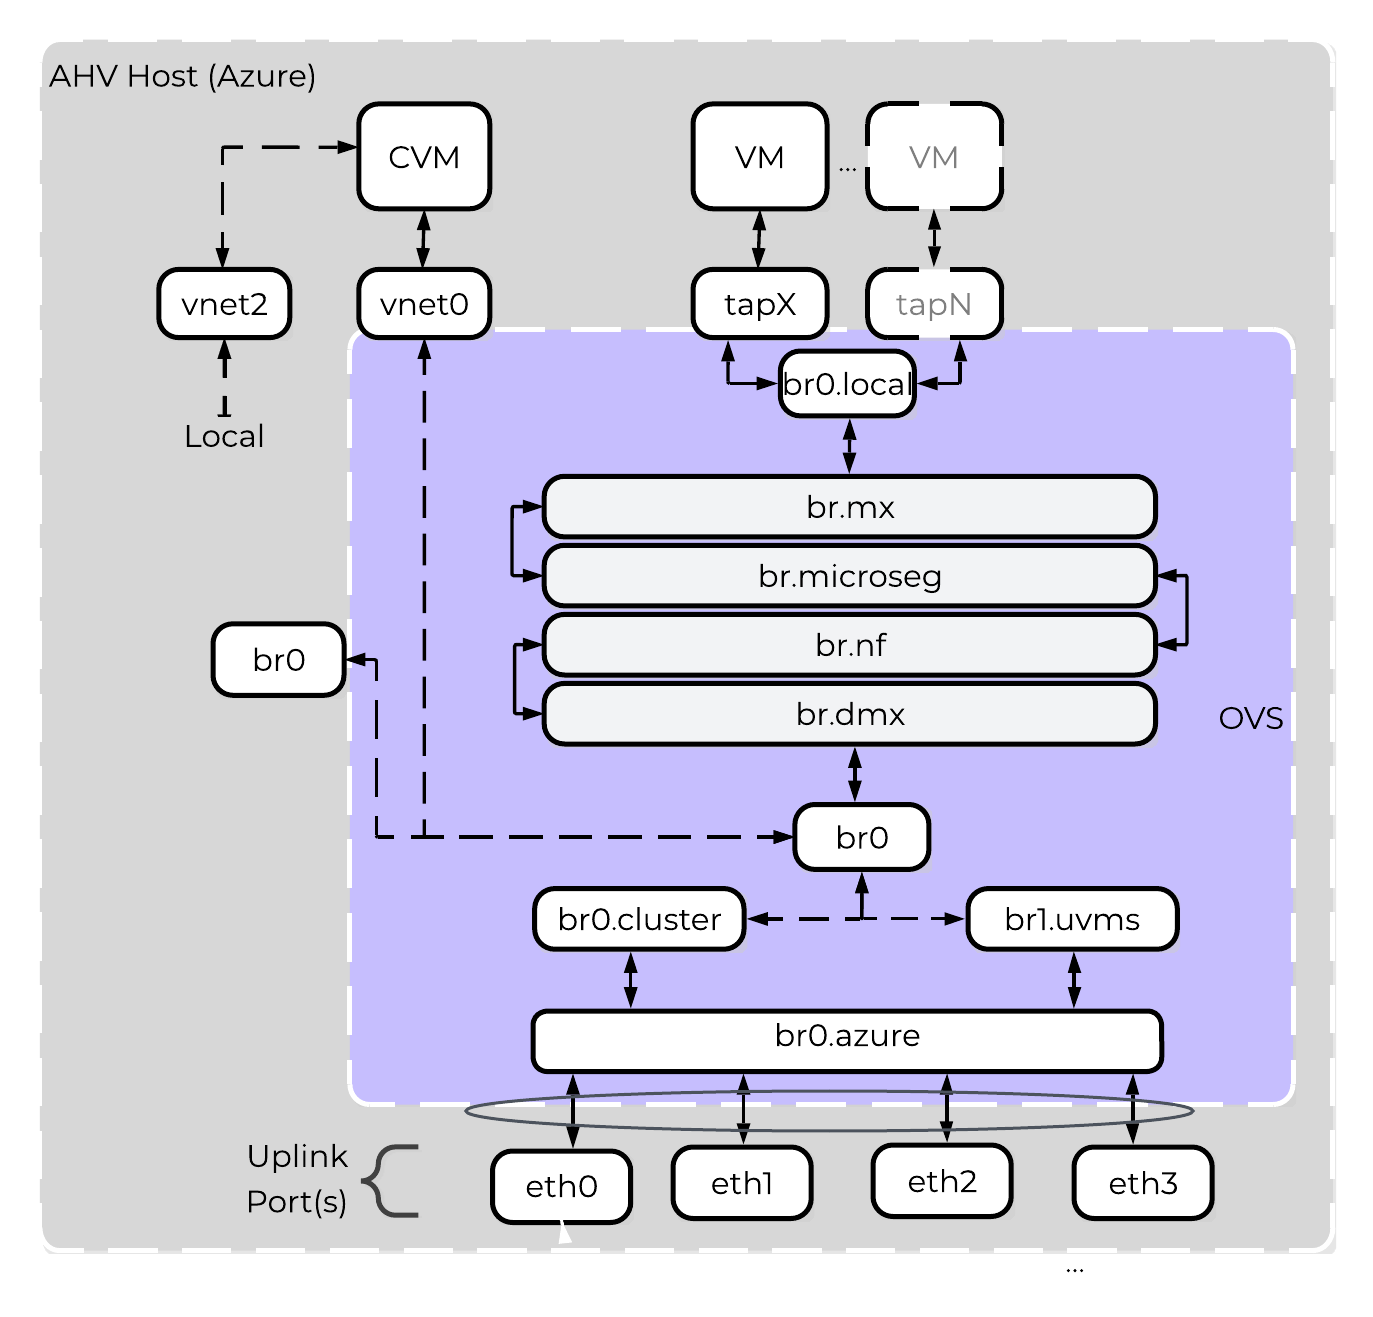 NC2 on Azure - Host Networking
Nutanix’s Open vSwitch implementation is very similar to the on-premises implementation. The above diagrams shows an internal architecture of the AHV that is deployed onto the bare-metal. Br0 bridge will split traffic between br0.cluster (AHV/CVM IPs) and br0.uvms(User VMs IPs).
For AHV/CVM traffic via br0.cluster, it will be a simple pass-through to br0.azure bridge, with no modification to data packets. The top of rack switching is providing the security for br0.cluster traffic. For UVM IPs traffic will flow via br0.uvms, OVS rules would be installed for vlan-id translation and pass-through traffic to br0.azure.
br0.azure will have OVS bond br0.azure-up which will form a bonded interface with bare-metal attached physical nics. Thus, br0.azure hides the bonded interface from br0.uvms and br0.cluster.
Creating a Subnet
Subnets you create will have its own built in IPAM and you will have the option to stretch your network from on-prem into Azure. If outside applications need to talk directly your UVM inside the subnet you also have the option to assign floating IPs from a pool of IPs from Azure that will come from the external network of the Flow Gateway.
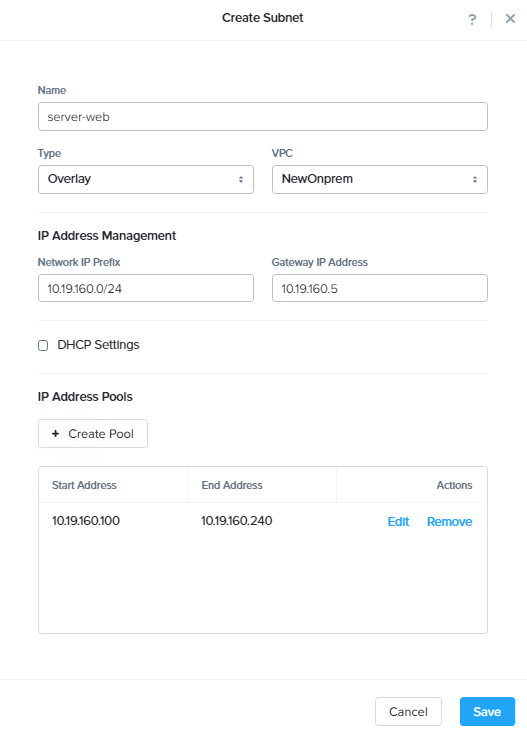 NC2 on Azure - IPAM with Azure
For a successful deployment, Nutanix Clusters needs outbound access to the NC2 portal, either using an NAT gateway or an on-prem VPN with outbound access. Your Nutanix cluster can sit in a private subnet that can only be accessed from your VPN, limiting exposure to your environment.
Protecting Workloads with Nutanix Multicloud Snapshots
Nutanix Multicloud Snapshot Technology (NMST) replicates native Nutanix AOS snapshots to object storage, AWS S3, and Azure Blob Storage. NMST Engine runs on Prism alongside Prism Central. This feature allows you to offload snapshots that you don’t regularly access or applications that have higher recovery time objectives (RTOs) to optimize performance and capacity in the primary storage infrastructure. You can then recover workloads using a zero-compute (on-demand deployment of a Nutanix cluster on-premises or in Azure) or pilot-light (on-demand expansion of NC2 deployment) model, based on your needs.
Zero-Compute Deployment
Zero compute is an on-demand Nutanix cluster deployment model where the NMST service runs alongside the protected workloads. With this model in Azure, you can replicate snapshots directly to Azure Blob Storage for storing and recovering less critical workloads, which can accommodate longer RTOs. In the event of a failover, you can quickly use the replicated snapshot to deploy an on-demand Nutanix cluster on-premises or in Azure for recovery.
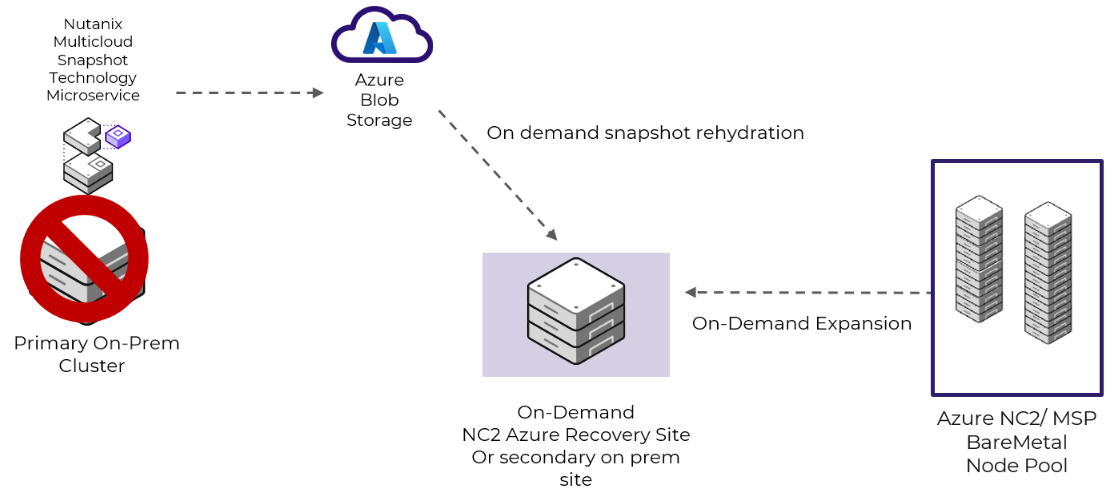 Zero-Compute Snapshot Storage with Nutanix Multicloud Snapshot Technology
Pilot-Light Deployment
In a pilot-light deployment, the NMST service runs on an NC2 deployment with at least three nodes. NMST redirects the AOS snapshots to Azure Blob Storage. You can recover snapshots to the NC2 deployment or back to the primary site if a healthy Nutanix cluster is available. If you need additional space to recover the Azure Blob Storage–based snapshots to the NC2 deployment, you can add more nodes to the cluster using the NC2 console or the NC2 console API.
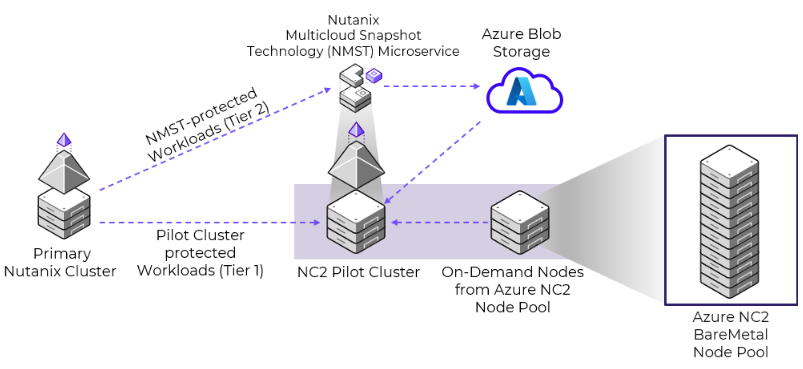
This model supports fast RTOs for tier-1 applications. It sends snapshots directly to the pilot cluster for quick restores and uses Azure Blob Storage to store snapshots for tier-2 applications.
WAN / L3 Networking
In most cases deployments will not be just in Azure and will need to communicate with the external world (Other VNets, Internet or WAN).
For connecting VNets (in the same or different regions), you can use VPC peering which allows you to tunnel between VPCs. NOTE: you will need to ensure you follow WAN IP scheme best practices and there are no CIDR range overlaps between VNets / subnets.
For network expansion to on-premises / WAN, either a VNet gateway (tunnel) or Express Route can be leveraged.
Usage and Configuration
The following sections cover how to configure and leverage NC2 on Azure.
The high-level process can be characterized into the following high-level steps:
- Setup up an active Azure subscription.
- Create a My Nutanix account & subscribe to NC2.
- Register Azure resource providers.
- Create an app registration in Azure AD with “Contributor” access to the new subscription
- Configure DNS.
- Create a resource group or re-use an existing resource group.
- Create required VNets and required subnets.
- Configure two NAT gateways.
- Establish the VNet peering required for the Nutanix cluster.
- Add your Azure account to the NC2 console.
- Create a Nutanix Cluster in Azure by using the NC2 console.
More to come!
» Download this section as PDF (opens in a new tab/window)
NC2 now extends NCP into the Google Cloud ecosystem, providing a true hybrid multicloud infrastructure stack. NC2 on Google Cloud allows organizations to run directly on Google Compute Engine (GCE) bare-metal instances in their own Google Cloud Virtual Private Cloud (VPC).
Supported Configurations
The solution is applicable to the configurations below (list may be incomplete, refer to documentation for a fully supported list):
Core Use Case(s):
- On-Demand / burst capacity
- Backup / DR
- Cloud Native
- Geo Expansion / DC consolidation
- App migration
Management interfaces(s):
- Nutanix Clusters Portal - Provisioning
- Prism Central (PC) - Nutanix Management
- Google Cloud Console - Google Cloud Management
Supported Environment(s):
- Cloud:
- AWS
- Azure
- Google Cloud
- Bare Metal Instance Types:
- Z3 High Memory
- C4 High Memory
- C4 Standard
Upgrades:
- Part of AOS
Compatible Features:
- AOS Features
- Google Cloud Services
Key terms / Constructs
Nutanix Cloud Clusters (NC2) on Google Cloud integrates Nutanix Cloud Platform (NCP) with the underlying Google Cloud infrastructure. The solution uses the following components:
- NC2 Portal
- The NC2 Portal is a multicloud control plane used to deploy, manage, expand, and shrink NC2 clusters in supported public clouds, including Google Cloud. The NC2 Portal is responsible for handling cluster provisioning requests and interacting with Google Cloud and the provisioned hosts. It creates cluster specific details and handles the cluster creation and helps to remediate hardware problems.
- Region
- A geographic landmass or area where multiple Availability Zones (sites) are located. A region can have two or more AZs. These can include regions like “us-central1” (Iowa) or us-east1 (South Carolina).
- Availability Zone (AZ)
- An AZ consists of one or more discrete datacenters interconnected by low latency links. Each site has its own redundant power, cooling, network, etc. Comparing these to a traditional colo or datacenter, these would be considered more resilient as a AZ can consist of multiple independent datacenters.
- Google Compute Engine bare-metal instances
- Google Compute Engine (GCE) provides the bare-metal instances on which the NCP solution runs. These bare-metal instances appear in the Google Cloud Console like any other GCE instances and are distinct from the Google Bare Metal Solution that is not supported with NC2. Nutanix AHV runs directly on the GCE bare-metal instances, providing the foundation for running VMs.
- Google Cloud Project
- A Google Cloud project is the fundamental organizing entity for all your resources, APIs, billing, and permissions on Google Cloud.
- Virtual Private Cloud (VPC)
- A logically isolated segment of the Google Cloud Cloud within a project. Provides a mechanism to secure and isolate environment from others. Can be exposed to the internet or other private network segments (other VPCs, or VPNs).
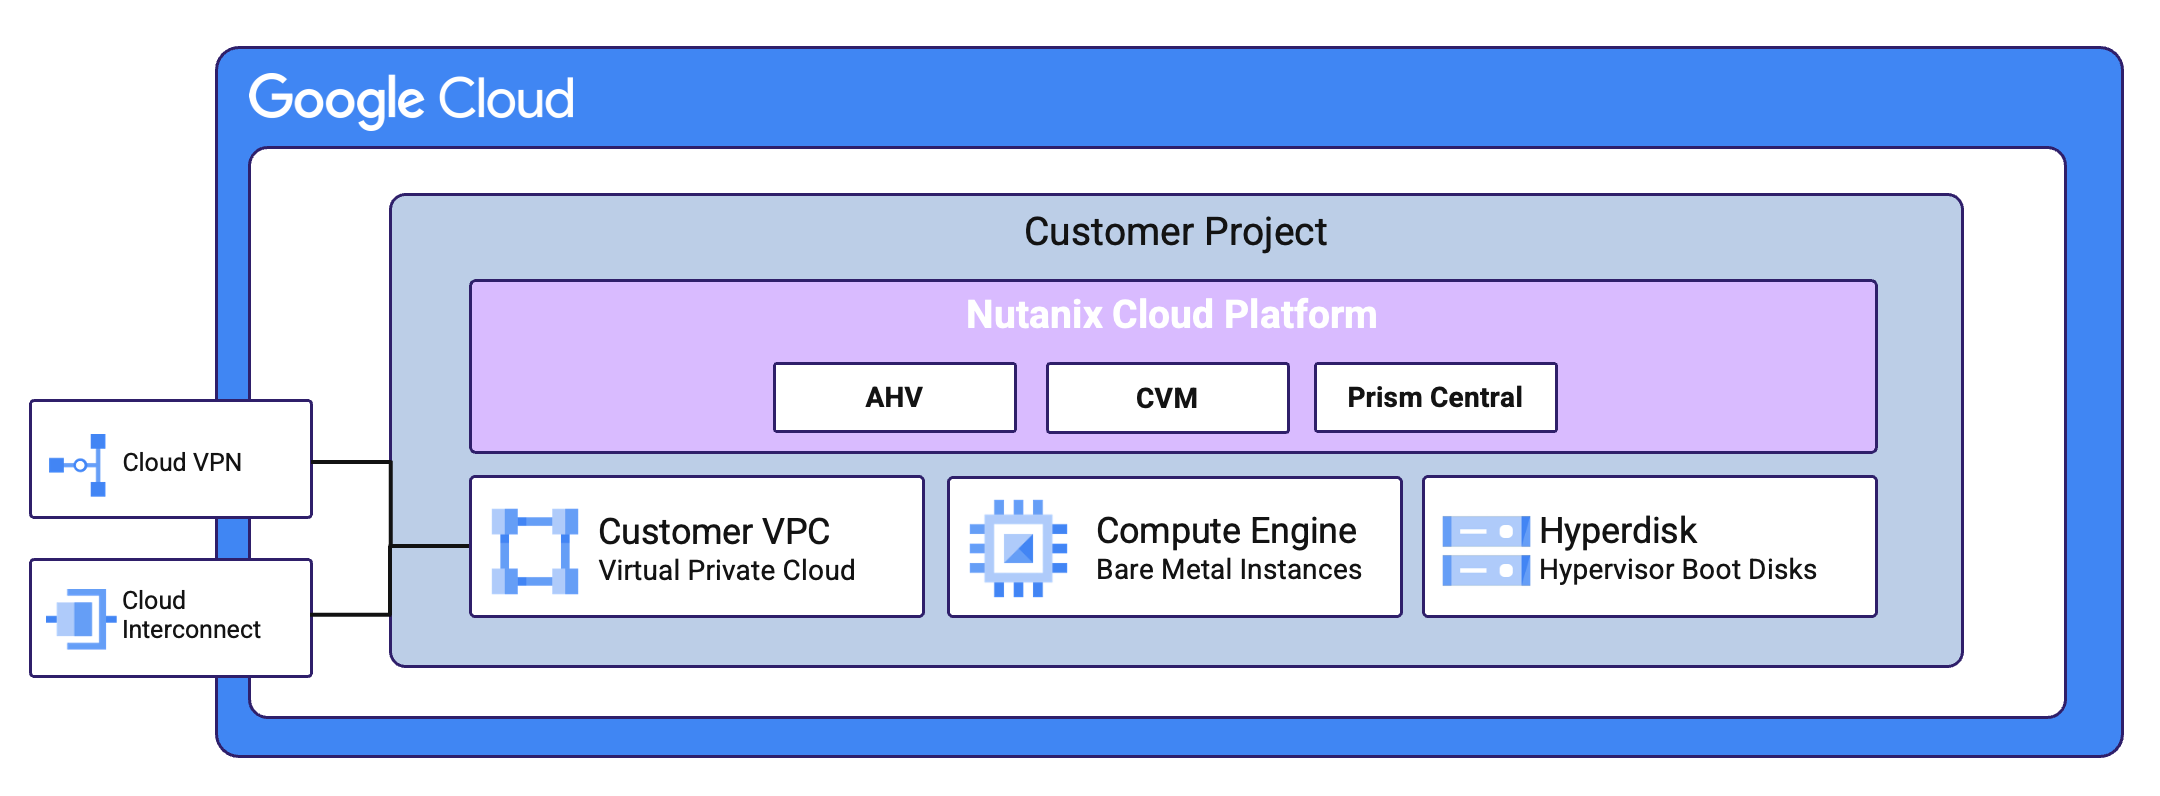 NC2 on Google Cloud - Overview
Solution Architecture
From a high-level the NC2 Portal is the main interface for provisioning Nutanix Clusters on Google Cloud and interacting with Google Cloud.
The provisioning process can be summarized with the following high-level steps:
- Create a cluster in NC2 Portal
- Deployment specific inputs (e.g. Region, AZ, Instance type, VPCs/Subnets, etc.)
- The NC2 Portal creates associated resources
- Host agent running on AHV checks-in with Nutanix Clusters on Google Cloud
- Once all hosts as up, cluster is created
The following shows a high-level overview of the NC2 on Google Cloud interaction:
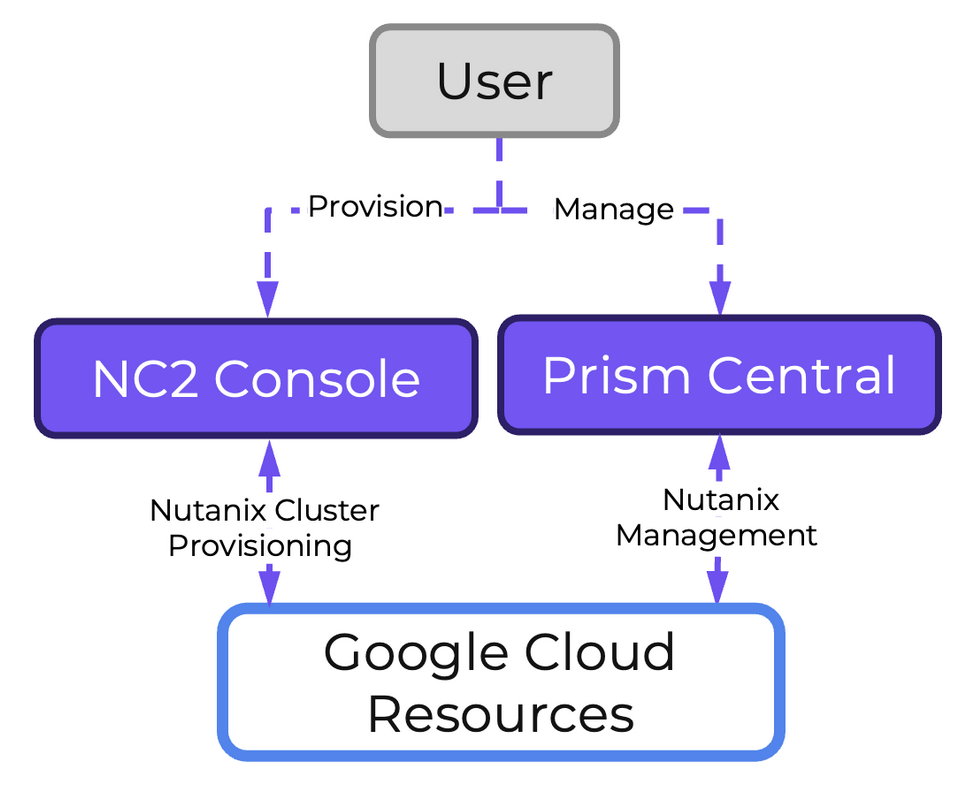 NC2 on Google Cloud - Management
Node Architecture
Given that the hosts are bare metal, the solution has full control over storage and network resources similar to a typical on-premises Nutanix deployment, witht he exception that Google Cloud’s Hyperdisk service is used to provide the AHV Hypervisor boot volumes.
Placement policy
Nutanix Clusters on Google Cloud uses a partition placement policy with 7 partitions. Hosts are striped across these partitions which correspond with racks in an on premises Nutanix deployment. This ensures you can have 1 or 2 (with a 2N/2D configuration) full “rack” failures and still maintain availability.
Storage
Core storage is the exact same as you’d expect on any Nutanix cluster, passing the “local” storage devices to the CVM to be leveraged by Stargate.
Networking
NC2 utilizes Flow Virtual Networking in Google Cloud to create an overlay network to ease administration for Nutanix administrators and reduce networking constraints across Cloud vendors. Flow Virtual Networking is used to abstract the Google Cloud native network by creating overlay virtual networks. On the one hand this abstracts the underlying network in Google Cloud, while at the same time, it allows the network substrate (and its associated features and functionalities) to be consistent with the customer’s on-premises Nutanix deployments. You will be able to create new virtual networks (called Virtual Private Clouds or VPCs) within Nutanix, subnets in any address range, including those from the RFC1918 (private) address space and define DHCP, NAT, routing, and security policy right from the familiar Prism Central interface.
You can deploy Nutanix Cloud Clusters (NC2) on Google Cloud into an existing Google Cloud Virtual Private Cloud (VPC) and its subnets, or you can create a VPC and subnets specifically for NC2 in a project at deployment. VMs and containers running on the cluster can connect to the internet, native Google Cloud services, and on-premises datacenters using WAN networking (virtual private network, Google Cloud Router, Multiprotocol Label Switching).
Flow Virtual Networking for NC2 on Google Cloud has the following capabilities:
-
Flow Virtual Networking creates an overlay network for user VMs, allowing you to create virtual networks (VPCs) and subnets in Prism Central independent of the underlying Google Cloud network topology.
-
Flow Virtual Networking provides a unified networking experience across on-premises and Google Cloud environments, simplifying hybrid connectivity and policy management.
-
For communication between user VMs on different physical hosts, the overlay network uses Geneve encapsulation.
-
User VMs can connect to external Google Cloud networks, the internet, and native Google Cloud services, such as Google Kubernetes Engine (GKE) and BigQuery.
-
You can provision user VMs to a network regardless of network address translation (NAT).
> If you provision a user VM to a NAT network, assign a floating IP address to the user VM to facilitate connectivity from outside the Flow Virtual Networking overlay networks.
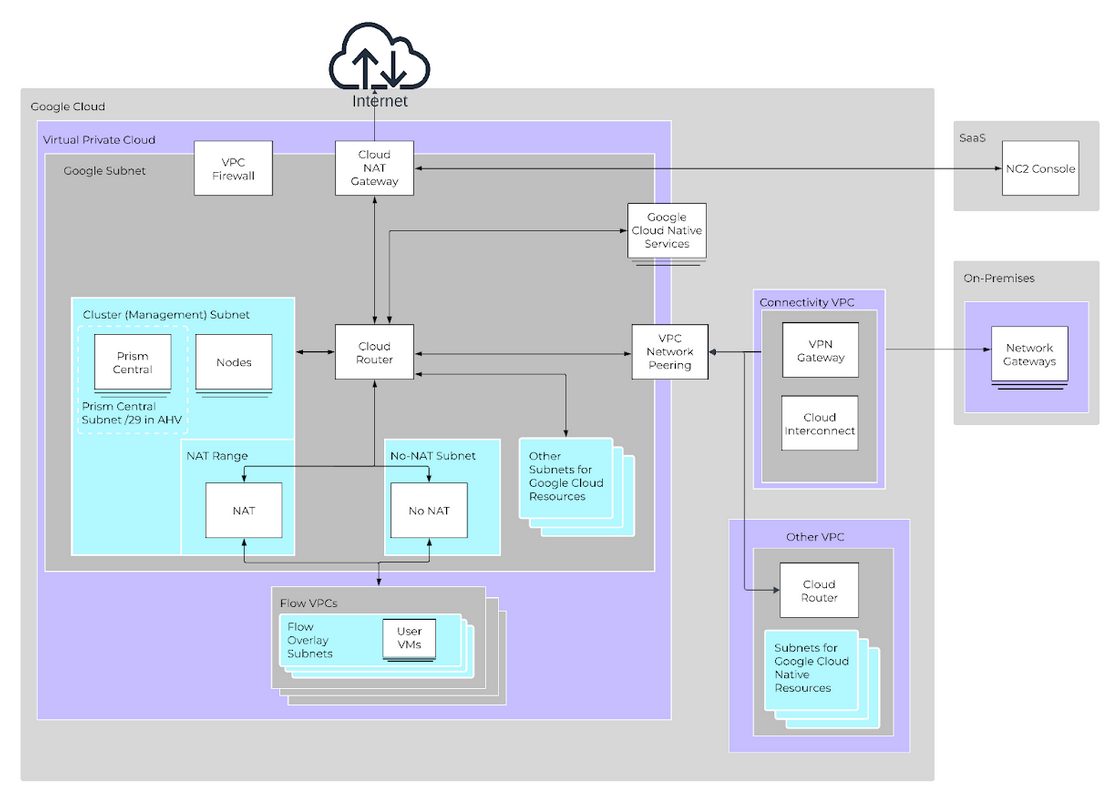
Prism Central contains the control plane for Flow Virtual Networking. The User VMs using the Flow VPC(s) can communicate to native Google Cloud services and allows the VMs to have parity with native Compute Engine VM instances.
Unlike NC2 in Azure, NC2 in Google Cloud does not require Flow Gateway VMs (FGWs).
Usage and Configuration
At a high level, the deployment process for Nutanix Cloud Clusters (NC2) on Google Cloud follows these steps:
- Set up or access an active Google Cloud subscription and project.
- Configure the necessary Google Cloud APIs and create a Service Account with the required IAM roles and permissions.
- (Optional) Configure networking in Google Cloud, including a Virtual Private Cloud (VPC) and the necessary subnets, or use a VPC created automatically during cluster creation.
- Create a My Nutanix account and subscribe to the NC2 service.
- Add your Google Cloud account to an organization in the NC2 console.
- Create a Nutanix Cluster in a new or existing Google Cloud VPC using the NC2 console.
More to come!
» Download this section as PDF (opens in a new tab/window)
The Nutanix Government Cloud Clusters (GC2) solution meets the stringent security and compliance requirements of government and highly regulated enterprises deploying hybrid cloud infrastructure on bare-metal Amazon Web Services (AWS). Unlike the traditional Nutanix Cloud Clusters (NC2) architecture, which requires you to add AWS credentials and maintain continuous outbound connectivity to Nutanix software as a service (SaaS) endpoints, GC2 places complete control within the AWS environment. You retain full ownership of your AWS credentials, eliminate external dependencies, and operate your Nutanix clusters entirely within your own virtual private cloud (VPC), addressing the core security and sovereignty concerns that prevent adoption in government cloud environments.
Supported Configurations
The solution is applicable to the configurations below (list may be incomplete, refer to documentation for a fully supported list):
Core Use Case(s):
- On-Demand / burst capacity
- Backup / DR
- Cloud Native
- Geo Expansion / DC consolidation
- App migration
Management interfaces(s):
- Prism Central (PC) - Nutanix Management
-
AWS Console - AWS Management
- EC2 Metal Instance Types:
- m5d.metal
- z1d.metal
- i3en.metal
- i4i.metal
- m6d.metal
- i7i.metal-48xl
- i7ie.metal-48xl
- Supported Regoions:
- GovCloud US-East
- GovCloud US-West
Upgrades:
- Part of AOS
Compatible Features:
- AOS Features
- AWS Services
Key terms / Constructs
The following key items are used throughout this section and defined in the following:
- Region
- A geographic landmass or area where multiple Availability Zones (sites) are located. A region can have two or more AZs. These can include regions like US-East-1 or US-West-1.
- Availability Zone (AZ)
- An AZ consists of one or more discrete datacenters inter-connected by low latency links. Each site has it’s own redundant power, cooling, network, etc. Comparing these to a traditional colo or datacenter, these would be considered more resilient as a AZ can consist of multiple independent datacenters. These can include sites like US-East-1a or US-West-1a.
- VPC
- A logically isolated segment of the AWS cloud for tenants. Provides a mechanism to to secure and isolate environment from others. Can be exposed to the internet or other private network segments (other VPCs, or VPNs).
- S3
- Amazon’s object service which provides persistent object storage accessed via the S3 API.
- Cloud Formation Template (CFT)
- A Cloud Formation Template simplifies provisioning, but allowing you to define a “stack” of resources and dependencies. This stack can then be provisioned as a whole instead of each individual resource.
Cluster Architecture
The GC2 architecture shifts orchestration intelligence from the NC2 console directly into Prism Element running in your cluster. Cluster provisioning uses AWS CloudFormation templates that use precreated network configurations, enabling flexible deployment into government cloud regions while maintaining strict network isolation. Day 2 operations, including cluster expansion, node replacement, and upgrades, run entirely within your environment through Prism Element, ensuring that sensitive workloads never expose credentials or operational telemetry beyond your boundaries.
In the standard Nutanix Cloud Clusters (NC2) model, you extend permissions to the NC2 SaaS service to provision clusters on your behalf, and it provisions all the necessary cloud infrastructure. After you deploy the infrastructure, Nutanix deploys agents to the Controller VMs (CVMs) to synchronize with the NC2 console through outbound internet connectivity. This architecture relies on three critical agents working together:
Host agent
The host agent continuously gathers telemetry on hardware health, network status, storage conditions, and system performance, emitting regular heartbeats back to the NC2 console for centralized monitoring.
Clusters agent
The clusters agent is a conduit between the NC2 console and local infrastructure, listening for orchestration intents issued by the NC2 console, verifying their authenticity, and forwarding them to the appropriate local services for implementation.
Infrastructure gateway
The infrastructure gateway translates these high-level intents into actionable AWS API calls to provision Elastic Compute Cloud (EC2) instances, configure networking, manage storage attachments, hibernate nodes, and perform cluster scaling operations.
While this architecture works effectively for most enterprise deployments, it presents challenges for government cloud environments. Extending AWS permissions to the NC2 console to act on behalf of the customer and maintaining persistent outbound connectivity to external endpoints violates fundamental security principles mandated by government compliance frameworks that demand complete data sovereignty and zero-trust network architectures. Highly regulated industries can’t permit their infrastructure credentials to leave their controlled environments, nor can they allow continuous telemetry streams to external commercial software as a service (SaaS) platforms. These security constraints led Nutanix to develop Government Cloud Clusters (GC2), where all orchestration intelligence moves from the NC2 console to Prism Element, running entirely within your AWS virtual private cloud (VPC) to eliminate credential sharing and external connectivity requirements while preserving full operational capabilities
The new infrastructure manager in the GC2 service assumes the role previously held by the NC2 console as the intent generator, while the infrastructure gateway continues as the engine. By colocating both services in the private environment, GC2 preserves all the operational capabilities of NC2 while delivering a secure and autonomous experience that meets government cloud requirements.
The infrastructure manager uses a leader-based design with Zookeeper maintaining leadership across CVMs, ensuring high availability and fault tolerance. Every CVM runs an infrastructure manager instance, but only one node actively processes user inputs and generates intents at any given time. If the leader node fails, the remaining infrastructure manager instances automatically elect a new leader and resume operations without manual intervention, guaranteeing continuous cluster management capabilities even during node failures.
The primary operational relationship in GC2 exists between the infrastructure manager and infrastructure gateway. When you initiate an operation through the command-line interface (CLI), the infrastructure manager validates the input, performs preflight checks such as instance type compatibility, constructs a standardized intent, and invokes infrastructure gateway APIs to perform necessary Prism Element cluster operations. The infrastructure manager also directly interacts with AWS APIs to manage cloud infrastructure tasks like provisioning Elastic Compute Cloud (EC2) instances, eliminating the need to share credentials with external platforms.
The following shows a high-level overview of the GC2 Communication in an AWS VPC :
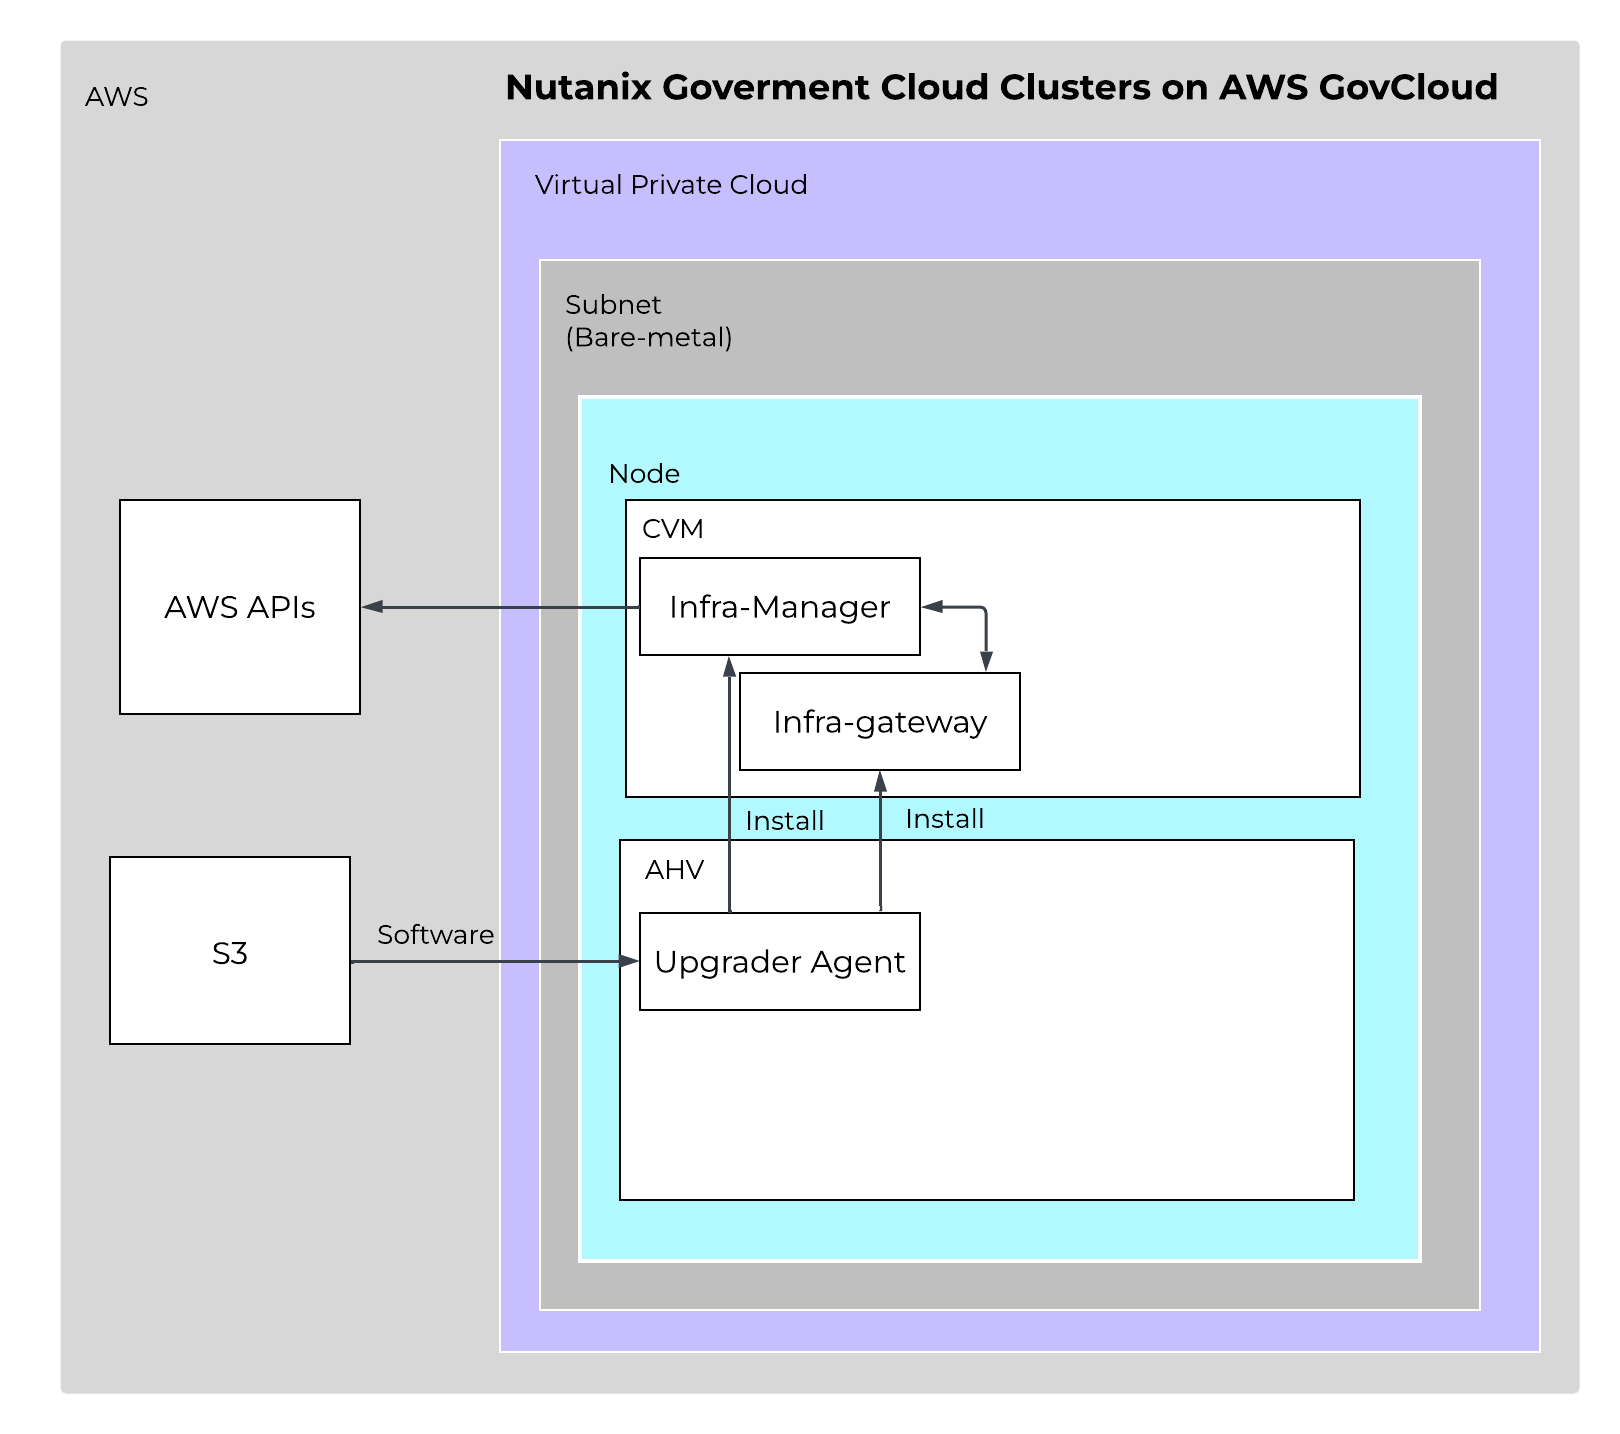 GC2 Agents - Overview
This clear separation of responsibilities creates a streamlined and resilient pipeline from user request to cluster state change. The infrastructure manager handles orchestration logic and cloud resource management, while the infrastructure gateway focuses exclusively on implementing cluster-level changes in Prism Element. Zookeeper-backed state persistence provides fault tolerance and automatic recovery in the event of failures, maintaining operational continuity without requiring external intervention or connectivity.
AHV Networking with Amazon Web Services
Nutanix integration with the Amazon Web Services (AWS) networking stack means that every VM deployed on Government Cloud Clusters (GC2) on AWS receives a native AWS IP address when using native networking, so that applications have full access to all AWS resources as soon as you migrate or create them on NC2 on AWS. Network performance remains high because the Nutanix network capabilities are directly on top of the AWS overlay, and resource consumption is low because you don’t need additional network components.
AHV uses Open vSwitch (OVS) for all VM networking. You can configure VM networking through Prism or the AOS command-line interface (aCLI), and each virtual network interface card (vNIC) connects to a tap interface. Native networking uses the same networking stack as on-premises. The AHV host, VMs, and physical interfaces use ports to connect to the bridges, and both bridges communicate with the AWS overlay network. Each host has the required drivers to use the AWS overlay network.
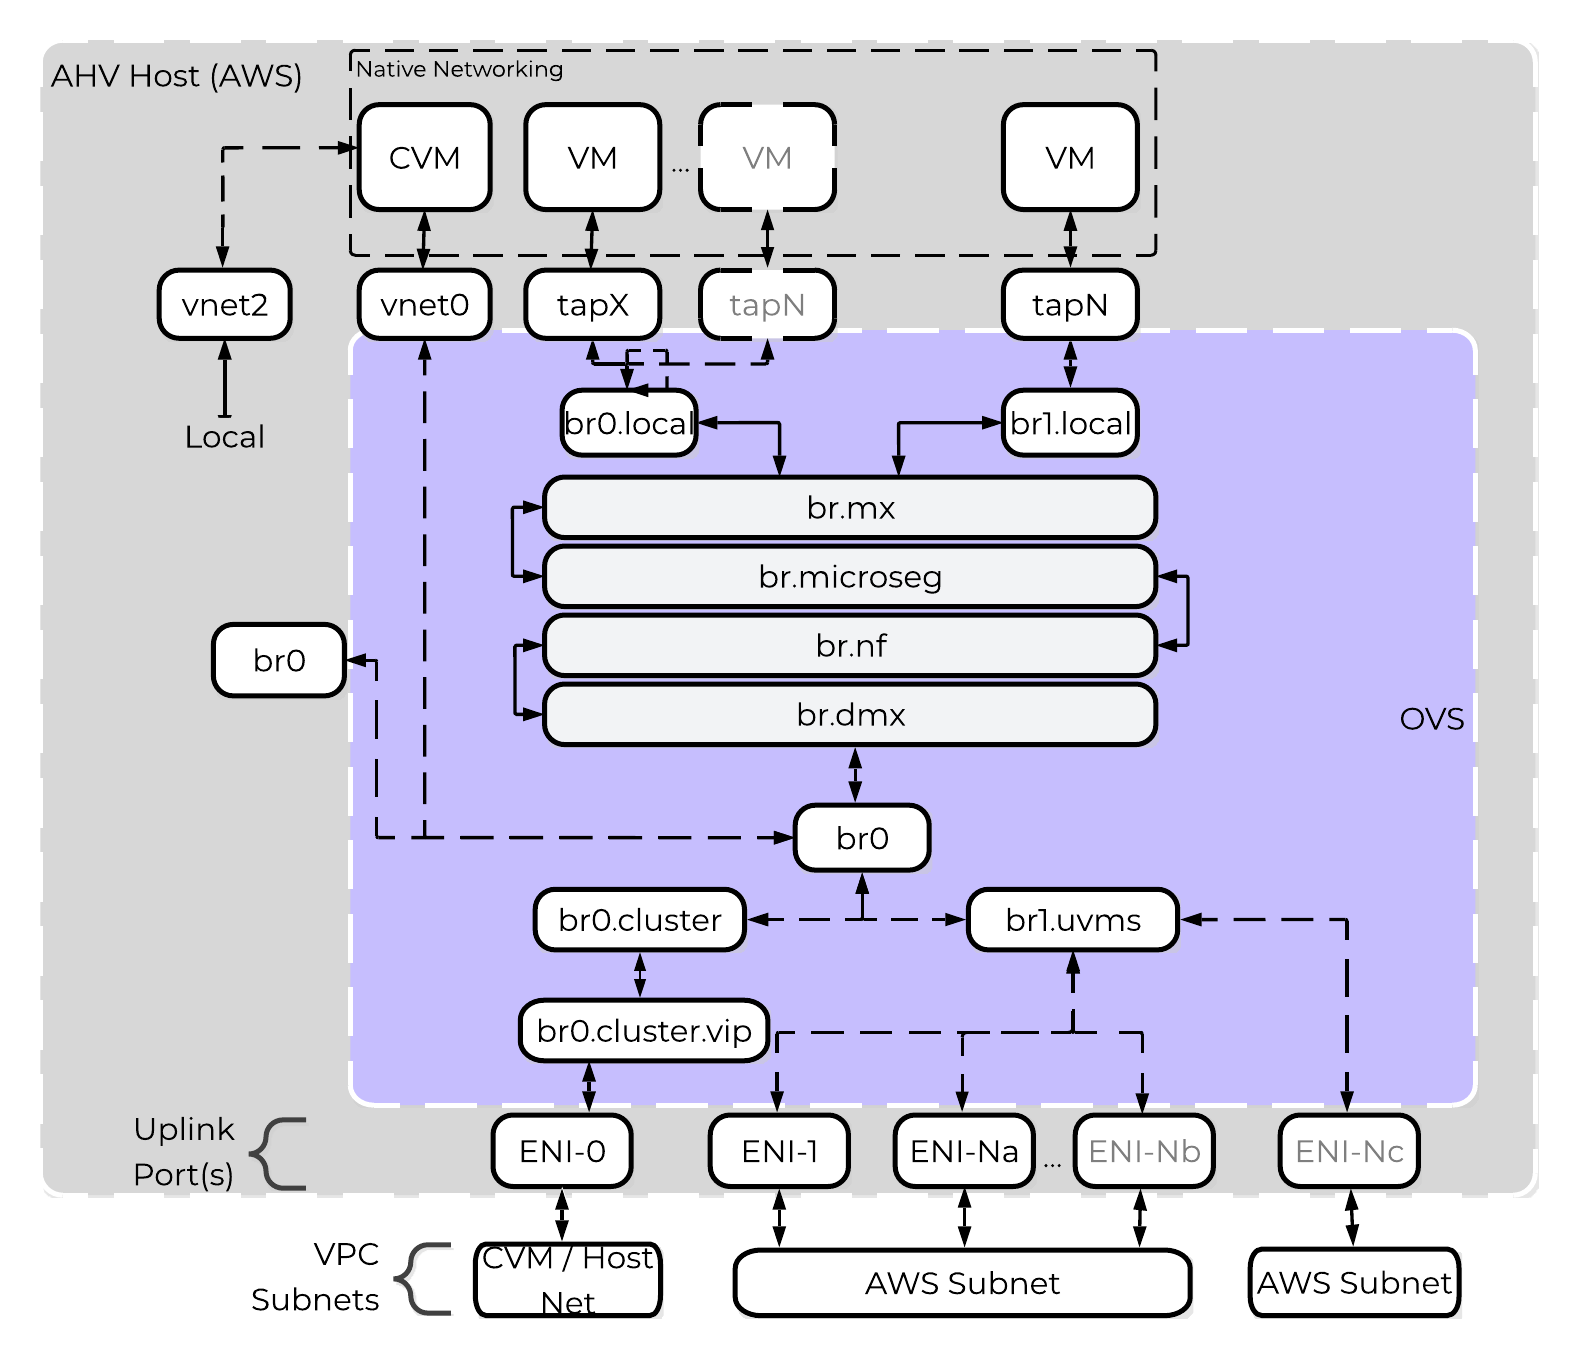 GC2 on AWS - OVS Architecture
Nutanix uses native AWS API calls to deploy AOS on bare-metal Elastic Compute Cloud (EC2) instances and consume network resources. Each bare-metal EC2 instance has full access to its bandwidth through an elastic network interface (ENI), so if you deploy Nutanix to an i7i.metal instance, each node has access to up to 100 Gbps. An ENI is a logical networking component in a VPC that represents a virtual network card, and each ENI can have one primary IP address and up to 49 secondary IP addresses. AWS hosts can support up to 15 ENIs.
When deployed with GC2 on AWS, AHV runs the Cloud Network Controller service on each node as a leaderless service and runs an OpenFlow controller. Cloud Network Controller uses an internal service called Cloud Port Manager to create and delete ENIs and assign ENI IP addresses to guest VMs.
Cloud Port Manager can map large Classless Inter-Domain Routing (CIDR) ranges from AWS and allows AHV to consume all or a subset of the range. If you use an AWS subnet of 10.0.0.0/24 and then create an AHV subnet of 10.0.0.0/24, Cloud Port Manager uses 1 ENI (cloud port) until active VMs consume all of the secondary IP addresses. When the 49 secondary IP addresses are used, Cloud Port Manager attaches an additional ENI to the host and repeats the process. Because each new subnet uses a different ENI on the host, this process can lead to ENI exhaustion if you use many AWS subnets for your deployment.
One-to-One Nutanix AHV and AWS Subnet Mapping
To prevent ENI exhaustion, use an AWS subnet of 10.0.2.0/23 as your AWS target. In AHV, create two subnets of 10.0.2.0/24 and 10.0.3.0/24. With this configuration, Cloud Port Manager maps the AHV subnets to one ENI, and you can use many subnets without exhausting the bare-metal nodes’ ENIs. Because a GC2 cluster can have multiple AWS subnets if enough ENIs are available, you can dedicate ENIs to any subnet for more throughput.
One-to-One and One-to-Many Nutanix AHV and AWS Subnet Mapping
When you consume multiple AHV subnets in a large AWS CIDR range, the network controller generates an Address Resolution Protocol (ARP) request for the AWS default gateway with the ENI address as the source. After the AWS default gateway responds, the network controller installs ARP proxy flows for all AHV subnets with active VMs on the ENI (cloud port). The ARP requests to a network’s default gateway reach the proxy flow and receive the media access control (MAC) address of the AWS gateway in response. This configuration allows traffic to enter and exit the cluster, and it configures OVS flow rules to ensure traffic enters and exits on the correct ENI. For more information on the Nutanix implementation of OVS, see the AHV Administration Guide.
GC2 on AWS creates a single default security group for guest VMs running in the Nutanix cluster. Any ENIs created to support guest VMs are members of this default security group, which allows all guest VMs in a cluster to communicate with each other.
From the AWS VPC dashboard, click on ‘subnets’ then click on ‘Create Subnet’ and input the network details:
Creating a Subnet
An AWS Region is a distinct geographic area. Each Region has multiple, isolated locations known as Availability Zones (AZs), which are logical datacenters available for any AWS customer in that Region to use. Each AZ in a Region has redundant and separate power, networking, and connectivity to reduce the likelihood of two AZs failing simultaneously.
Create a subnet in AWS in a VPC, then connect it to AOS in Prism Element. Cloud network, a new service in the CVM, works with AOS configuration and assigns a VLAN ID (or VLAN tag) to the AWS subnet and fetches relevant details about the subnet from AWS. The network service prevents you from using the AHV or CVM subnet for guest VMs by not allowing you to create a network with the same subnet.
You can use each ENI to manage 49 secondary IP addresses. A new ENI is also created for each subnet that you use. The AHV host, VMs, and physical interfaces use ports to connect to the bridges, and both bridges communicate with the AWS overlay network. Because each host already has the drivers that it needs for a successful deployment, you don’t need to do any additional work to use the AWS overlay network.
Always keep the following best practices in mind:
-
Don’t share AWS guest-VM subnets between clusters.
-
Have separate subnets for management (AHV and CVM) and guest VMs.
-
If you plan to use VPC peering, use nondefault subnets to ensure uniqueness across AWS Regions.
-
Divide your VPC network range evenly across all usable AZs in a Region.
-
In each AZ, create one subnet for each group of hosts that has unique routing requirements (for example, public versus private routing).
-
Size your VPC CIDR and subnets to support significant growth.
Guest AHV IP Address Management
AHV uses IP address management (IPAM) to integrate with native AWS networking. GC2 on AWS uses the native AHV IPAM to inform the AWS DHCP server of all IP address assignments using API calls. NC2 relies on AWS to send gratuitous Address Resolution Protocol (ARP) packets for any additions to an ENI’s secondary IP addresses. We rely on these packets to ensure that each hypervisor host is notified when an IP address moves or new IP addresses become reachable. For guest VMs, you can’t share a given AWS subnet between two GC2 on AWS deployments. You can, however, use the same management subnet (AHV and CVMs) for multiple clusters.
The cloud network controller, a service in the AHV host, helps with ENI creation. The cloud network controller runs an OpenFlow controller, which manages the OVS in the AHV hosts and handles mapping, unmapping, and migrating guest-VM secondary IP addresses between ENIs or hosts. A subcomponent of the cloud network controller called cloud port manager provides the interface and manages AWS ENIs.
IPAM avoids address overlap by sending AWS API calls to inform AWS which addresses are being used.
The AOS leader assigns an IP address from the address pool when it creates a managed vNIC, and it releases the address back to the pool when the vNIC or VM is deleted.
Cloud ManagementLearn how Nutanix Cloud Manager provides a unified solution for managing cloud deployments.
» Download this section as PDF (opens in a new tab/window)

Once you have modernized your infrastructure with Nutanix, the next step is to modernize your operations and automation and establish a cloud operating model. A cloud operating model enables customers of all sizes to build and manage their cloud platform faster and more efficiently. The goal is to spend less time responding to service requests and more time innovating and providing business value.
Here are the three main aspects of cloud management:
- Build
- Operate
- Govern
Nutanix Cloud Manager provides the tools to establish the cloud operating model in your own datacenter, and integrates with native public cloud services as well. For example, Nutanix Self-Service enables you to deploy infrastructure into AWS, Azure, or GCP using native instances (e.g. EC2, Azure VMs, GCP Compute Engine instances). Or, you can leverage Nutanix Intelligent Operations to understand VM behavior, create easy-to-use automation for routine tasks, and plan for future workloads. Finally, you can govern cost and security across clouds with Cost Governance and Security Central.
So, to summarize, the four services in Nutanix Cloud Manager are:
- Intelligent Operations
- Cost Governance
- Self-Service
- Security Central
» Download this section as PDF (opens in a new tab/window)
Nutanix Cloud Manager Intelligent Operations provides monitoring, analytics, capacity planning, reporting, and automation capabilities for Nutanix infrastructure.
With NCM 2.0, Intelligent Operations is integrated into the Nutanix Central experience and is designed to provide operational visibility across one or more Prism Central domains. This allows teams to view infrastructure inventory, monitor operational signals, analyze capacity trends, generate reports, and automate common operational workflows from a centralized cloud management interface.

Intelligent Operations helps infrastructure and operations teams answer questions such as:
- What infrastructure do I have across my Nutanix environments?
- Which alerts, events, anomalies, or audits need attention?
- Which clusters are approaching capacity limits?
- Which workloads are the largest consumers of resources?
- How can repetitive operational tasks be automated?
- How can operational and capacity data be shared with stakeholders?
The following sections cover key Intelligent Operations capabilities in NCM 2.0:
- Intelligent Operations in NCM 2.0
- Account Onboarding
- Multi-Prism Central Operations
- Inventory Browser
- Signals
- Alerts and Events
- Anomaly Detection
- Seasonality
- Anomaly Detection Algorithm
- Audits
- User-Defined Alert Policies
- Alerts and Events
- Capacity Planning and Runway
- What-If Planning
- Reporting
- Out-of-the-Box Derived Metrics
- Playbooks
- REST API Actions and External Systems
- Operational Flow
- Summary
Intelligent Operations in NCM 2.0
NCM 2.0 introduces a more unified operating model for Intelligent Operations. Instead of viewing each Prism Central environment in isolation, teams can onboard multiple Prism Central domains into Nutanix Central and use Intelligent Operations capabilities across those environments.
This is especially useful for organizations that operate multiple datacenters, regional environments, business-unit-specific clusters, or separate Prism Central domains for operational, organizational, or lifecycle reasons.
At a high level, Intelligent Operations in NCM 2.0 helps teams move from isolated monitoring to centralized operations.

This model allows operations teams to reduce context switching, centralize visibility, and make better decisions across their Nutanix estate.
Account Onboarding
Before Intelligent Operations can provide visibility across multiple environments, Prism Central domains are onboarded into NCM as accounts.
Account onboarding provides a common workflow for adding Nutanix environments into the NCM operating model. Once a Prism Central domain is onboarded, Intelligent Operations can use that account as a source for inventory, alerts, events, anomalies, audits, capacity data, and reporting.

This simplifies the operational experience because administrators do not need to manage each Prism Central domain as a completely separate operational island. Instead, each onboarded account becomes part of the broader NCM view, and it also becomes available to all other NCM services.
Multi-Prism Central operations
Many enterprise environments are distributed across multiple Prism Central domains. This can happen for several reasons, including geography, scale, organizational boundaries, lifecycle management, or separation between production and non-production environments.
In earlier operating models, administrators often had to move between separate Prism Central instances to understand the health, capacity, and activity of each environment. NCM 2.0 improves this experience by enabling Intelligent Operations to work across multiple onboarded Prism Central domains.
Multi-Prism Central operations allow teams to:
- View infrastructure across multiple Prism Central domains
- Compare operational status across environments
- Analyze alerts, events, anomalies, and audits centrally
- Review capacity and runway across clusters
- Reduce the need to manually switch between individual Prism Central instances
This centralized model is useful for both day-to-day operations and higher-level planning. Operators can investigate specific entities, while infrastructure leaders can better understand trends across the broader environment.
Inventory Browser
Inventory Browser provides a centralized way to view infrastructure entities across onboarded Prism Central domains.
Instead of starting with a specific Prism Central instance and then searching within that environment, administrators can use Inventory Browser to search, filter, and inspect infrastructure objects from a broader NCM view.
Inventory Browser can help answer questions such as:
- Which Prism Central domain owns this VM?
- Which cluster is this workload running on?
- What entities exist across my environment?
- Which objects are associated with a specific site, cluster, or account?
- Which entities require operational attention?

Inventory visibility is foundational to operations. Before teams can troubleshoot, plan, or automate, they need to understand what exists, where it exists, and how it is behaving.
In NCM 2.0, Inventory Browser provides this broader operational starting point.
Signals
Modern infrastructure generates a large amount of operational data. Alerts, events, anomalies, and audits are all useful, but they can become difficult to manage when viewed separately across multiple environments.
Signals provides a centralized operational view for key activity across the Nutanix environment.
Signals can include:
- Alerts
- Events
- Anomalies
- Audits
This helps administrators identify what is happening, where it is happening, and whether action is required.

Signals helps reduce operational fragmentation. Rather than treating each alert, event, or anomaly as a separate workflow, Intelligent Operations brings these operational indicators together so teams can investigate and respond more efficiently.
Alerts and Events
Alerts and events provide important information about infrastructure health, configuration changes, resource behavior, and operational activity.
Traditional monitoring tools can generate a large number of alerts, many of which may not require immediate action. This can lead to alert fatigue, where important issues are missed because they are buried among less critical notifications.
Intelligent Operations helps by centralizing alerts and events and placing them in the broader context of the environment. Administrators can use this information to understand what happened, where it happened, and which infrastructure objects were affected.


Alerts and events are also important inputs for automation. When paired with alert policies and Playbooks, they can trigger notifications, ticket creation, REST API calls, or other operational workflows.
Anomaly Detection
Anomaly Detection helps identify behavior that falls outside expected operating patterns.
Traditional threshold-based monitoring is useful, but it can create noise when a workload normally operates at a high or low utilization level. For example, a database VM may normally run at high memory utilization because of caching. In that case, high memory usage alone may not indicate a problem. However, a sudden drop in memory usage could indicate that a service stopped or that behavior changed unexpectedly.
Anomaly Detection uses historical time-series data to establish a normal operating band for metrics such as CPU usage, memory usage, latency, I/O, and other resource behaviors. When the observed value falls outside the expected band, the system can identify that behavior as anomalous.
This helps teams focus on abnormal behavior rather than static thresholds alone.
Examples include:
- A workload that normally has steady CPU usage suddenly spikes
- A database that normally uses high memory suddenly drops to very low memory usage
- Weekend batch activity that is expected during backups or reporting jobs
- End-of-month activity that differs from normal daily usage
- Seasonal workload changes during business-critical periods
Anomaly Detection is especially useful because normal behavior is not the same for every workload. Some applications are quiet during the week and active on weekends. Others experience predictable spikes at the end of a reporting period. Intelligent Operations can use historical behavior to better distinguish between expected and unexpected activity.
Seasonality
Seasonality allows anomaly detection to account for recurring patterns.
Common seasonality examples include:
- Daily patterns
- Weekly patterns
- Monthly patterns
For example, a reporting workload may generate high I/O every weekend. A static threshold might flag that activity every time it happens. Anomaly Detection can learn that the weekend increase is expected and focus instead on behavior that falls outside the normal weekend pattern.
This helps reduce unnecessary alerts while still identifying unusual behavior.
Anomaly Detection Algorithm
Nutanix has historically used the Generalized Extreme Studentized Deviate Test to help determine expected behavior bands for anomaly detection.
A simple way to think about this is similar to a confidence interval. The system establishes an expected upper and lower range for a metric, then identifies values that fall outside that range.
The algorithm requires enough historical data to understand the relevant pattern.
- Daily: 3 days
- Weekly: 3 weeks (21 days)
- Monthly: 3 months (90 days)
This historical context is important because anomaly detection becomes more useful as it learns what normal behavior looks like for each workload.
Audits
Audits provide visibility into user and system activity across the environment.
While alerts and events help administrators understand infrastructure health and operational changes, audits help answer a different set of questions:
- Who performed an action?
- What action was performed?
- When did the action happen?
- Which object or entity was affected?
- Which Prism Central domain or account was involved?
This information is important for troubleshooting, security reviews, compliance workflows, and operational accountability.
In distributed environments, audit visibility becomes especially important. When teams manage multiple Prism Central domains, it can be difficult to understand where a change occurred or which user initiated it if audit data must be reviewed separately in each environment.
With NCM 2.0, Intelligent Operations can provide a more centralized view of audit activity across onboarded environments. This allows administrators to review operational changes from a broader NCM interface instead of manually checking each Prism Central domain in isolation.

Audits are also useful during incident investigation. For example, if an alert is generated after a configuration change, an administrator can review audit activity to determine whether a user action may have contributed to the issue.
User-Defined Alert Policies
User-defined alert policies allow administrators to define custom alerting behavior based on operational requirements.
While built-in alerts and anomaly detection provide broad coverage, many organizations also need custom alerting rules for specific workloads, teams, or operating standards.

User-defined alert policies can be based on conditions such as:
- Static thresholds
- Behavioral anomalies
- Resource utilization
- Infrastructure health
- Operational events
These policies help teams align alerting behavior with their own service levels, escalation paths, and operational practices.
User-defined alert policies are also useful when combined with Playbooks. An alert policy can identify the condition, while a Playbook can define the response. This creates a more complete operational workflow from detection to action.
Capacity Planning and Runway
Capacity Planning helps administrators understand current resource consumption, future capacity needs, and the expected runway of clusters.
Instead of waiting until a cluster is nearly full, Intelligent Operations can help teams identify capacity constraints earlier and plan ahead.
Capacity Planning can help answer questions such as:
- How long before this cluster runs out of capacity?
- Which resource is the limiting factor?
- Which workloads are the largest consumers?
- What can be reclaimed?
- What happens if additional workloads are added?
- Which cluster is the best fit for new workloads?
- How would a new hypotetical workload affect the usage?
Cluster runway is a key concept. Runway estimates how long a cluster can continue operating before it reaches a capacity constraint. The limiting resource may be CPU, memory, storage, or another resource depending on the environment and workload profile.

Capacity Planning can also help identify top consumers. This allows administrators to understand which VMs, applications, or workloads are driving resource usage.
This visibility supports better planning decisions, such as:
- Reclaiming unused or oversized resources
- Moving workloads to a cluster with more available capacity
- Expanding an existing cluster
- Planning new hardware purchases
- Evaluating the impact of future workload growth
In NCM 2.0, Capacity Planning becomes more useful because teams can review capacity and runway across onboarded Prism Central environments. This broader view helps administrators make placement and planning decisions across the Nutanix estate.

What-If Planning
What-if planning helps teams model future capacity needs before making infrastructure changes.
For example, an administrator may want to know whether a cluster can support:
- 50 additional VMs
- A new database environment
- A virtual desktop expansion
- A new application deployment
- Growth in CPU, memory, or storage demand
Rather than relying on manual calculations, what-if planning allows the team to estimate the impact of planned growth against available resources.

This helps teams avoid reactive capacity decisions and supports more predictable infrastructure planning.
Reporting
Reporting helps teams communicate operational and capacity information to different audiences.
Operations teams may use reports to review infrastructure health and utilization. Infrastructure leaders may use reports to understand growth trends, capacity risk, or planning requirements. Application owners may use reports to understand how their workloads are consuming resources.
Reports can be useful for lots of operational activities including:
- Capacity reviews
- Operational health summaries
- Resource utilization trends
- Infrastructure planning
- Team-level visibility
- Leadership reporting
- Recurring operational reviews
Reporting becomes especially valuable when combined with derived metrics. Instead of manually collecting data from different views, teams can use reports to summarize important operational information in a repeatable format.
Reports help turn infrastructure data into a communication tool. This supports better planning, better visibility, and more consistent operational reviews.
Out-of-the-Box Derived Metrics
NCM 2.0 introduces out-of-the-box derived metrics that provide higher-level infrastructure and capacity insights.
A derived metric is calculated from one or more underlying metrics. Instead of only showing raw data points, derived metrics can combine, aggregate, or transform base metrics into more useful operational summaries.
Below is an image showing an example of some of these OOTB metrics beign added to a report.

Derived metrics can help summarize areas such as:
- Compute utilization
- Memory utilization
- Storage usage
- Capacity trends
- Infrastructure-level resource behavior
- Aggregated entity or descendant data
For example, a raw metric may show resource usage for an individual entity. A derived metric can help provide a higher-level view by aggregating or transforming that data into a more useful summary.
In NCM 2.0, out-of-the-box derived metrics provide a foundation for richer reporting and infrastructure analysis. They help administrators and stakeholders move from raw telemetry to more consumable operational insights.
Playbooks
Playbooks provide low-code or no-code automation for common operational workflows.
Playbooks were previously known as X-Play (pronounced cross-play). The core concept remains the same: an event or condition triggers a defined set of actions.
Event-driven automation follows a simple pattern:
event(s) → logic → action(s)
In IT operations, many workflows follow this pattern. For example:
- An alert is generated
- A ticket is created
- A team is notified
- A REST API call is made
- A remediation task is triggered
- The ticket or notification is updated with the result
Playbooks allow administrators to automate these repetitive workflows.
For some example playbooks that you can import into your own instance, check out the Playbooks Library on nutanix.dev!
Also, check out Getting Started with Nutanix X-Play for more examples and references.

Common Playbook use cases include:
- Sending an email when a critical alert is generated
- Sending a Slack notification
- Creating a ticket in an ITSM system
- Calling an external REST API
- Capturing event details for audit or troubleshooting
- Triggering a remediation workflow
- Notifying an application owner when a workload requires attention
The following image shows an example of some of the playbook actions available.

Playbooks are especially powerful when combined with Signals and user-defined alert policies.
This allows teams to move from detection to response in a consistent and repeatable way.
REST API Actions and External Systems
Many organizations use external systems for ticketing, CMDB, collaboration, incident response, or automation.
Playbooks can integrate with these external systems by using REST API actions. This allows Intelligent Operations to become part of a broader operational ecosystem.
For example, a Playbook could:
- Create a ticket in an ITSM platform
- Update a CMDB record
- Notify an external automation system
- Trigger a workflow in another tool
- Send event details to a collaboration platform
This is useful because infrastructure operations rarely happen in only one system. Alerts, tickets, ownership data, and remediation workflows often span multiple tools.
By using REST API actions, Playbooks can help keep those systems synchronized and reduce manual handoffs between teams.
Operational Flow
The value of Intelligent Operations comes from connecting visibility, analysis, and automation.
Inventory Browser helps teams understand what exists.
Signals help teams understand what is happening.
Anomaly Detection and alert policies help teams identify what needs attention.
Capacity Planning and Reporting help teams understand trends and plan ahead.
Playbooks help teams automate the response.
Together, these capabilities help operations teams move from reactive troubleshooting to proactive and automated operations.
Summary
NCM Intelligent Operations helps infrastructure teams centralize visibility, analyze capacity, detect abnormal behavior, report on operational trends, and automate common workflows.
With NCM 2.0, Intelligent Operations supports operations across multiple onboarded Prism Central domains. This provides a broader and more unified view of Nutanix infrastructure.
» Download this section as PDF (opens in a new tab/window)
Nutanix Cloud Manager (NCM) Cost Governance helps organizations understand the cost of running workloads on Nutanix cloud environments and allocate that cost to the appropriate teams, applications, projects, or cost centers.
In NCM 2.0, Cost Governance is deployed on-prem and focuses on Nutanix cloud environments. It provides visibility into infrastructure consumption, translates resource usage into cost, and supports cost management workflows such as budgeting, reporting, showback, and chargeback.
This book focuses specifically on NCM 2.0 Cost Governance.
- Why Cost Governance Matters
- What Cost Governance Does
- Cost Governance Architecture
- Cost Centers
- Budgets
- Reports
- Metering Models
- Total Cost of Ownership
- User Defined Metering
- Showback and Chargeback
- Optimization
Why Cost Governance Matters
Nutanix infrastructure provides a shared platform for running applications, databases, virtual machines, and services across the organization. As more teams consume resources from the same platform, it becomes important to understand how that infrastructure is being used and how cost should be allocated.
Traditional infrastructure cost is often tracked at the hardware, cluster, or datacenter level. While this is useful for procurement and planning, it does not always show which teams, applications, or projects are consuming the resources.
Cost Governance helps answer questions such as:
- What is the cost of running workloads on Nutanix on-premises resources?
- Which cost centers are consuming the most resources?
- How much cost should be allocated to a specific team, application, or project?
- Are budgets being exceeded?
- How can infrastructure teams provide showback or chargeback reporting?
By translating infrastructure consumption into cost, Cost Governance helps organizations improve financial visibility and accountability across their Nutanix environment.
What Cost Governance Does
Cost Governance collects usage and inventory data from Nutanix infrastructure (limited to Nutanix cloud environments only) and applies a cost model to estimate the cost of consumed resources.
It helps organizations:
- Model the cost of Nutanix infrastructure
- Allocate infrastructure cost to cost centers
- Create budgets for teams, projects, or applications
- Track actual spend against budget
- Generate reports for showback or chargeback
- Identify optimization opportunities
- Improve accountability for shared infrastructure consumption

Cost Governance does not replace financial systems of record. Instead, it provides infrastructure-aware cost visibility that can be used by operations, platform, application, and finance teams.
Cost Governance Architecture
Starting with NCM version 2.0, Cost Governance is deployed on-prem.
At a high level, Cost Governance works by collecting Nutanix infrastructure inventory and usage data, applying a cost model, mapping resources to cost centers, and presenting cost information through dashboards, reports, budgets, and alerts. If you are running ESXi on Nutanix Cloud Infrastructure (NCI), the TCO model does factor in the per-core subscription licensing for ESXi, but the cost governance functionality itself is strictly for the Nutanix platform.Cost Governance on-prem (in NCM 2.0) is limited to Nutanix environments only.
The basic workflow is:
- Onboard Prism Central domain account into NCM.
- Collect inventory and usage data.
- Validate or define the infrastructure cost model.
- Map resources to cost centers.
- Create budgets and alerts.
- Review cost visibility, reports, and optimization opportunities.
This allows organizations to move from infrastructure-level resource consumption to business-level cost visibility.
Cost Centers
Cost centers are logical groupings used to allocate cost to the appropriate owner. A cost center may represent a department, application team, project, environment, or business function.
Examples include:
- Engineering Dev/Test
- Finance Applications
- Customer Support Systems
- Marketing Analytics
- Production ERP

Budgets
Budgets define expected or approved spend for a cost center. Cost Governance can track actual cost against the configured budget and help identify areas where spending may exceed expectations.

Reports
Reports provide a way to share cost data with stakeholders. Reports can support operational reviews, budget discussions, showback workflows, and chargeback processes.

Metering Models
A metering model is the foundation for calculating infrastructure cost in Cost Governance. It defines the cost inputs used to estimate how much it costs to run workloads on Nutanix infrastructure.
Unlike public cloud environments, where costs are typically provided through a usage-based bill, on-prem infrastructure costs must be modeled from the underlying expenses required to operate the environment. These expenses can include hardware, software, support, facilities, power and cooling, personnel, and other operational costs.
Once these inputs are defined, Cost Governance can use resource consumption data to estimate workload cost and allocate that cost to the appropriate cost centers, teams, applications, or projects.

Total Cost of Ownership
Public cloud environments expose cost through provider bills and usage-based pricing. Nutanix on-prem infrastructure requires a different approach because the organization owns or operates the infrastructure directly.
Cost Governance uses a Total Cost of Ownership model to estimate the cost of running workloads on Nutanix infrastructure.
The TCO model can include infrastructure-related cost factors such as:
- Hardware
- Software
- Support
- Facilities
- Power and cooling
- Personnel
- Network or telecom services

Cost Governance provides a TCO cost model out of the box which can be used as is or modified to enhance the cost metering model. Cost Governance can allocate cost across workloads, cost centers, teams, or applications based on infrastructure consumption.
User Defined Metering
User Defined Metering provides a flexible way to define custom rates for infrastructure consumption.
While the TCO metering model calculates cost based on the total cost of operating the underlying infrastructure, User Defined Metering allows administrators to define their own unit-based rates for resources such as CPU, memory, and storage.
This is useful for organizations that already have an internal pricing model or want to align infrastructure chargeback with business-specific rates rather than calculated infrastructure cost.
User Defined Metering can help teams create a more predictable and standardized cost model. Instead of calculating cost only from infrastructure ownership and operating expenses, administrators can apply rates that reflect how the organization wants to allocate or recover costs internally.

This model is especially helpful when different teams, departments, or cost centers need a consistent way to understand the cost of the resources they consume.
Common use cases include:
- Internal chargeback based on predefined resource rates
- Showback using simplified or standardized pricing
- Aligning private cloud cost reporting with existing financial models
- Modeling infrastructure costs in a way that is easier for application teams to understand
By using User Defined Metering, organizations can tailor cost calculations to match their own financial, operational, or organizational requirements.
Showback and Chargeback
Cost Governance supports showback and chargeback models for Nutanix infrastructure.
Showback provides visibility into infrastructure cost without directly billing teams. It helps application owners, platform teams, and finance stakeholders understand how much Nutanix infrastructure is being consumed and what that consumption costs.

Chargeback goes further by assigning those costs back to the consuming team, department, project, or cost center.
Optimization
Cost Governance helps organizations identify areas where Nutanix infrastructure may not be used efficiently.
Common optimization opportunities include:
- Idle virtual machines
- Oversized virtual machines
- Unused or underutilized resources
- Reclaimable capacity
- Resources without clear ownership
- Cost centers trending above budget
Optimization recommendations should be reviewed with operational context. Some workloads may appear underutilized but still be required for redundancy, peak demand, compliance, or application-specific behavior.
The goal is not simply to reduce cost. The goal is to align Nutanix infrastructure consumption with business value.
» Download this section as PDF (opens in a new tab/window)
Nutanix Cloud Manager Self-Service provides application automation, lifecycle management, Self-Service Store, governance, and runbook automation capabilities for Nutanix and supported cloud environments.
With NCM 2.0, Self-Service is accessed through Nutanix Central as part of the unified Nutanix Cloud Manager experience. This provides a centralized entry point for designing, publishing, deploying, managing, and automating applications through blueprints, runbooks, Self-Service Store items, projects, policies, and reusable configuration across all onboarded Prism Central domains.
In the following sections, we will cover the key features of Nutanix Self-Service as part of the NCM 2.0 experience within Nutanix Central:
- Self-Service in NCM 2.0
- Capabilities Summary
- Blueprint-centric Application Design
- Deployment Locations
- Blueprint Example
- Tasks
- Brownfield Applications
- Runbook Automation
- Endpoints
- Global Variables
- Self-Service Store Application Deployment
- Built-in Application Blueprints
- Project-Based Governance
- Project Analysis
- Self-Service Policies
- NCM Self-Service Domain Specific Language (DSL)
- Summary
Self-Service in NCM 2.0
With NCM 2.0, Self-Service is accessed through Nutanix Central as part of the unified Nutanix Cloud Manager experience.
This provides a centralized entry point for application automation and governance. Administrators and users can access Self-Service capabilities from the same Nutanix Central interface used across NCM, helping reduce context switching and provide a more consistent cloud management experience.
Self-Service continues to provide the core capabilities that users are familiar with:
- Blueprints define application models and deployment logic
- Runbooks automate operational workflows
- Self-Service Store items provide curated deployment options
- Projects define users, infrastructure, quotas, and deployment boundaries
- Policies provide governance and approval workflows
- Global Variables provide reusable values across blueprints and runbooks
- DSL enables infrastructure-as-code style automation for Self-Service content
Although the user experience is now surfaced through Nutanix Central, the fundamental Self-Service concepts remain familiar. The goal is still to help teams standardize application deployment, simplify day-2 operations, and provide governed access to infrastructure resources.

Capabilities Summary
NCM Self-Service provides application automation, orchestration, governance, and lifecycle management capabilities for Nutanix and supported cloud environments.
With NCM 2.0, Self-Service is accessed through Nutanix Central as part of the unified Nutanix Cloud Manager experience. This gives administrators and users a centralized place to design, publish, deploy, manage, and automate applications.
NCM Self-Service provides the following key capabilities:
- Blueprint-based application modeling: Design repeatable application deployment models that include infrastructure resources, application services, configuration tasks, variables, credentials, and day-2 actions.
- Multi-environment orchestration: Deploy and manage applications across supported on-premises, cloud, and Kubernetes environments.
- NCM Store for Applications: Publish approved blueprints to a catalog so users can deploy standardized applications through a self-service experience.
- Runbook automation: Create automation workflows for operational tasks, integrations, remediation steps, and day-2 activities.
- Endpoint-based integrations: Connect Self-Service automation to Nutanix management interfaces, REST APIs, script execution targets, and external systems.
- Project-based governance: Define users, groups, infrastructure resources, quotas, policies, and deployment boundaries for Self-Service consumption.
- Policy-driven control: Use policies to manage approvals, scheduling, governance, and application lifecycle actions.
- Global Variables: Centrally define reusable values that can be referenced across blueprints and runbooks.
- Cost Governance integration: View and analyze application cost and resource consumption when integrated with NCM Cost Governance.
- DSL-based automation: Use the NCM Self-Service DSL to manage Self-Service content programmatically and support infrastructure-as-code workflows.
Together, these capabilities help organizations provide a governed self-service experience for application teams while maintaining control over infrastructure placement, resource consumption, operational workflows, and automation standards.
Blueprint-centric Application Design
Blueprints are the foundation of NCM Self-Service application automation.
A blueprint defines the resources, services, configuration, dependencies, and lifecycle actions required to deploy and manage an application. Blueprints can model simple single-VM deployments or complex multi-tier applications with multiple services, dependencies, and day-2 operations.
Within NCM Self-Service blueprints, common blueprint types include:
- Single VM blueprints
- Multi VM or application blueprints
Single VM Blueprint: An application or service consisting of a single VM, along with its associated deployment scripts and dependencies. Dependencies includes items such as hardware configuration, operating system types and versions and tasks that a deployment will need to step through before completion.
Multi VM/Pod Blueprint: An application or service consisting of one or more VMs, along with each VM’s associated deployment scripts and dependencies. Similar to Single VM blueprints in overall concept, Multi VM/Pod Blueprints are different in that relationships between an application’s VMs can be defined during deployment ensuring, for example, that a database is deployed before the application that depends on that database. In addition to the core application components, Multi VM/Pod Blueprints include configuration for scaling and lifecycle management that allow administrators or triggers to manually or automatically adjust configuration based on application demand. In addition to VM deployments, Multi VM/Pod Blueprints support the deployment of pod-based applications in a Kubernetes environment e.g. Deployments, Containers and Services.

Blueprints can include:
- Infrastructure resources
- VM configuration
- Network configuration
- Application services
- Install and configuration scripts
- Runtime variables
- Credentials
- Day-2 actions
- Dependency logic
- Deployment locations
Blueprint-centric design allows administrators to standardize deployment patterns and expose them to users through a governed interface.
Deployment Locations
NCM Self-Service blueprints support deployment to various on-premises and cloud locations.

Deployment locations define where a blueprint can be deployed. This may include Nutanix AHV environments, VMware environments, supported public cloud environments, and Kubernetes-based environments.
Deployment locations are important because different environments may have different infrastructure resources, networking configurations, images, credentials, quotas, or operational requirements.
A blueprint can be designed to support one or more deployment locations. This allows teams to create reusable application definitions while still supporting the needs of different environments.
For example, a blueprint may deploy an application to:
- A development cluster
- A production cluster
- A regional datacenter
- A public cloud account
- A Kubernetes environment
By defining deployment locations in Self-Service, administrators can provide flexibility to users while maintaining governance over where applications are allowed to run.
Blueprint Example
A blueprint can be used to define the complete deployment flow for an application.

For example, a simple web application blueprint may include:
- A VM image
- vCPU and memory configuration
- Disk configuration
- Network assignment
- Application package installation
- Firewall configuration
- Runtime variables
- Application startup commands
A more advanced blueprint may include multiple services and dependencies. For example:
- A load balancer
- Multiple web servers
- An application server
- A database server
- Configuration tasks
- Validation tasks
- Day-2 actions such as scale out, restart, backup, or update
Blueprints help reduce manual deployment steps by turning infrastructure and application configuration into a repeatable model.
Instead of asking users to manually request infrastructure, select images, configure networks, install packages, and run scripts, Self-Service allows those steps to be defined once in a blueprint and reused many times.
This helps improve consistency, reduce deployment errors, and accelerate application delivery.
Tasks
Tasks are used within blueprints to perform specific actions during application deployment or management.

A task can perform actions such as:
- Running a script
- Installing software
- Configuring an application
- Calling a REST API
- Validating deployment status
- Waiting for a service to become available
- Passing output values to another task
- Executing day-2 operations
Tasks are commonly used during package installation and application configuration. For example, a task may install a web server package, configure firewall rules, update an application configuration file, or register the application with another system.
Tasks can also be used to create dependency logic between different parts of an application. For example, a database may need to be deployed and configured before an application server can connect to it. Blueprint tasks can help define and sequence that logic.
The ability to combine infrastructure configuration with application-level tasks is one of the key values of Self-Service blueprints. It allows teams to model not only where an application runs, but also how it is configured and operated.
Brownfield Applications
In the context of NCM Self-Service, a brownfield application is a collection of services (e.g. VMs) that are not yet managed by Self-Service. Before Self-Service can communicate with those services, the application must be imported into Self-Service as a brownfield application.
Brownfield application key points:
Privileges: Administrative privilege are required to import a brownfield application Brownfield applications do not support snapshot and restore capabilities See Brownfield Apps in Self-Service for detailed information.
Runbook Automation
Runbooks provide automation for operational workflows.

While blueprints are commonly used to define and deploy applications, runbooks are used to automate tasks and processes that may not require a full application deployment.
Runbooks can automate workflows such as:
- Calling REST APIs
- Running scripts
- Updating configuration
- Collecting information
- Performing validations
- Integrating with external systems
- Executing operational procedures
A runbook is made up of steps. Each step performs a specific action, and those steps can be connected together to define a larger workflow.
Runbooks can be simple or complex. A simple runbook may contain a single REST API call. A more advanced runbook may include multiple branches, conditional logic, input variables, output variables, and calls to several systems.
Runbooks are useful for standardizing repetitive operational work. Instead of requiring an administrator to manually perform the same task multiple times, the process can be defined once and executed consistently.
Common runbook use cases include:
- Creating or updating infrastructure objects
- Performing user or access configuration
- Calling external automation systems
- Collecting operational data
- Triggering remediation tasks
- Integrating with ITSM or collaboration tools
- Performing application maintenance steps
Runbooks can also be used as part of broader event-driven automation workflows. For example, an operational event may trigger a workflow that calls a runbook to collect more information, notify a team, or take a corrective action.
By combining Self-Service runbooks with automation triggers, organizations can reduce manual effort and improve operational consistency.
Endpoints
Endpoints define the systems that Self-Service can connect to when executing blueprint tasks or runbook steps.

An endpoint can represent a Nutanix management interface, an external REST API, a script execution target, or another system that is part of an automation workflow.
Endpoints allow Self-Service automation to interact with different systems in a controlled and reusable way.
For example, a runbook step that sends a REST API request could send the initial request to one Nutanix management endpoint, save the results of that request into output variables, then run subsequent steps on another endpoint.
This allows a runbook to operate across environments with one or more Nutanix management endpoints, as well as arbitrary or user-configured endpoints.
Endpoints are useful for workflows that need to:
- Call Nutanix APIs
- Integrate with third-party systems
- Run scripts against remote systems
- Retrieve data from external platforms
- Send information to ticketing, monitoring, or collaboration tools
- Chain automation steps across multiple systems
By defining endpoints centrally, administrators can simplify how automation workflows connect to the systems they need.
Global Variables
Global Variables allow administrators to define reusable values that can be referenced across Self-Service blueprints and runbooks.

Instead of defining the same value repeatedly in multiple automation artifacts, a Global Variable can be created once and reused where needed. This helps improve consistency, reduce duplication, and simplify updates across Self-Service content.
Global Variables are useful for values such as:
- Environment names
- Common URLs or endpoints
- Standard usernames
- Shared configuration values
- Site-specific or team-specific settings
- Reusable deployment parameters
- Common application values
- Team-specific naming conventions
When a blueprint or runbook references a Global Variable, the value is managed centrally. This allows teams to build more consistent automation patterns and reduce the need to manually update the same value in multiple places.
For example, an organization may have several blueprints and runbooks that reference the same internal endpoint, support email address, application version, or environment label. Without Global Variables, each blueprint or runbook may need to define that value separately. With Global Variables, the value can be defined once and reused.
Global Variables are especially helpful in environments where multiple teams create or maintain Self-Service content. They provide a centralized way to manage common values while still allowing blueprints and runbooks to remain modular and reusable. These variable names and types should be planned carefully because certain properties may not be editable after creation.
Global Variables can help teams:
- Standardize commonly used values
- Reduce duplicate configuration
- Simplify updates across automation content
- Improve consistency across blueprints and runbooks
- Support reusable automation patterns
Self-Service Store Application Deployment
The NCM Self-Service Store provides a curated catalog of applications and automation content that users can deploy.

Instead of requiring users to build applications manually, administrators can publish approved blueprints to the Self-Service Store. Users can then select from those published items and deploy applications through a guided experience.
In NCM 2.0, the Self-Service Store is accessed through the Self-Service experience in Nutanix Central, providing a centralized catalog for approved application deployments.
Self-Service Store application deployment helps organizations provide a cloud-like consumption experience while maintaining governance and control.
A blueprint must be published to the Self-Service Store before users can deploy it from the catalog. Once published, the store, items can include user-facing details such as name, description, icon, version, and deployment options.
Self-Service Store items can also go through approval workflows, depending on the policies configured for the project or environment.
The deployment process for an application can be monitored via the audit tab within the app.

This provides a balance between self-service access and administrative control. Users can deploy approved applications without needing direct access to all underlying infrastructure controls, while administrators maintain governance over what can be deployed and where.
Built-in Application Blueprints
NCM Self-Service may include built-in application blueprints that provide examples or starting points for common application deployments.

Built-in blueprints can help users learn how Self-Service models applications and automation workflows. They can also help administrators accelerate creation of their own application catalog by starting from an existing pattern.
Administrators can publish approved blueprints to the Self-Service Store so users can deploy them in a consistent and governed way.
When creating production-ready Self-Service Store items, administrators should review and update blueprint configuration, images, credentials, variables, deployment locations, and policies to align with organizational standards.
Project-Based Governance
NCM Self-Service uses projects to define how and where a VM or application can be deployed.
A project is a collection of users, infrastructure resources, quotas, policies, and related configurations that establish deployment boundaries for Self-Service users.
Projects help administrators control access and consumption while still enabling users to deploy and manage applications through Self-Service.
A project can include:
- Users and groups
- Infrastructure
- Clusters that can host VMs and application components
- Associated networking resources, such as subnets
- Policies and quotas via the NCM Self-Service Policy Engine
- Linked services such as Nutanix Database Service, where applicable
Project-based governance provides the ability to control which users are permitted to carry out specific tasks, where those tasks can be carried out, and how many resources a user’s deployment may consume.
This is important because self-service access should not mean unrestricted access. Projects allow administrators to define boundaries that align with team ownership, infrastructure capacity, security requirements, and operational standards.
For example, a project may be created for a development team. That project can define:
- Which users are members of the project
- Which clusters the team can deploy to
- Which networks are available
- How much CPU, memory, and storage the project can consume
- Which policies apply to deployments
- Which Self-Service Store items are available
This allows users to deploy applications within approved boundaries without requiring infrastructure administrators to manually process every request.
Project-based governance is a core part of the Self-Service operating model. It helps organizations provide agility to users while maintaining control over infrastructure resources.
Project Analysis
Because Self-Service uses projects to define deployment boundaries and resource access, analysis of workload allocations within a project is easily visible.

A user can quickly see resource utilization for deployed applications within a project, the number of deployed VMs associated with the project, and quota consumption for that project.
Project analysis helps administrators and project owners understand how resources are being used.
This visibility helps teams manage consumption more effectively. It also supports better communication between infrastructure teams and application owners.
Project analysis is especially useful when combined with governance and cost visibility. For example, project-level utilization can help teams understand how infrastructure resources are being consumed by different teams, applications, or business units.
Self-Service Policies
NCM Self-Service policies provide governance for application deployment and management.
Policies help administrators define rules for how Self-Service users can consume infrastructure and execute automation workflows.

All NCM Self-Service policies are managed through the Policy Engine within the Self-Service UI.
In NCM 2.0, these policy workflows are accessed through Self-Service in Nutanix Central.
Common policy types include:
- Approval policies
- Scheduler policies
- Application governance policies
Approval policies allow administrators to require approval before certain actions are performed. For example, a policy may require approval before a user deploys an application, scales an application, or performs a specific day-2 action.
Scheduler policies allow administrators to define when certain actions should occur. For example, an application may be scheduled to start or stop at specific times to reduce resource consumption in development or test environments.
Application governance policies help define how applications are controlled throughout their lifecycle. These policies can help ensure that users follow approved operating standards.
Policies are important because they help Self-Service balance agility with control. Users can perform authorized actions through the catalog and automation workflows, while administrators maintain governance over the actions that require review, approval, or scheduling.
NCM Self-Service DSL
In addition to the extensive management capabilities available in the Self-Service UI, NCM Self-Service provides an extremely broad, developer friendly DSL. A DSL, or Domain Specific Language allows developers and scripting administrators to leverage Self-Service using standard programmatic approaches. The NCM Self-Service DSL specifically is an open-source Python language enabling the programmatic control of Self-Service features directly from your Python scripts.
DSL can be used for workflows such as:
- Creating blueprints
- Updating blueprints
- Launching applications
- Managing application lifecycle actions
- Working with variables
- Automating Self-Service content promotion
- Integrating blueprint development into source control workflows
Using DSL can help teams standardize how Self-Service content is created, reviewed, and maintained.
Some Self-Service DSL highlights include:
Ease of use: Straight-forward syntax enabling the easy consumption of key NCM Self-Service features such as blueprint creation, application launch and day-2 operations
Platform agnostic: Python is supported on a wide range of operating systems, making the Self-Service DSL’s code usable in an equally wide range of environments
Portability: A complete, DSL-based deployment can be packaged and moved between environments with minimal effort, or stored in source control systems such as GitHub or GitLab
The Self-Service UI is useful for visual design and day-to-day use, while DSL is useful for teams that prefer a code-based approach to managing automation content.
Summary
NCM Self-Service provides application automation, Self-Service Store, governance, and runbook automation capabilities as part of Nutanix Cloud Manager.
With NCM 2.0, Self-Service is accessed through Nutanix Central, providing a centralized experience for designing, publishing, deploying, managing, and automating applications.
Key capabilities include:
- Blueprint-centric application design
- Deployment to supported on-premises and cloud locations
- Runbook automation for operational workflows
- Endpoints for integration with Nutanix and external systems
- Global Variables for reusable blueprint and runbook values
- Self-Service store-based application deployment
- Project-based governance for users, infrastructure, quotas, and policies
- Self-Service policies for approvals, scheduling, and governance
- Self-Service DSL for programmatic automation content management
Together, these capabilities help organizations provide a governed self-service experience for application teams while maintaining infrastructure control, operational consistency, and automation reuse.
» Download this section as PDF (opens in a new tab/window)
Nutanix Cloud Manager (NCM) Security Central is a Software as a Service (SaaS) based offering that provides microsegmentation security planning, threat detection alerts, and continuous compliance monitoring. Using multiple Machine Learning (ML) models and algorithms such as Leiden community detection, Arima, tree based, and clustering, Security Central gives insight into the security of your on-premises deployments based on over 300 audit checks and security best practices.
The Security Central portal at https://flow.nutanix.com/securitycentral provides an inventory and configuration assessment of your on-premises infrastructure to scan for common and high-risk configuration errors. Security Central users can also get instant insights on security status by using custom or system-defined SQL like queries. Powered by this inventory and coupled with compliance tracking tools, security posture monitoring is also provided. Finally, network flow data ingested from on-premises AHV clusters provides near real-time threat detection based on machine learning analysis of traffic patterns.
Supported Environments
- Nutanix on-premises
- Private cloud using AHV with Flow Network Security enabled
Management Interface(s)
- Nutanix Security Central SaaS UI
- Security Central VM (SC VM)
- Initial configuration and upgrades when necessary
Implementation Constructs
Security Central introduces a few new constructs to provide a security monitoring and management framework. Here are the two elements introduced:
- Security Central VM (SC VM)
- Used during initial configuration
- IPFix log collection
- Inventory collection
- Push security policy configurations
- Security Central SaaS
- Security posture monitoring
- User & network anomaly detection
- Compliance reporting
- Microsegmentation security planning
- Inventory and query
Upgrades
- Automatic as Security Central is a SaaS platform
- As new features are released, they are available at the next login.
- On occasion, an upgrade to the on-prem SC VM may be required to enhance functionality
- Upgrades can be performed on the Security Central VM Settings page
- The latest SC VM images (both GUI and server-only) are located on the Nutanix Portal
Security Central Architecture Overview
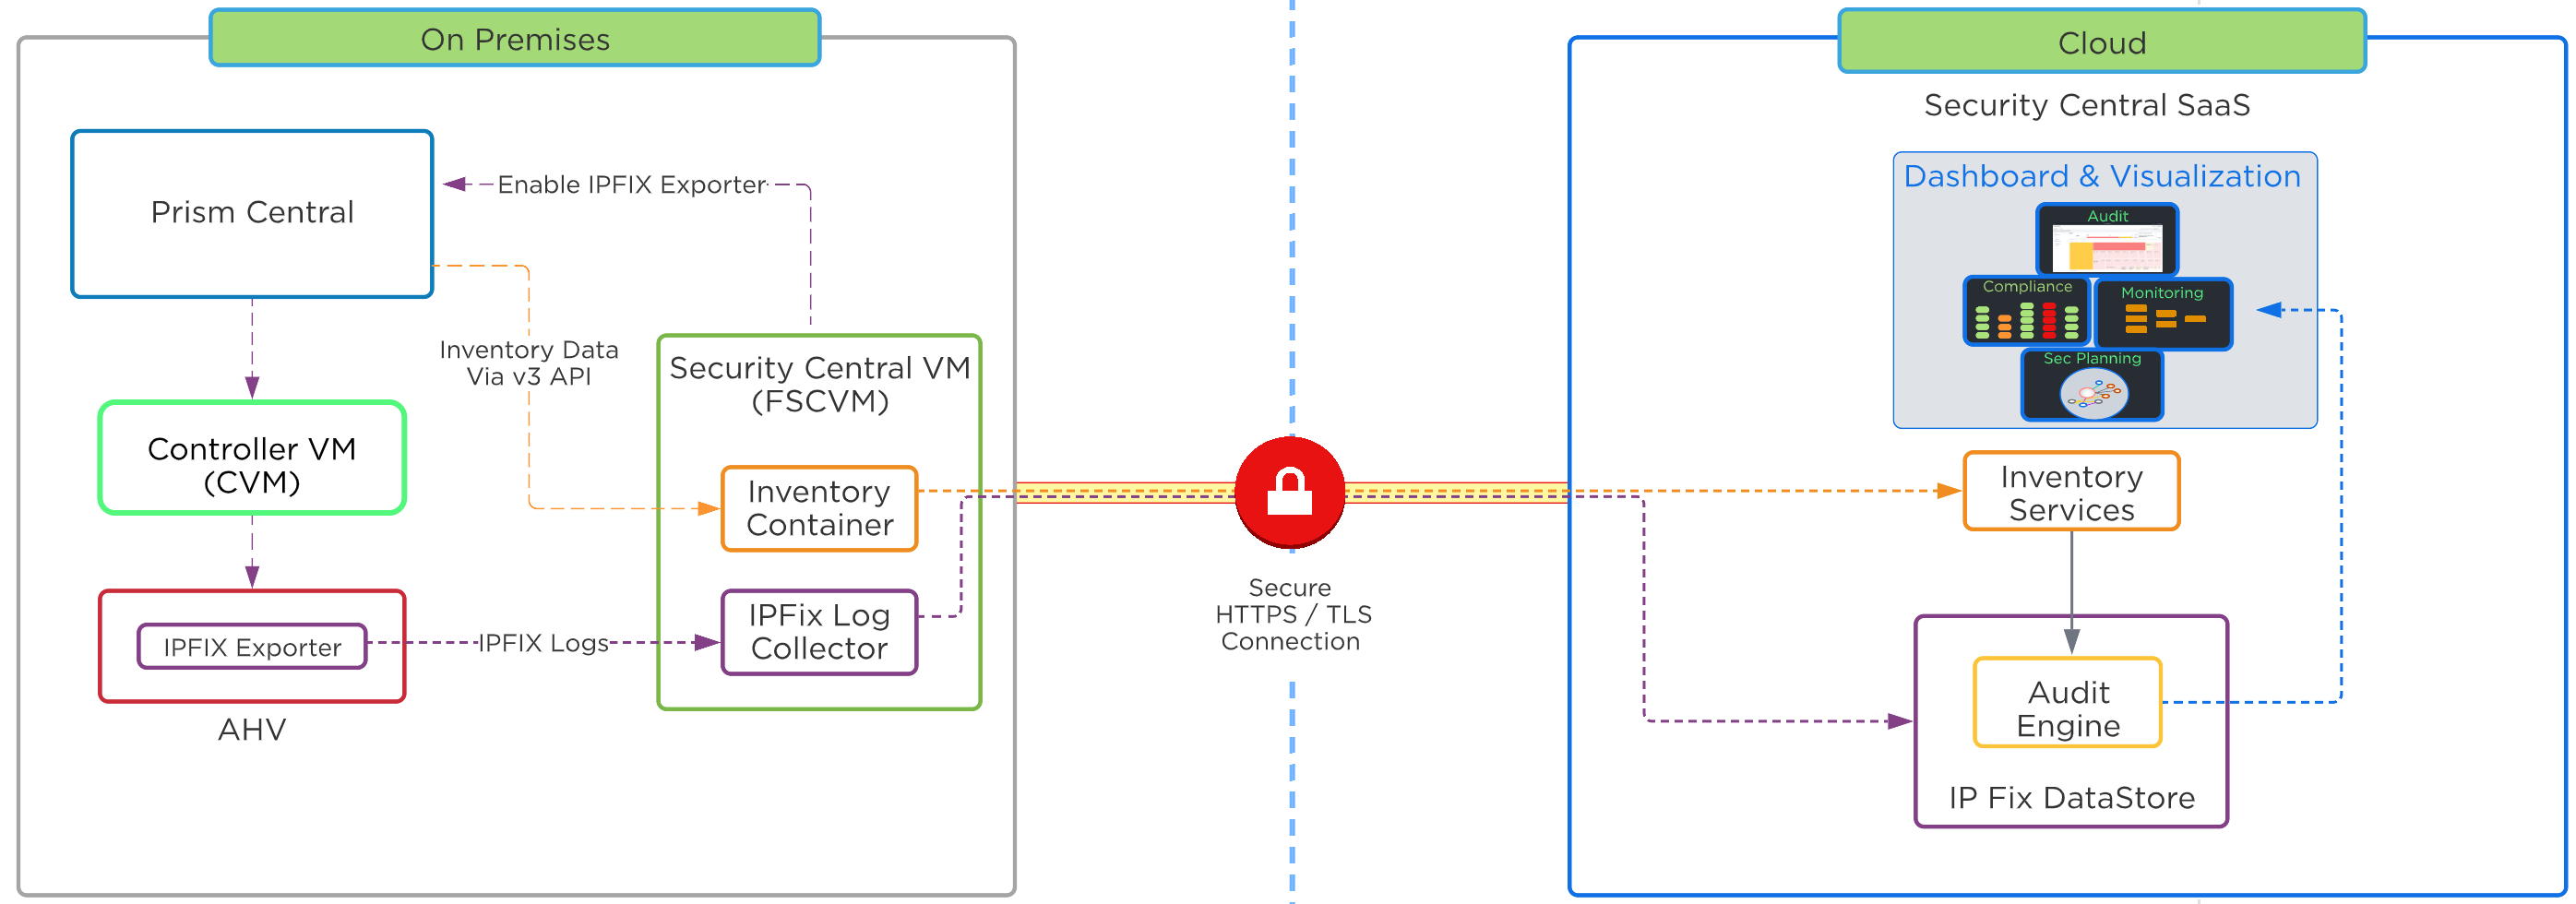 Security Central Architecture Overview
Security Central High Level Architecture Detail
Security Central introduces a new service VM known as the SC VM, which is required to enable security monitoring for Nutanix clusters. The SC VM acts as a proxy and aggregates information from the Nutanix clusters. It then sends this information to Security Central through a secure network connection. The SC VM collects inventory information about the environments and VMs, referred to as metadata. Security Central does not collect any data owned by the VM, such as installed software packages and versions.
Once installed, the administrator connects to the SC VM UI to enable network log collection. The SC VM then instructs Prism Central to enable the IPFIX exporter on all AHV clusters managed by this Prism Central instance. The SC VM also collects cluster inventory information from Prism Central for all registered clusters and VMs. The inventory information collected includes items such as VM names, connected network information, configuration information and any categories which may be assigned to the VMs. Inventory polling recurs every 3 hours and the SaaS portal can log changes and perform analysis.
Inventory and IPFix logs are securely transmitted to the Security Central SaaS environment using HTTPS/TLS connections. IPFix logs are transmitted in hourly intervals allowing the SC VM to transmit data in batched increments, decreasing storage capacity required for the SC VM and reducing network constraints to the cloud. Administrators can push required inventory updates to the cloud manually using the SC VM user interface if needed.
An SC VM is needed for each Prism Central (PC) deployment regardless of the number of clusters managed by that PC. The SC VM will facilitate internal communications to Prism Central, and outbound communication to the SaaS portal. Security Central uses the TCP ports listed below for communication between components. Please ensure that your firewall has the following ports open:
- TCP Port 9440 for the SC VM to connect to the Prism Central VM
- TCP Port 443 from the SC VM to connect to *.nutanix.com and *.amazonaws.com
Refer to the Security Central Ports and Protocols page for the complete list of ports.
The SC platform undergoes strict security controls. Visit Nutanix Trust to view Security Central compliance certifications and learn more.
To ensure you meet the configuration requirements for the Security Central VM, please consult the Security Central Guide.
Core Use Cases
- Monitoring and Visibility
- Dashboards, asset inventory, reporting, and alerts
- Audit and Remediation
- Insights on Nutanix environments and automated security audits
- Compliance
- Continuous environment monitoring, automated compliance checks, and assessment for PCI, and HIPAA
- Security Planning
- VM to VM network traffic visualization, workload categorization, automated security policy recommendation
- Investigating Violations
- Perform detailed investigation with an SQL like query language
- Threat Detection Alerting
- Network- and user-based anomaly detection. End user behavior analysis (EUBA) helps to detect internal and external security threats
Security Central Key Features
Main Dashboard
The first screen presented after successful login to Security Central is the main dashboard. The dashboard provides an at-a-glance view of the many areas monitored and alerted on by Security Central. More detailed displays can be launched from the context of each individual widget.
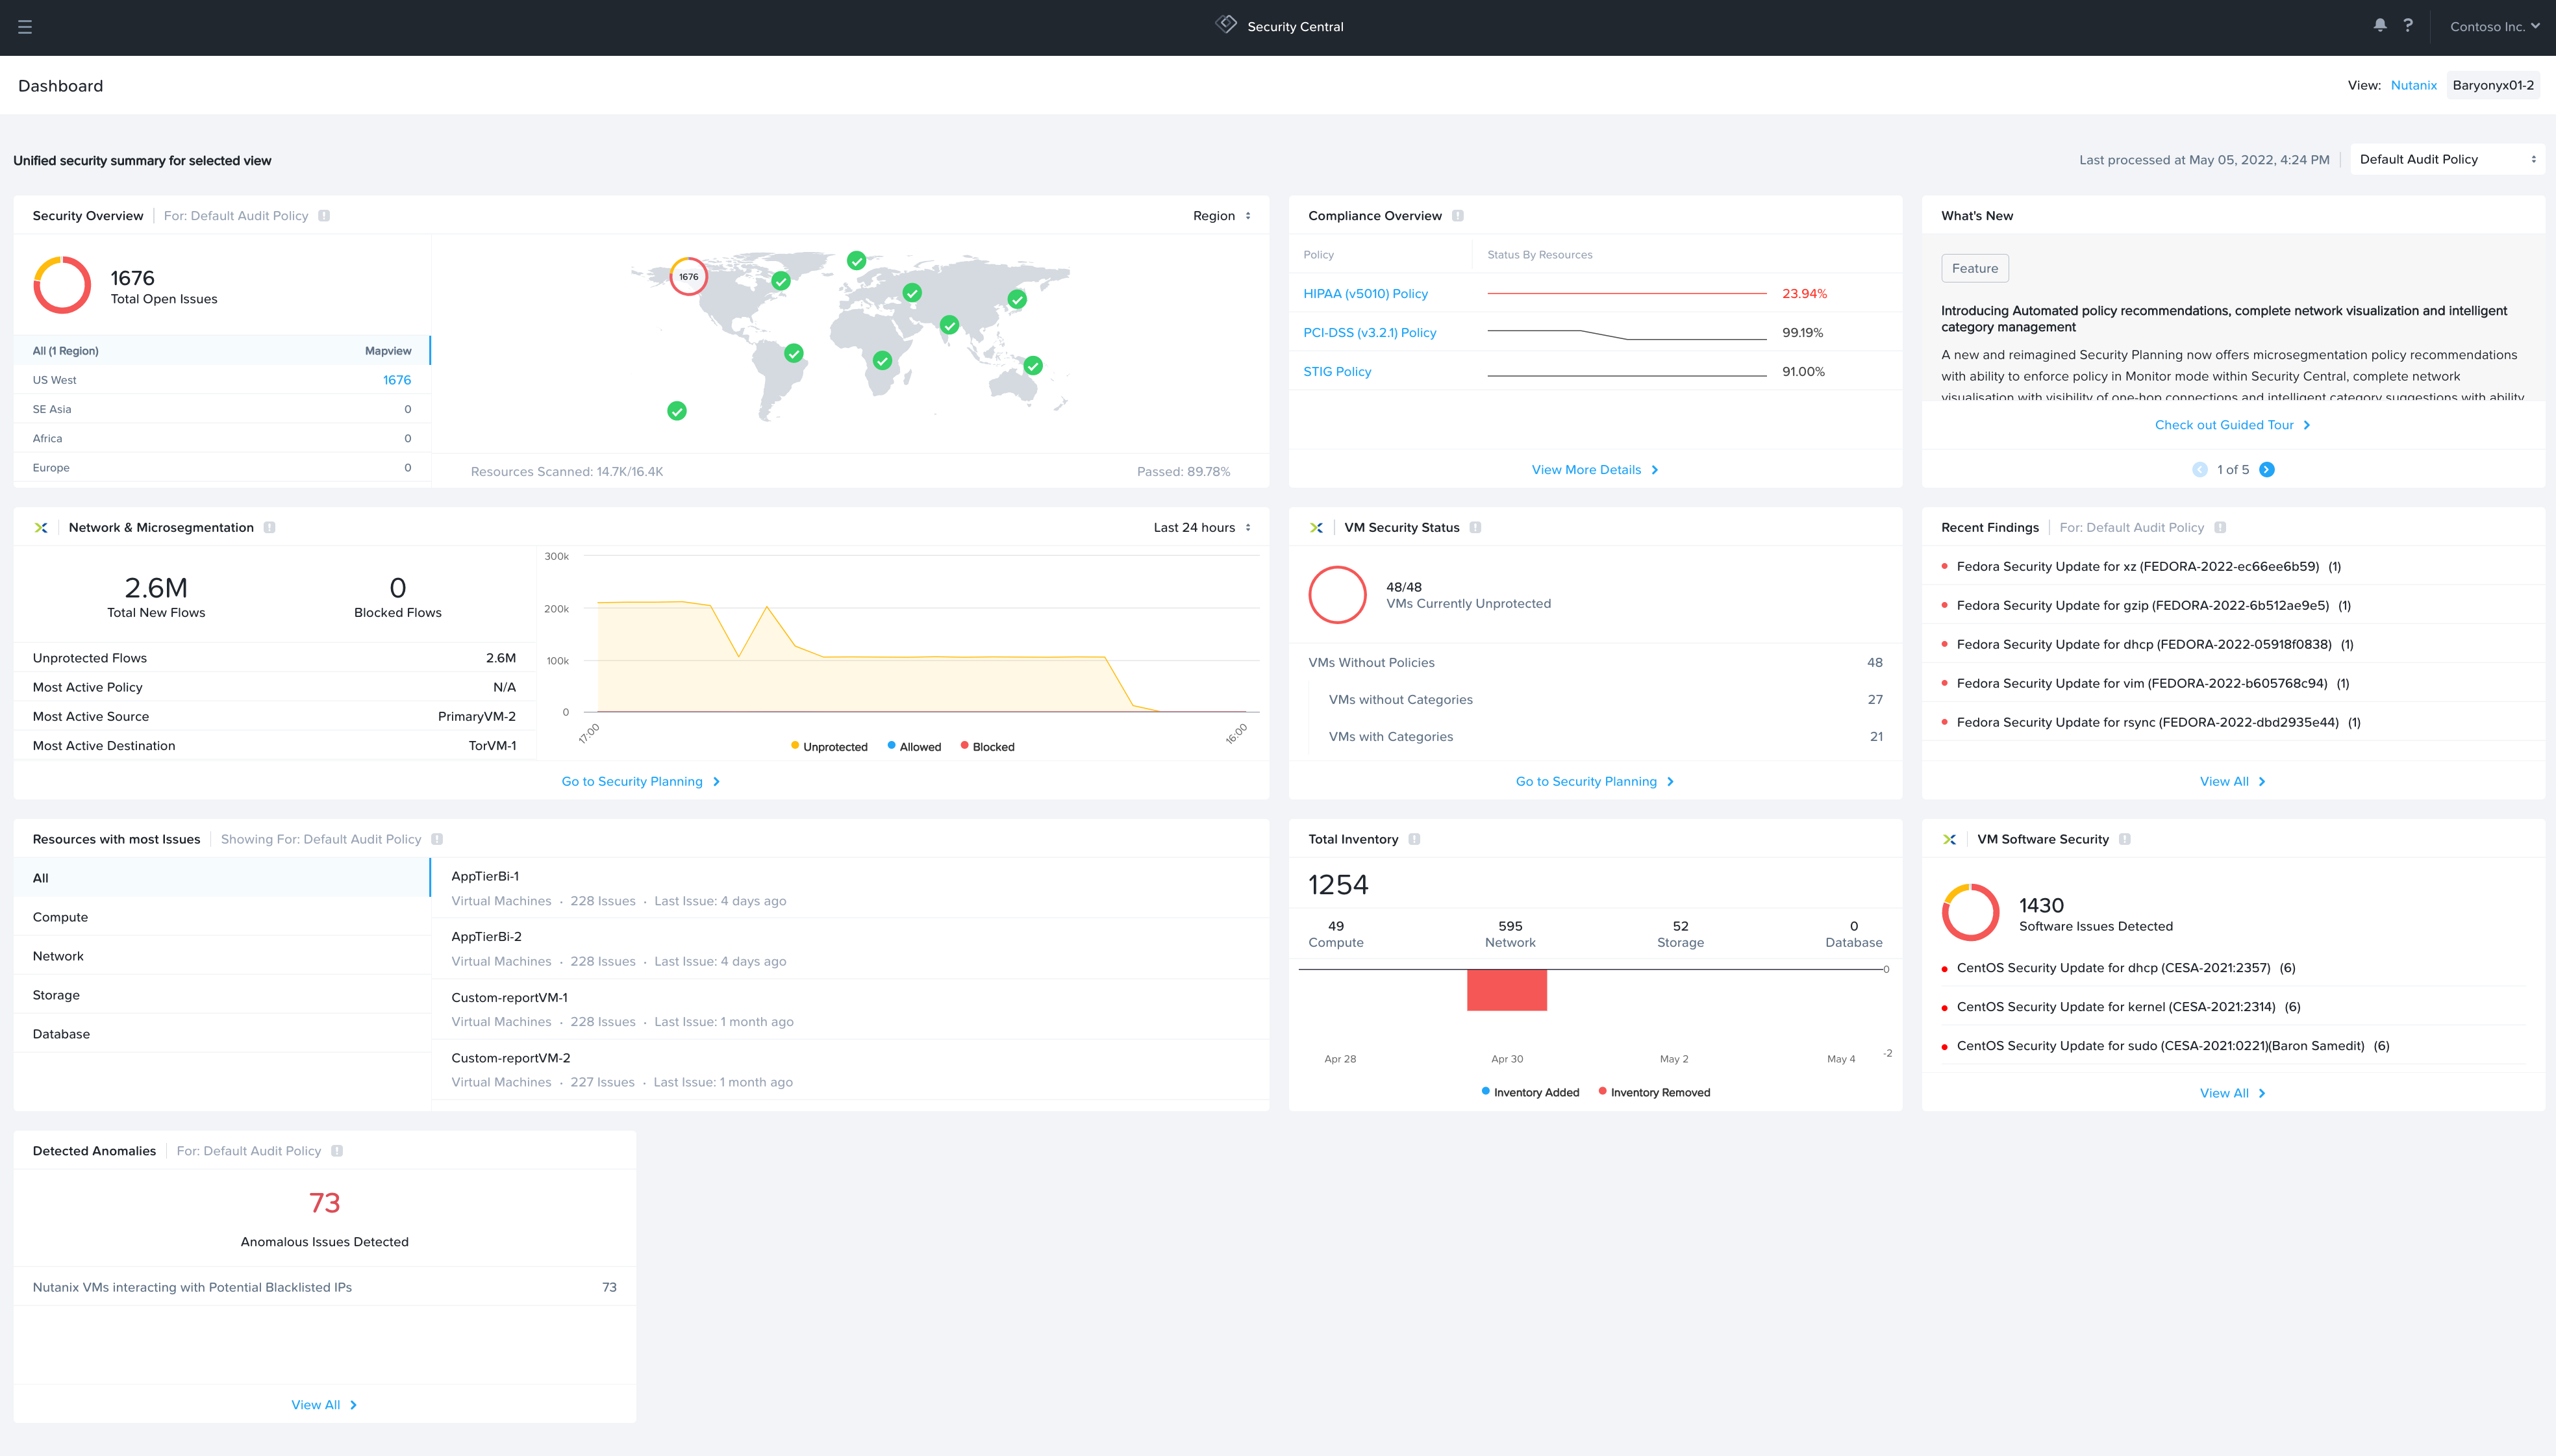 Security Central Main Dashboard
Audit and Remediation
Utilizing security audits provides deep insights into the security of your on-premises deployments. Security Central runs more than 500 out-of-the-box automated security audits of your environment and reports any audit failures along with steps to remediation. Security Central audit checks align to the following categories and Nutanix security best practices:
- Access Security
- Configuration and alerts for items that could allow unprivileged access or lack of access auditing
- Data Security
- Nutanix clusters without Data-at-Rest Encryption (DARE) enabled. DARE is an essential component to securing your infrastructure that prevents unauthorized access to data by systems and users that do not possess the encryption keys.
- Host Security
- Nutanix VMs without backup protection enabled, making it difficult to recover should a VM be infected by ransomware
- Logging & Monitoring
- Prism Central critical alerts unacknowledged could indicate that alerts are being ignored or missed. These alerts can indicate a potential exposure risk that could put your infrastructure in jeopardy
- Network Security
- VMs allow all traffic from all sources can create an exceptionally large attack surface for malicious actors to compromise the VM and infiltrate your environment.
In addition to the constantly updated built-in audits, Security Central provides the capability to customize audits and reports using Common Query Language (CQL). This allows you to run CQL queries on your on-prem inventory for various attributes, and create audit checks for your specific use-cases.
Compliance
Compliance is critical for many Nutanix customers. Maintaining compliance allows you to validate that your company’s operating environments meet the governing standards they must follow. Monitoring environments for compliance can be challenging and time consuming. Continuous compliance monitoring capabilities are needed to stay on top of ever changing requirements, regulations and environments. Customers benefit from automating these checks, allowing for a concise view and faster time to resolution when addressing compliance violations.
Security Central provides audit checks for common regulatory frameworks such as PCI-DSS, HIPAA, NIST and Nutanix security best practices. The Compliance dashboard provides a compliance score for each of the frameworks being monitored. The score elements can be further examined to view elements of the given framework that are monitored and audited, the number of passed checks and the number of failed checks. The compliance view provides detail on these checks such as which check failed, which section of the framework the check is associated with, and what issues were discovered. The compliance reports and their details can also be exported for offline use and sharing. Security Central also provides extensible capabilities that allow you to create custom audits and custom compliance policies that are based on your business requirements.
Findings and Alerts
“A problem well-stated is a problem half-solved.” - Charles Kettering
With the ever changing threat landscape, security monitoring and alerting is critical in today’s environments. Continuously monitoring for and alerting on threats and vulnerabilities found in your network, security controls, servers, endpoints and user applications allowing a proactive approach to alerting in order to strengthen your overall security posture and providing a quicker time to resolution when an issue is detected.
The Findings and Alerts view within Security Central provides a view into your current security posture. This view displays detected configuration issues and anomalous behaviors observed in your Nutanix clusters that are being monitored by Security Central. These findings are based on the selected audit policy. Users have customizable options on how these issues are displayed, providing great flexibility to tailor the findings by audit categories, resources, roles, and business requirements.
Threat Detection Alerts are included within the Findings and Alerts view. Security Central analyzes the Nutanix IPFix network logs to detect and report observed potential threats and anomalous behavior occurring within the monitored Nutanix clusters. These alerts are modeled using machine learning and observed data points. The following are some of the potential threats and behaviors being detected along with the minimum number of days or data-points that must be observed in order for the anomaly to trigger an entry or alert :
- VMs communicating with Blacklisted IPs (known suspect IPs)
- 1 data-point
- VMs with potential Dictionary Attack
- 1 data-point
- VMs with potential Denial of Service (DDOS)
- 21 days
- VLANs with unusual network behavior
- 21 days
- VMs with unusual network behavior
- 21 days
- VMs with potential Port Scan Attack
- 21 days
- VMs with potential Data Leak Attacks
- 21 days
Security Planning
When planning to secure an application, there are many components to discovery and information collection required to create an effective security policy. Gathering this information can be quite the challenge. You are often tasked with collecting logs from firewalls, networking gear, applications and operating systems to gain an understanding of your application’s communication profile. Once that data has been gathered and analyzed, you will consult with the application owners to compare the observed findings to the expected behavior.
Security Central’s ML-based Security Planning provides a detailed visualization to aid you in discovery and planning of your application security policies. You can visualize your network traffic flows within your Nutanix on-prem clusters and Security Central makes recommendations on how to categorize and secure your applications.
Within the Security Planning section, you have the flexibility to utilize up to 2 levels of groupings for your applications and environments. This capability allows you to drill down your analysis to specific clusters, VLANs, VMs, and categories, making it extremely helpful to focus on securing your applications. With this grouping, you also have the capability to download all observed or filtered network traffic for further offline sharing, discovery, and planning.
Using the inherent machine learning capabilities, Security Central also has the ability to make category recommendations and assignments to VMs based on observed network flows. This can be especially useful in new microsegmentation or application deployments. Categorizing your application VMs is an important step to securing your application. To take it a step further, Security Central can also generate inbound and outbound rule recommendations and create application security policies in monitor mode on your Nutanix AHV clusters.
With the security policy in monitor mode, you can observe the behavior of the application being secured, without applying the policy actions. You can use Prism Central to make edits of the policy if needed prior to enforcing the policy.
Investigate
Investigate helps you analyze security and operational insights for your on-prem infrastructure. It allows you to analyze network logs and security configurations using CQL (Common Query Language). CQL queries offer a user-friendly experience, similar to SQL. To get desired almost real-time results, you can effortlessly run CQL queries on on-premises infrastructure.
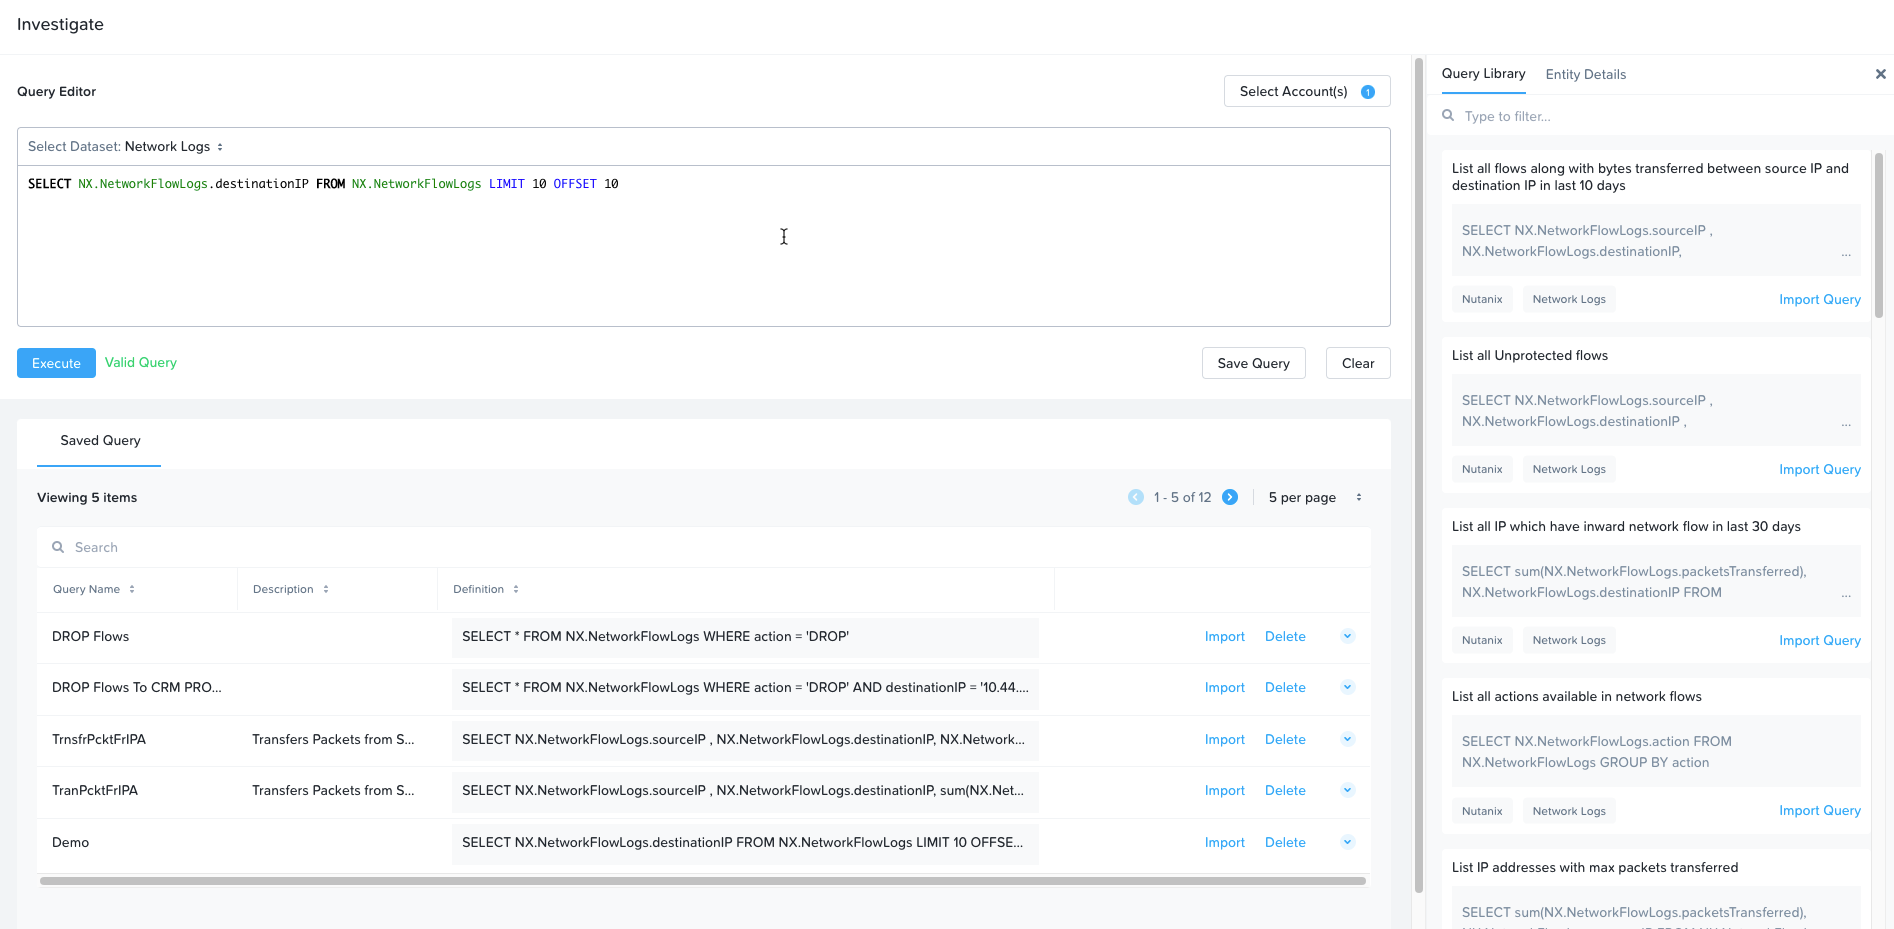
Investigate supports following types of queries:
-
Inventory and Config: Search for the resource inventory and configuration in your on-premises environment
-
Network: Search network events in your on-premises environment
Providing cross stack visibility is one of the prime use case for investigate in hybrid cloud environments. For example, in most cases we have multiple stacks of security rules. For the on-premises side we may have Flow Network Security policies. In this case investigate queries can provide a list of all the microsegmentation policies and on-prem security posture guardrails applied to particular VMs.
The investigate feature also provides a library of most used queries to start with and sets the baseline to create more complex queries based on your needs
Example queries:
List VM with status (protected or unprotected) and the policy name if the VM is protected:
SELECT NX.VM.name, NX.VM.NetworkPolicy.*, NX.VM.Category.* FROM NX.VM
Integrations
Security architectures often consist of solutions from multiple vendors to build a defense-in-depth posture. Solutions that monitor endpoints for threats and vulnerabilities, ticketing systems, log management, and threat and event analytics can all be critical components in a security architecture. While these products are essential, they are often standalone with limited integration with other components of the security infrastructure. Integration is key to bringing security solutions together within the construct of a security architecture. This drives efficiency and faster time to threat awareness, analysis, and threat remediation.
Security Central provides the capability to integrate non-Nutanix applications directly with Security Central. These integrations cover multiple solutions from OS level monitoring and protection to enterprise ticketing systems and analysis engines. Some of the supported integrations are listed below:
- Splunk
- Webhook
- ServiceNow
More detailed information on the specifics of each integration can be found in the Security Central guide.
PrismLearn about the Nutanix control plane, a one-click management and interface for datacenter and cloud operations.
» Download this section as PDF (opens in a new tab/window)
prism - /’prizɘm/ - noun - control plane
one-click management and interface for datacenter operations.
Building a beautiful, empathetic and intuitive product is core to the Nutanix platform and something we take very seriously. This section will cover our design methodologies and how we iterate on design.
You can download the Nutanix Visio stencils here: http://www.visiocafe.com/nutanix.htm
» Download this section as PDF (opens in a new tab/window)
Prism is a distributed resource management platform which allows users to manage and monitor objects and services across their Nutanix environment, whether hosted locally or in the cloud.
These capabilities are broken down into two key categories:
- Interfaces
- HTML5 UI, REST API, CLI, PowerShell CMDlets, etc.
- Management Capabilities
- Platform management, VM / Container CRUD, policy definition and compliance, service design and status, analytics and monitoring
The following figure illustrates the conceptual nature of Prism as part of the Nutanix platform:
High-Level Prism Architecture
Prism is broken down into two main components:
- Prism Central (PC)
- Multi-cluster manager responsible for managing multiple Nutanix Clusters to provide a single, centralized management interface. Prism Central is an optional software appliance (VM) which can be deployed in addition to the AOS Cluster (can run on it).
- 1-to-many cluster manager
- Prism Element (PE)
- Localized cluster manager responsible for local cluster management and operations. Every Nutanix Cluster has Prism Element built-in.
- 1-to-1 cluster manager
The figure shows an image illustrating the conceptual relationship between Prism Central and Prism Element:
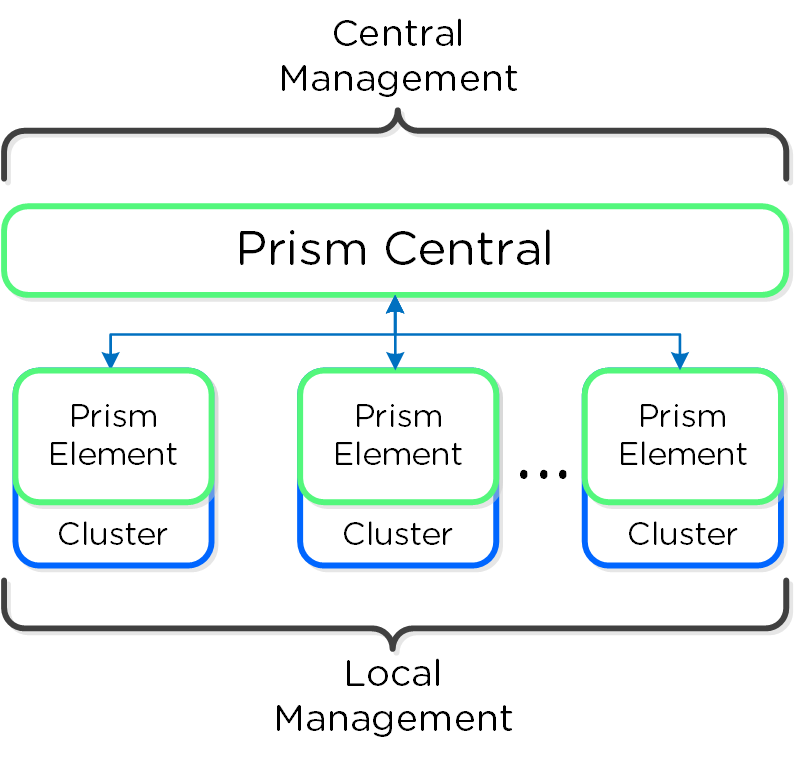 Prism Architecture
Note
Pro tip
For larger or distributed deployments (e.g. more than one cluster or multiple sites) it is recommended to use Prism Central to simplify operations and provide a single management UI for all clusters / sites.
Prism Services
A Prism service runs on every CVM with an elected Prism Leader which is responsible for handling HTTP requests. Similar to other components which have a Leader, if the Prism Leader fails, a new one will be elected. When a CVM which is not the Prism Leader gets a HTTP request it will permanently redirect the request to the current Prism Leader using HTTP response status code 301.
Here we show a conceptual view of the Prism services and how HTTP request(s) are handled:
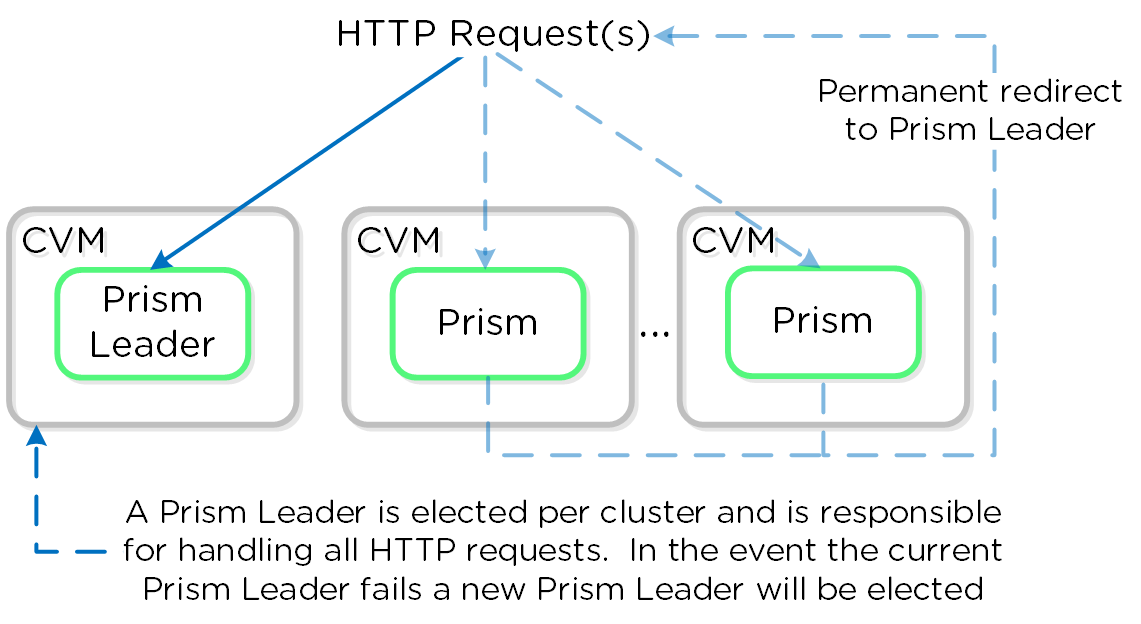 Prism Services - Request Handling
Note
Prism ports
Prism listens on ports 80 and 9440, if HTTP traffic comes in on port 80 it is redirected to HTTPS on port 9440.
When using the cluster external IP (recommended), it will always be hosted by the current Prism Leader. In the event of a Prism Leader failure the cluster IP will be assumed by the newly elected Prism Leader and a gratuitous ARP (gARP) will be used to clean any stale ARP cache entries. In this scenario any time the cluster IP is used to access Prism, no redirection is necessary as that will already be the Prism Leader.
Note
Pro tip
You can determine the current Prism leader by running the following command on any CVM:
curl localhost:2019/prism/leader
Authentication and Access Control (RBAC)
Authentication
Prism currently supports integrations with the following authentication providers:
- Prism Element (PE)
- Local
- Active Directory
- LDAP
- Prism Central (PC)
- Local
- Active Directory
- LDAP
- SAML Authn (IDP)
Note
SAML / 2FA
SAML Authn allows Prism to integrate with external identity providers (IDP) that are SAML compliant (e.g. Okta, ADFS, etc.).
This also allows you to leverage the multi-factor authentication (MFA) / two-factor authentication (2FA) capabilities these providers support for users logging into Prism.
Access Control
Coming soon!
» Download this section as PDF (opens in a new tab/window)
Prism is fairly straight forward and simple to use, however we’ll cover some of the main pages and basic usage.
Prism Central (if deployed) can be accessed using the IP address specified during configuration or corresponding DNS entry. Prism Element can be accessed via Prism Central (by clicking on a specific cluster) or by navigating to any Nutanix CVM or cluster IP (preferred).
Once the page has been loaded you will be greeted with the Login page where you will use your Prism or Active Directory credentials to login.
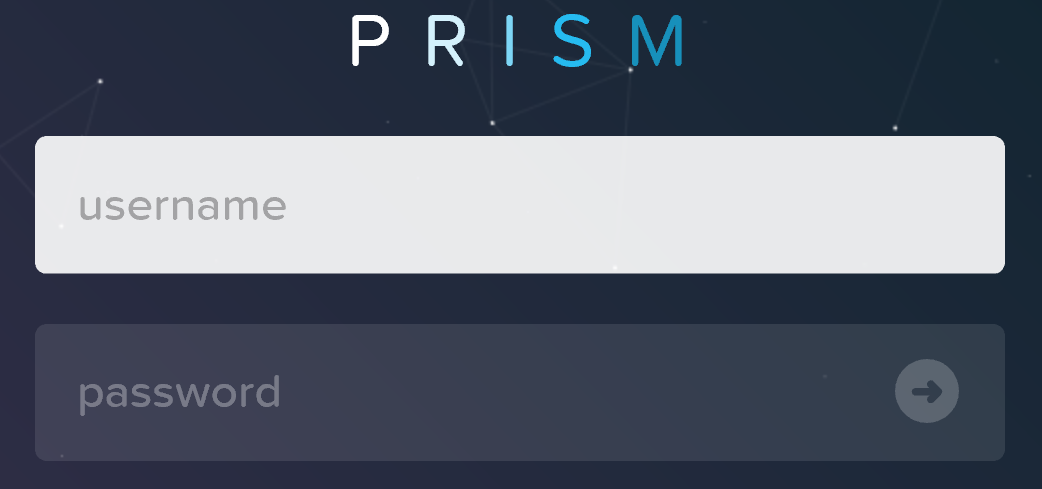 Prism Login Page
Upon successful login you will be sent to the dashboard page which will provide overview information for managed cluster(s) in Prism Central or the local cluster in Prism Element.
Prism Central and Prism Element will be covered in more detail in the following sections.
Prism Central
The figure shows a sample Prism Central dashboard where multiple clusters can be monitored / managed:
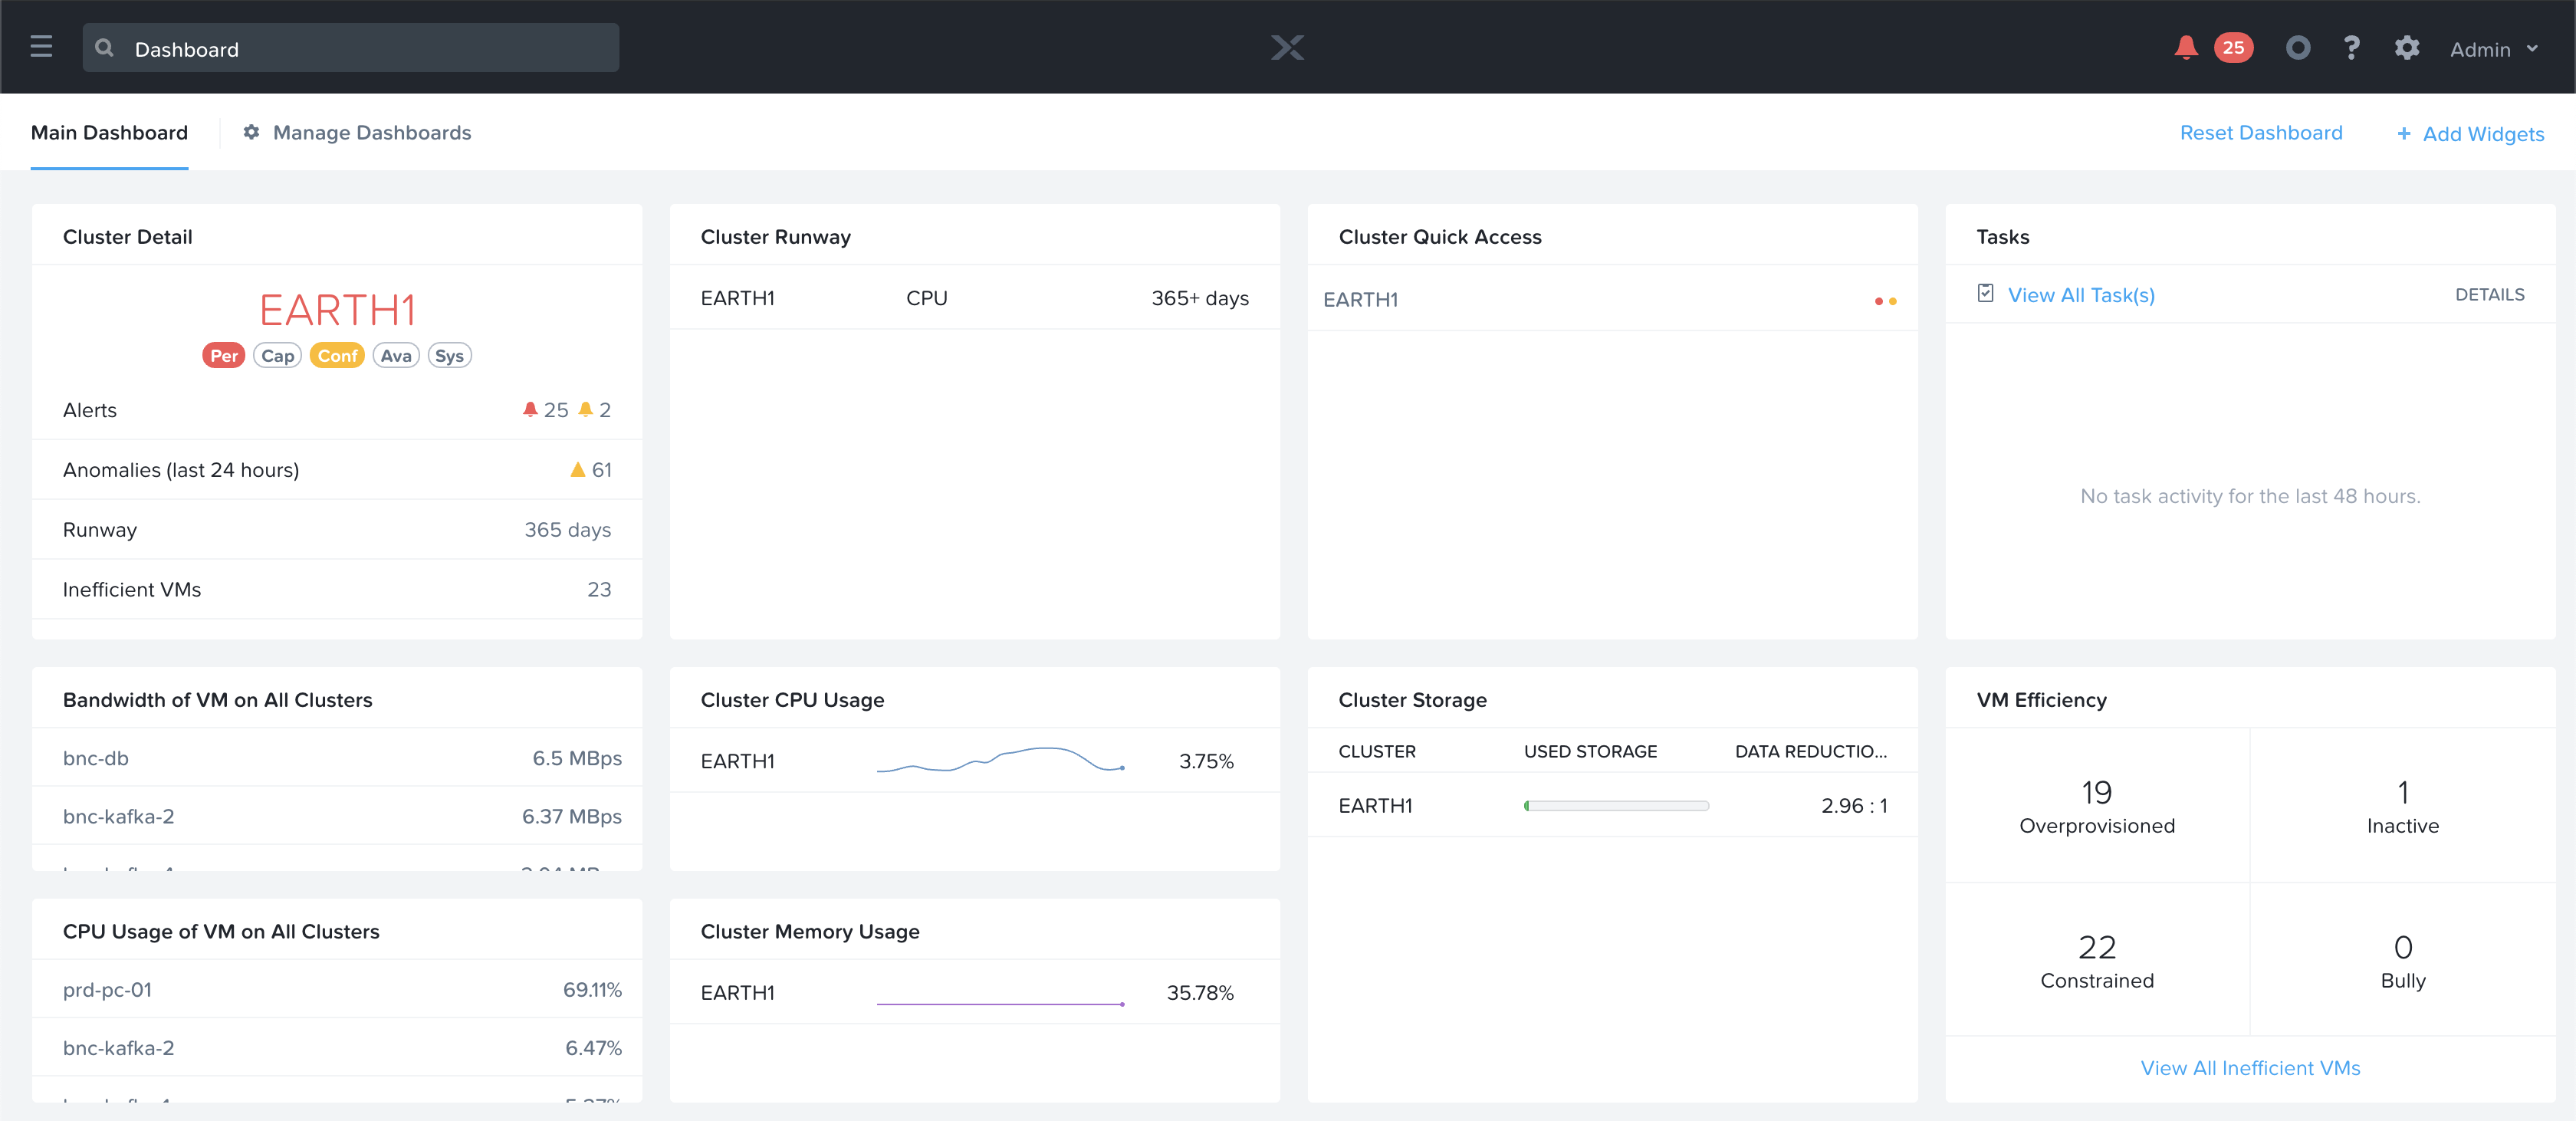 Prism Central - Dashboard
From here you can monitor the overall status of your environment, and dive deeper if there are any alerts or items of interest.
Prism Central contains the following main pages (NOTE: Search is the preferred / recommended method to navigation):
- Home Page
- Environment wide monitoring dashboard including detailed information on service status, capacity planning, performance, tasks, etc. To get further information on any of them you can click on the item of interest.
- Virtual Infrastructure
- Virtual entities (e.g. VMs, containers, Images, categories, etc.)
- Policies
- Policy management and creation (e.g. security (FLOW), Protection (Backup/Replication), Recovery (DR), NGT)
- Hardware
- Physical devices management (e.g. clusters, hosts, disks, GPU)
- Activity
- Environment wide alerts, events and tasks
- Operations
- Operations dashboards, reporting and actions (X-Play)
- Administration
- Environment construct management (e.g. users, groups, roles, availability zones)
- Services
- Add-on service management (e.g. Calm, Karbon)
- Settings
- Prism Central configuration
To access the menu click on the hamburger icon::
 Prism Central - Hamburger
The menu expands to display the available options:
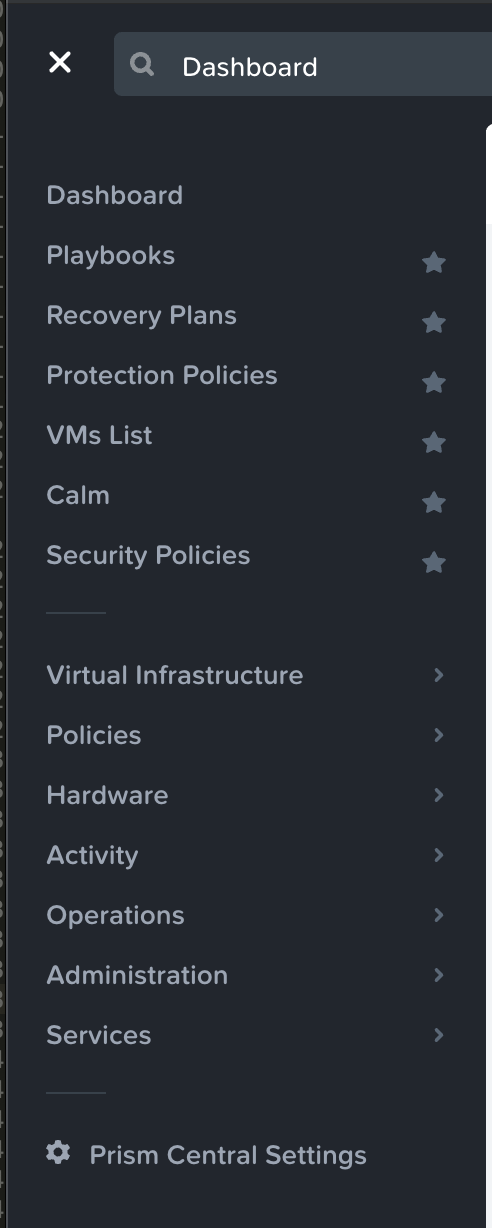 Prism Central - Menu Bar
Search
Search is now the primary mechanism for Navigating the Prism Central UI (menus are still available).
To use the search bar to navigate you can use the search bar in the top left corner next to the menu icon.
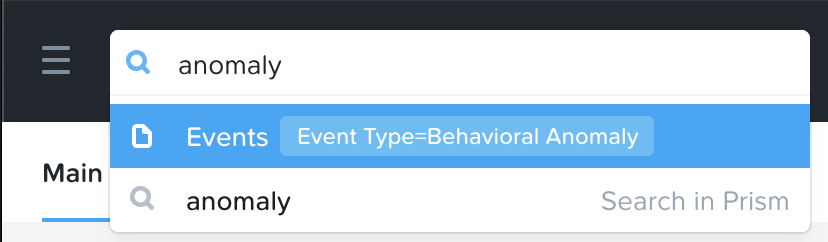 Prism Central - Search
Note
Search Semantics
PC Search allows for a great deal of semantics to be leveraged, some examples include:
| Rule | Example |
|---|---|
| Entity type | vms |
| Entity type + metric perspective (io, cpu, memory) | vms io |
| Entity type + alerts | vm alerts |
| Entity type + alerts + alert filters | vm alerts severity=critical |
| Entity type + events | vm events |
| Entity type + events + event filters | vm events classification=anomaly |
| Entity type + filters (both metric and attribute) | vm “power state”=on |
| Entity type + filters + metric perspective (io, cpu, memory) | vm “power state”=on io |
| Entity type + filters + alerts | vm “power state”=on alerts |
| Entity type + filters + alerts + (alert filters) | vm “power state”=on alerts severity=critical |
| Entity type + filters + events | vm “power state”=on events |
| Entity type + filters + events + event filters | vm “power state”=on events classification=anomaly |
| Entity instance (name, ip address, disk serial etc) | vm1, 10.1.3.4, BHTXSPWRM |
| Entity instance + Metric perspective (io, cpu, memory) | vm1 io |
| Entity instance + alerts | vm1 alerts |
| Entity instance + alerts + alert filters | vm1 alerts severity=critical |
| Entity instance + events | vm1 events |
| Entity instance + events + event filters | vm1 events classification=anomaly |
| Entity instance + pages | vm1 nics, c1 capacity |
| Parent instance + entity type | c1 vms |
| Alert title search | Disk bad alerts |
| Page name search | Analysis, tasks |
The prior is just a small subset of the semantics, the best way to get familiar with them is to give it a shot!
Prism Element
Prism Element contains the following main pages:
- Home Page
- Local cluster monitoring dashboard including detailed information on alerts, capacity, performance, health, tasks, etc. To get further information on any of them you can click on the item of interest.
- Health Page
- Environment, hardware and managed object health and state information. Includes NCC health check status as well.
- VM Page
- Full VM management, monitoring and CRUD (AOS)
- Storage Page
- Container management, monitoring and CRUD
- Hardware
- Server, disk and network management, monitoring and health. Includes cluster expansion as well as node and disk removal.
- Data Protection
- DR, Cloud Connect and Metro Availability configuration. Management of PD objects, snapshots, replication and restore.
- Analysis
- Detailed performance analysis for cluster and managed objects with event correlation
- Alerts
- Local cluster and environment alerts
The home page will provide detailed information on alerts, service status, capacity, performance, tasks, and much more. To get further information on any of them you can click on the item of interest.
The figure shows a sample Prism Element dashboard where local cluster details are displayed:
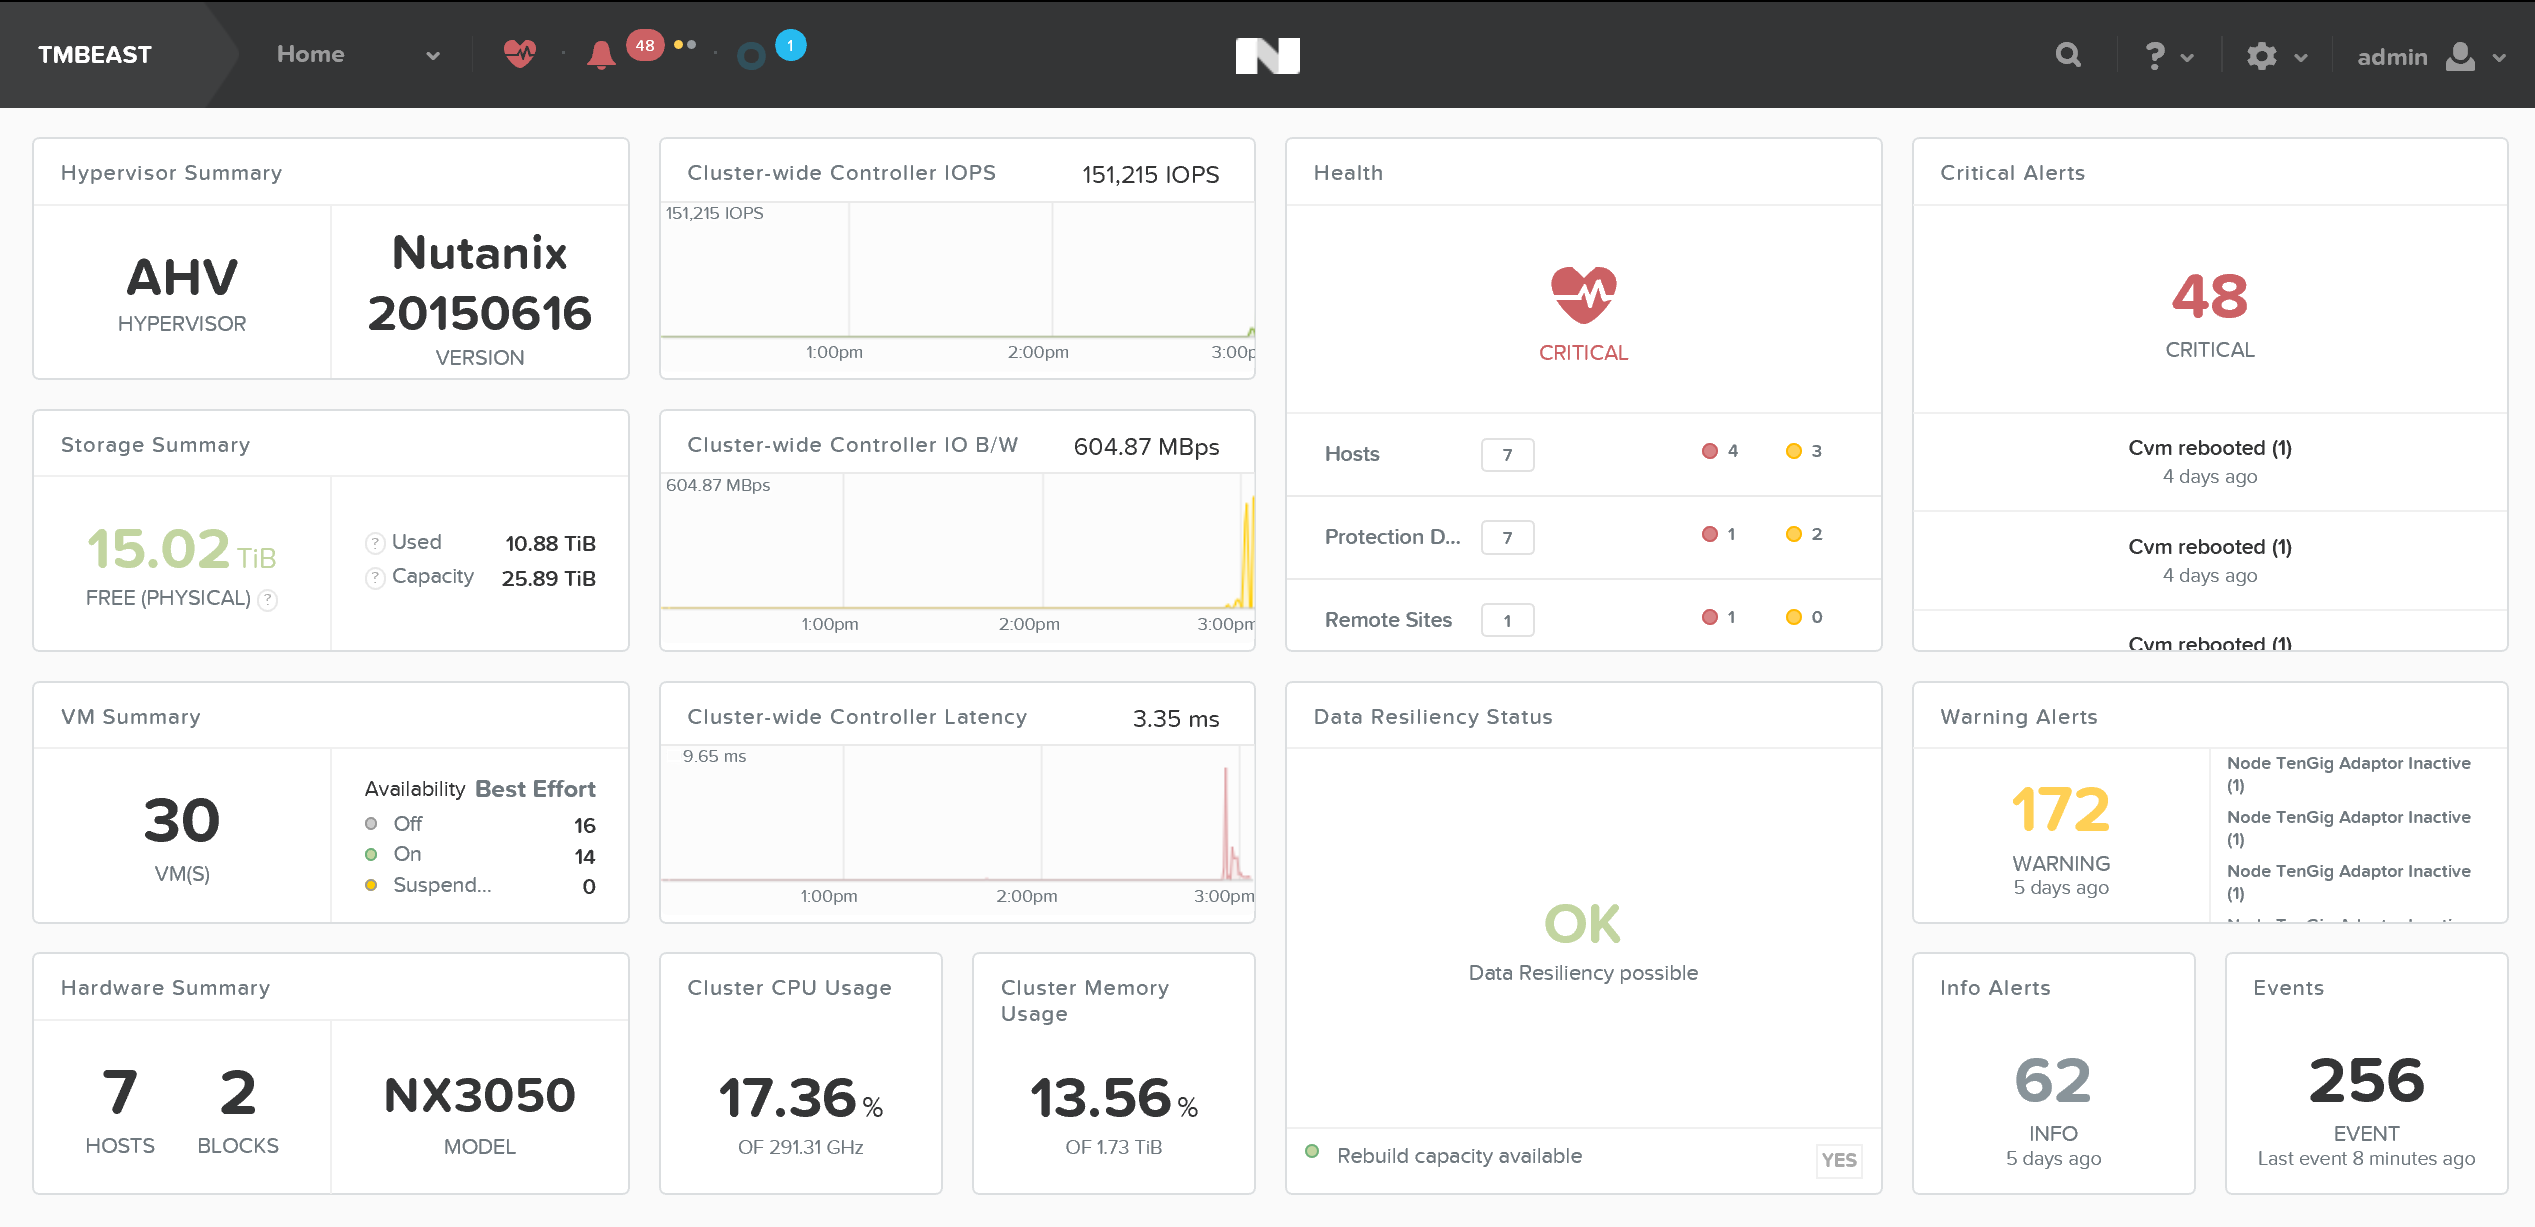 Prism Element - Dashboard
Note
Keyboard Shortcuts
Accessibility and ease of use is a critical construct in Prism. To simplify things for the end-user a set of shortcuts have been added to allow users to do everything from their keyboard.
The following characterizes some of the key shortcuts:
Change view (page context aware):
- O - Overview View
- D - Diagram View
- T - Table View
Activities and Events:
- A - Alerts
- P - Tasks
Drop down and Menus (Navigate selection using arrow keys):
- M - Menu drop-down
- S - Settings (gear icon)
- F - Search bar
- U - User drop down
- H - Help
» Download this section as PDF (opens in a new tab/window)
In the following sections we’ll cover some of the typical Prism uses as well as some common troubleshooting scenarios.
Nutanix Software Upgrade
Performing a Nutanix software upgrade is a very simple and non-disruptive process.
To begin, start by logging into Prism and clicking on the gear icon on the top right (settings) or by pressing ‘S’ and selecting ‘Upgrade Software’:
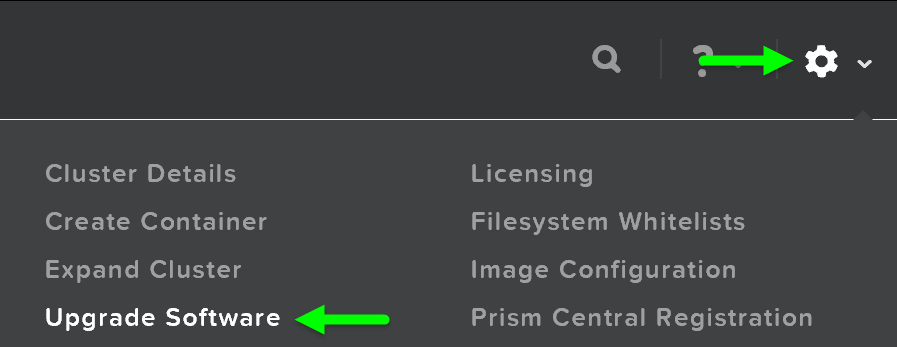 Prism - Settings - Upgrade Software
This will launch the ‘Upgrade Software’ dialog box and will show your current software version and if there are any upgrade versions available. It is also possible to manually upload a NOS binary file.
You can then download the upgrade version from the cloud or upload the version manually:
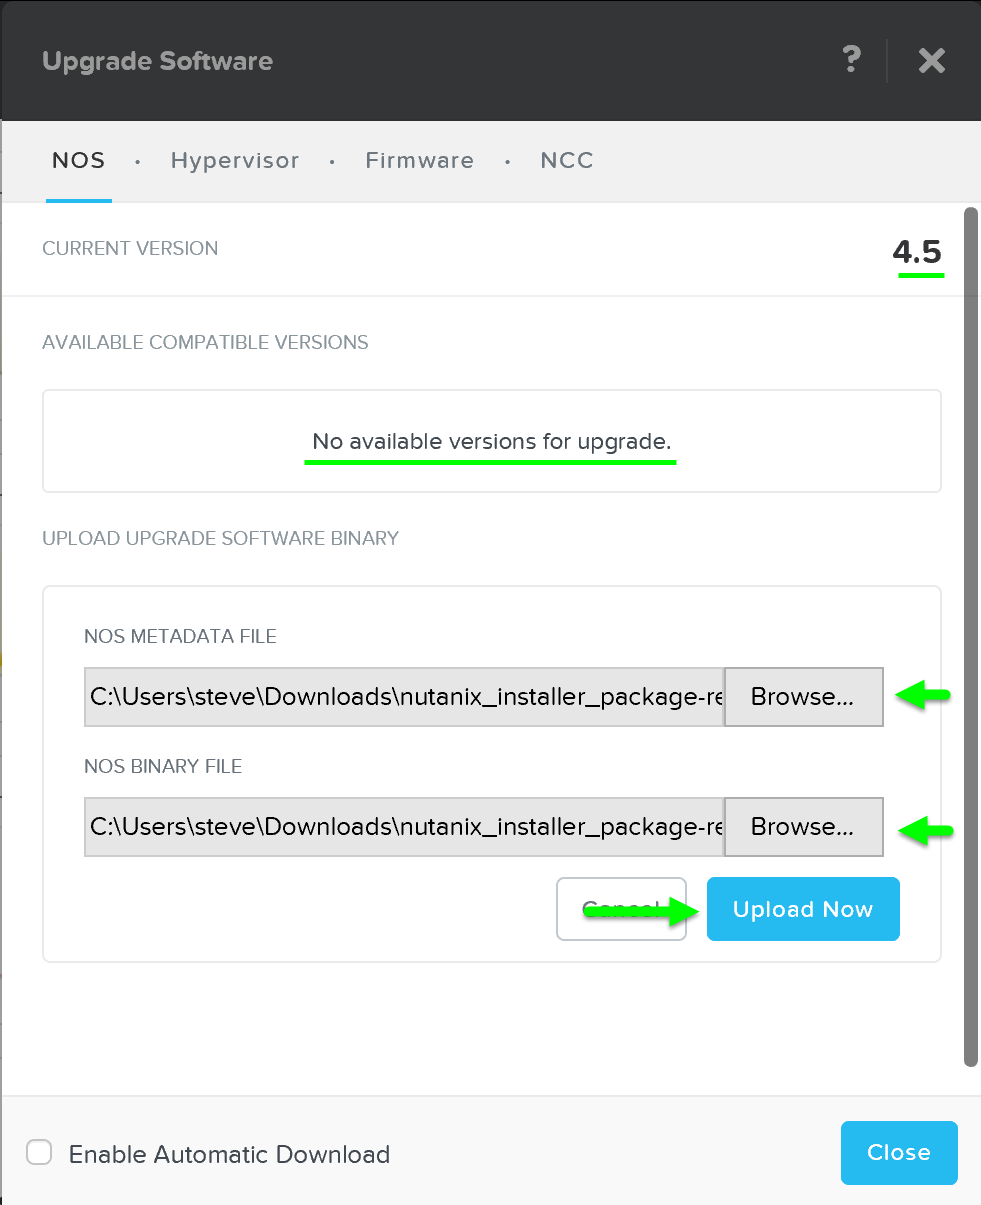 Upgrade Software - Main
Note
Upload software from the CVM
In certain cases you may want to download the software and upload from the CVM itself. For example, this can be used to download builds locally to the CVM.
First SSH into a CVM and find the Prism leader:
curl localhost:2019/prism/leader
SSH to the Prism leader and download the software bundle and metadata JSON
Run the following command to "upload" the software to Prism:
ncli software upload file-path=PATH_TO_SOFTWARE meta-file-path=PATH_TO_METADATA_JSON software-type=SOFTWARE_TYPE
The following shows an example for Prism Central:
ncli software upload file-path=/home/nutanix/tmp/leader-prism_central.tar meta-file-path=/home/nutanix/tmp/leader-prism_central-metadata.json software-type=prism_central_deploy
It will then upload the upgrade software onto the Nutanix CVMs:
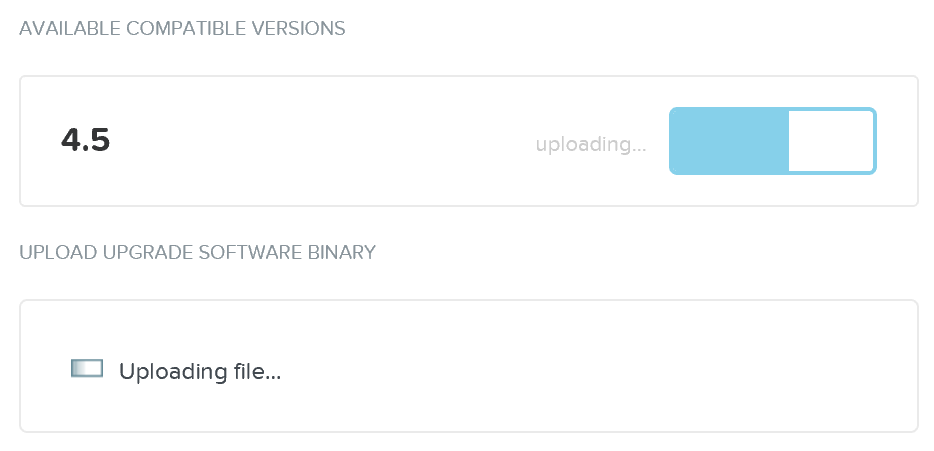 Upgrade Software - Upload
After the software is loaded click on ‘Upgrade’ to start the upgrade process:
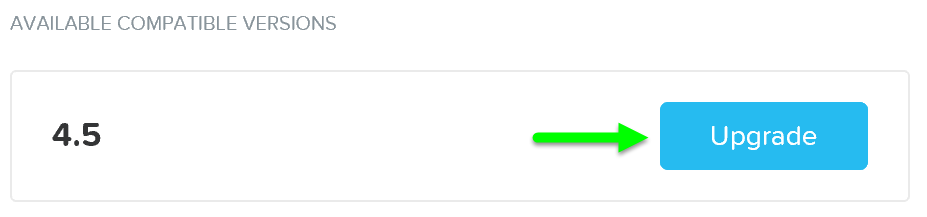 Upgrade Software - Upgrade Validation
You’ll then be prompted with a confirmation box:
 Upgrade Software - Confirm Upgrade
The upgrade will start with pre-upgrade checks then start upgrading the software in a rolling manner:
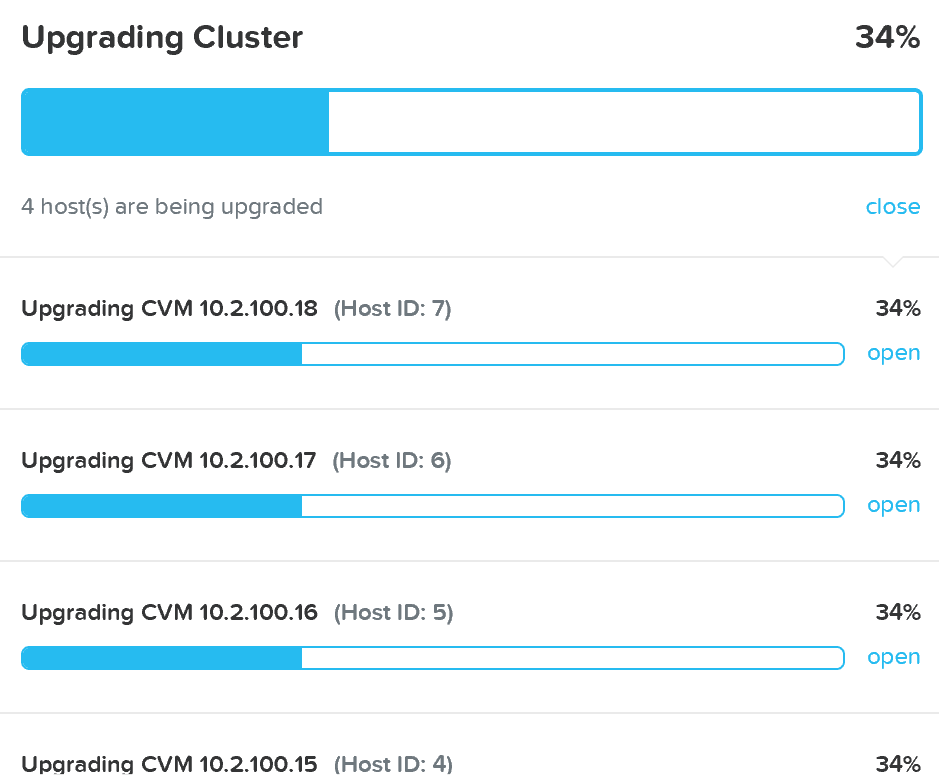 Upgrade Software - Execution
Once the upgrade is complete you’ll see an updated status and have access to all of the new features:
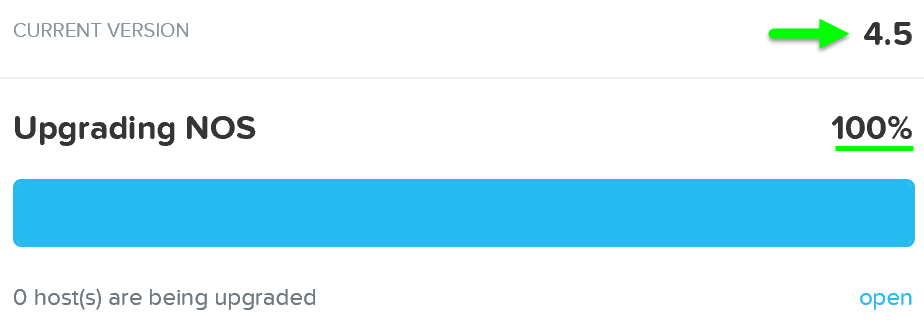 Upgrade Software - Complete
Note
Note
Your Prism session will briefly disconnect during the upgrade when the current Prism Leader is upgraded. All VMs and services running remain unaffected.
Hypervisor Upgrade
Similar to Nutanix software upgrades, hypervisor upgrades can be fully automated in a rolling manner via Prism.
To begin follow the similar steps above to launch the ‘Upgrade Software’ dialogue box and select ‘Hypervisor’.
You can then download the hypervisor upgrade version from the cloud or upload the version manually:
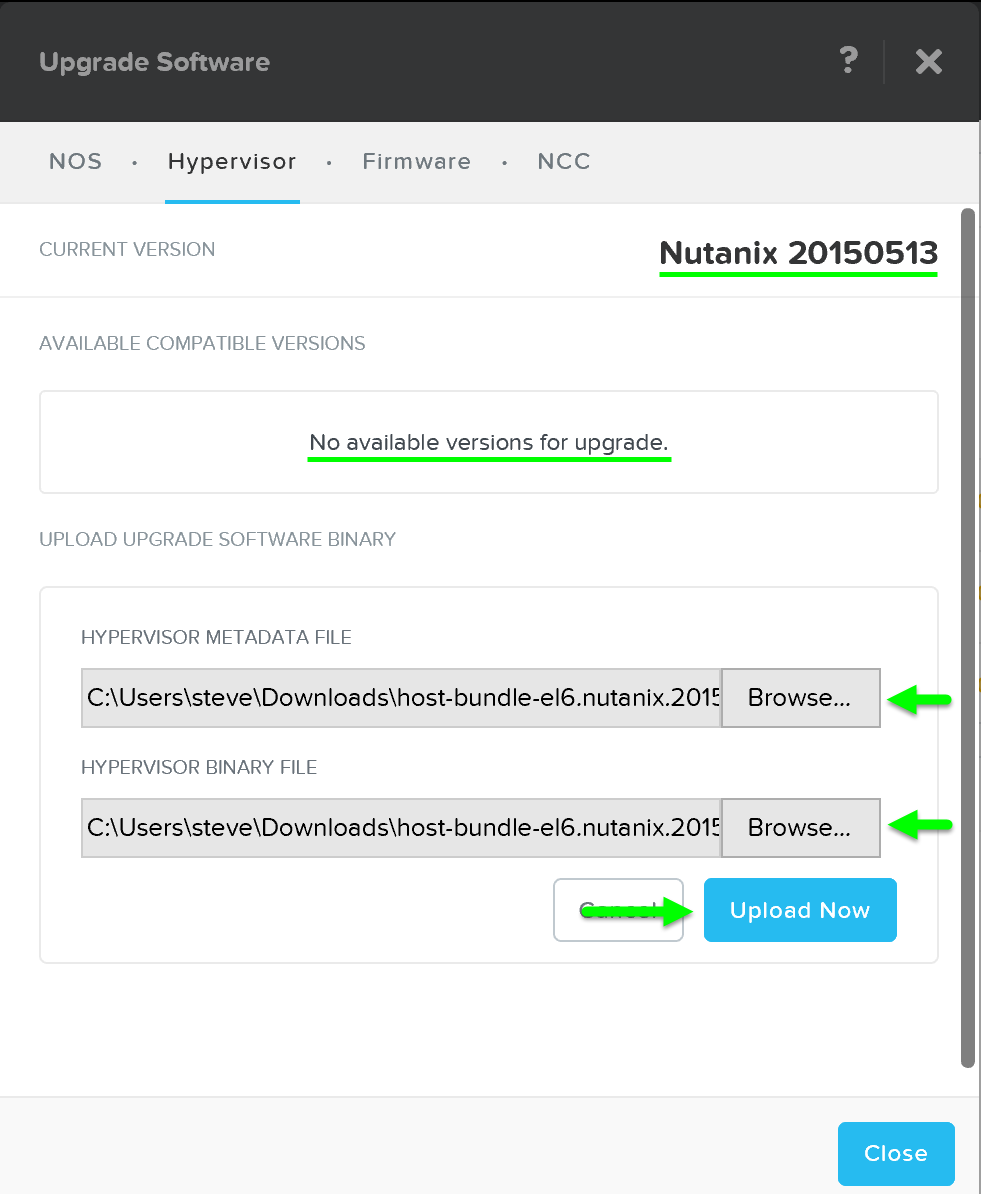 Upgrade Hypervisor - Main
It will then load the upgrade software onto the Hypervisors. After the software is loaded click on ‘Upgrade’ to start the upgrade process:
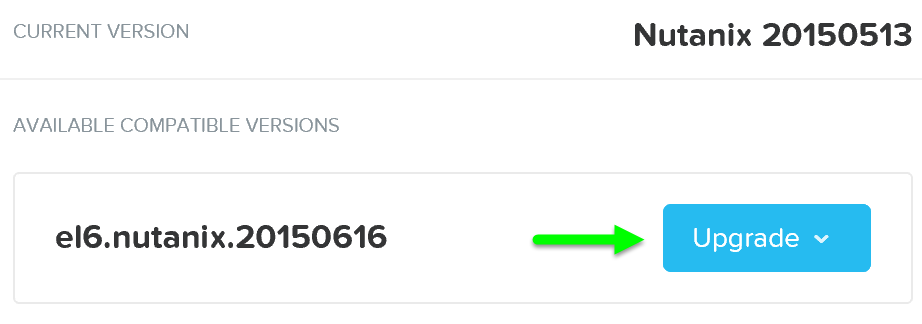 Upgrade Hypervisor - Upgrade Validation
You’ll then be prompted with a confirmation box:
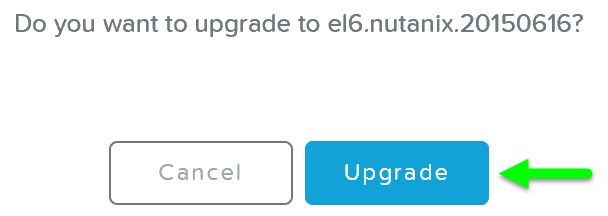 Upgrade Hypervisor - Confirm Upgrade
The system will then go through host pre-upgrade checks and upload the hypervisor upgrade to the cluster:
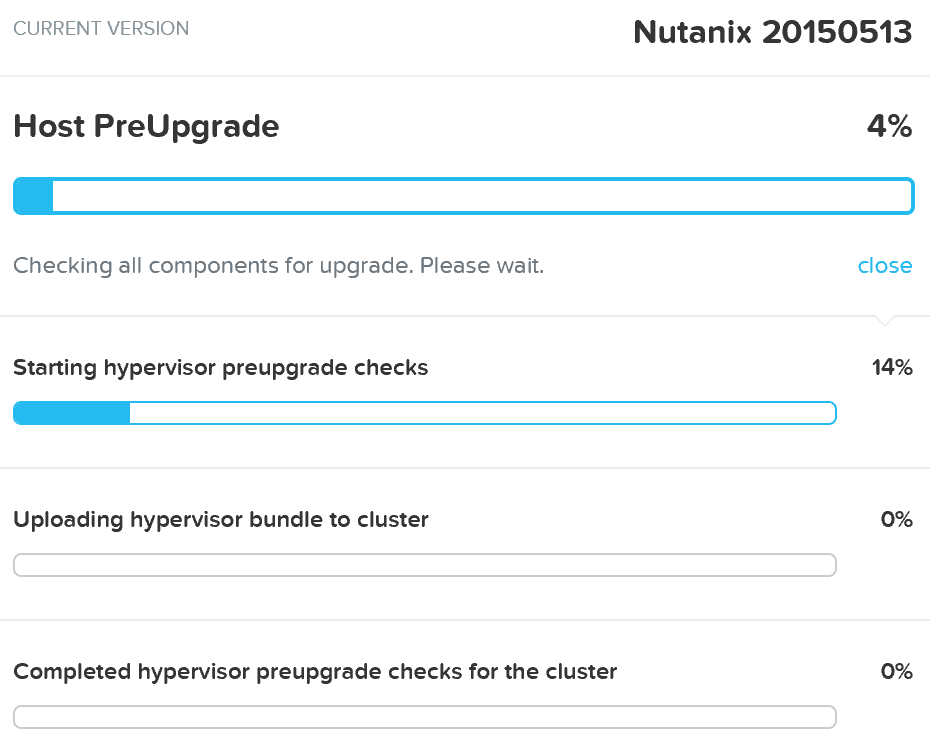 Upgrade Hypervisor - Pre-upgrade Checks
Once the pre-upgrade checks are complete the rolling hypervisor upgrade will then proceed:
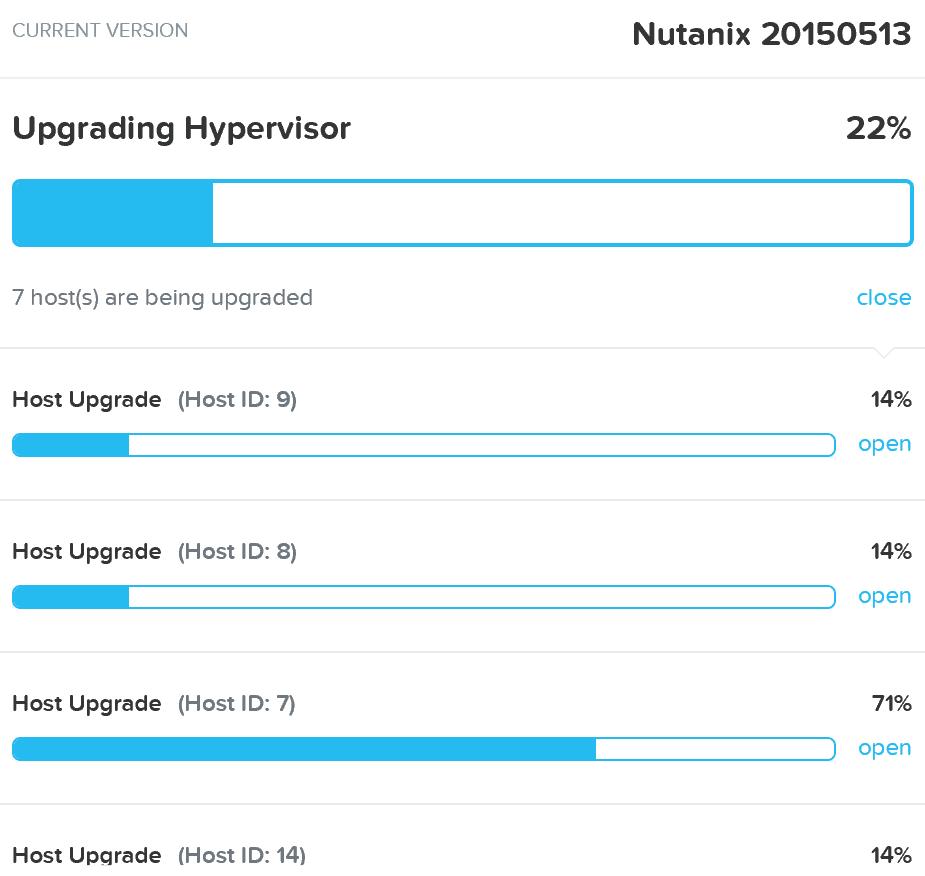 Upgrade Hypervisor - Execution
Similar to the rolling nature of the Nutanix software upgrades, each host will be upgraded in a rolling manner with zero impact to running VMs. VMs will be live-migrated off the current host, the host will be upgraded, and then rebooted. This process will iterate through each host until all hosts in the cluster are upgraded.
Note
Pro tip
You can also get cluster wide upgrade status from any Nutanix CVM by running 'host_upgrade --status'. The detailed per host status is logged to ~/data/logs/host_upgrade.out on each CVM.
Once the upgrade is complete you’ll see an updated status and have access to all of the new features:
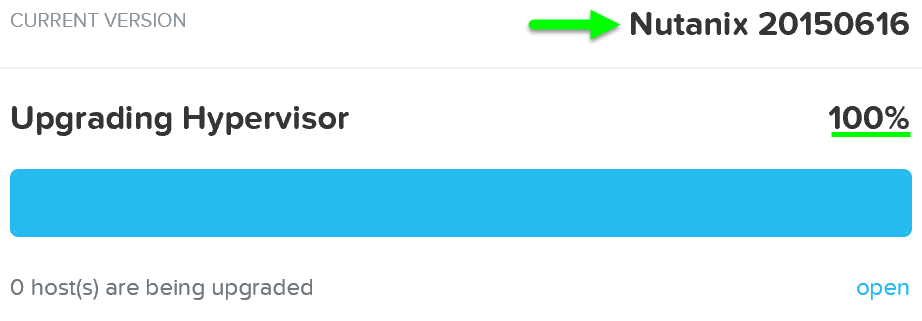 Upgrade Hypervisor - Complete
Cluster Expansion (add node)
 Cluster Expansion
The ability to dynamically scale the Nutanix cluster is core to its functionality. To scale a Nutanix cluster, rack/stack/cable the nodes and power them on. Once the nodes are powered up they will be discoverable by the current cluster using mDNS.
The figure shows an example 7 node cluster with 1 node which has been discovered:
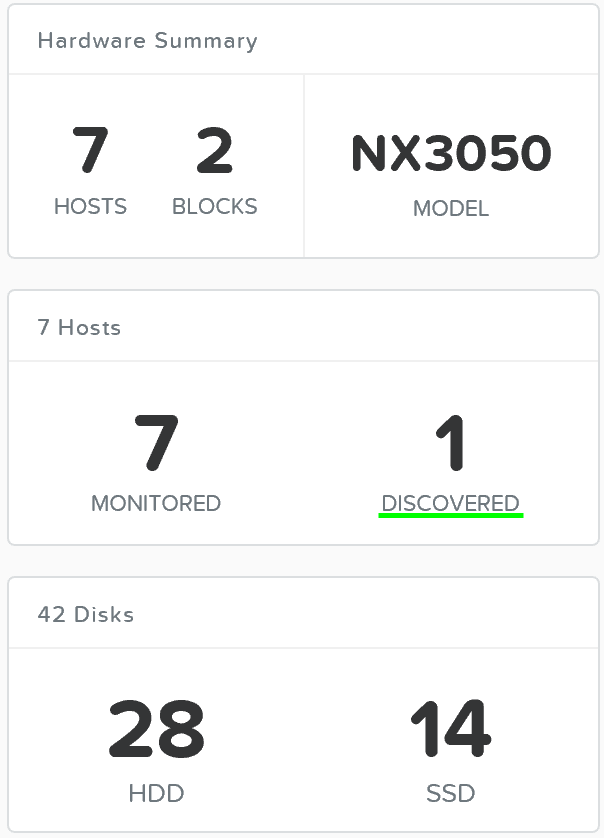 Add Node - Discovery
Multiple nodes can be discovered and added to the cluster concurrently.
Once the nodes have been discovered you can begin the expansion by clicking ‘Expand Cluster’ on the upper right hand corner of the ‘Hardware’ page:
 Hardware Page - Expand Cluster
You can also begin the cluster expansion process from any page by clicking on the gear icon:
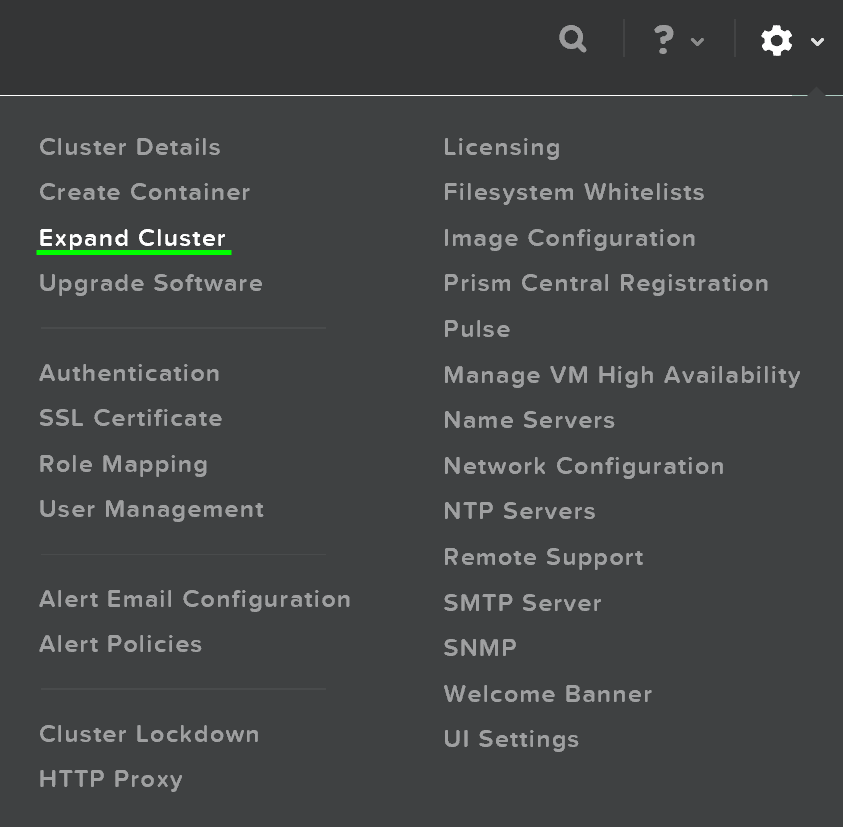 Gear Menu - Expand Cluster
This launches the expand cluster menu where you can select the node(s) to add and specify IP addresses for the components:
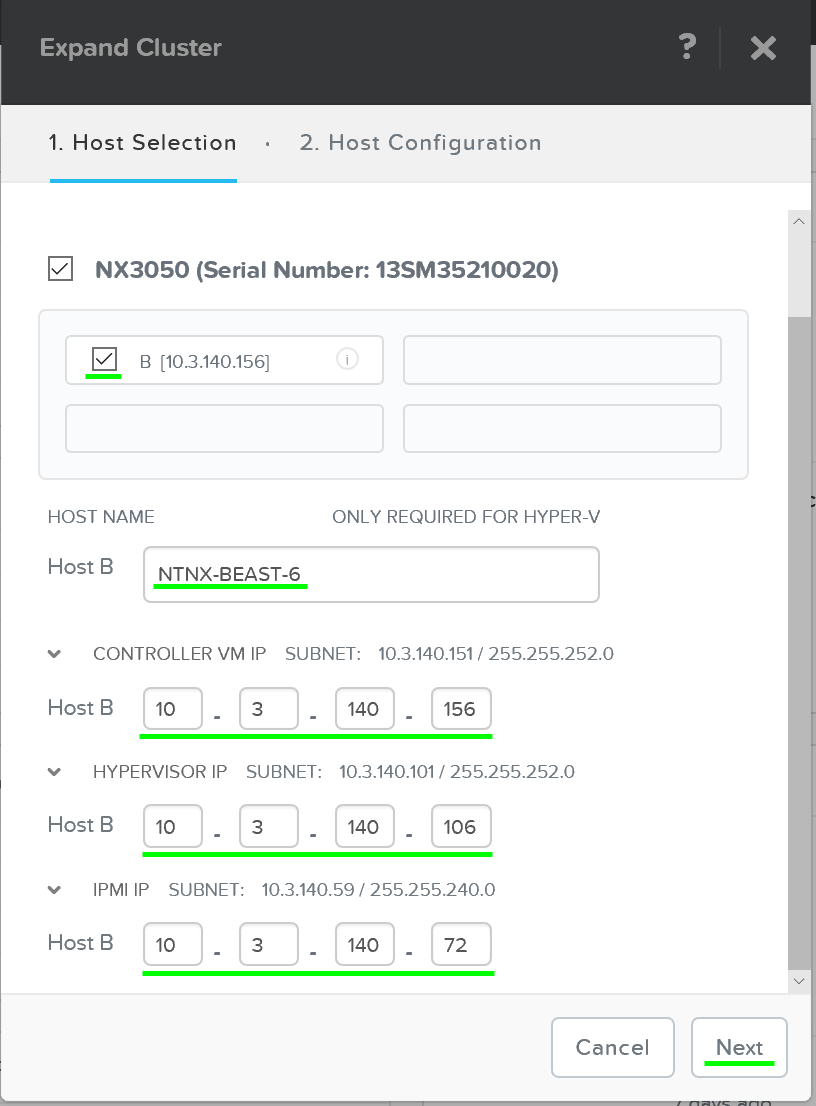 Expand Cluster - Host Selection
After the hosts have been selected you’ll be prompted to upload a hypervisor image which will be used to image the nodes being added. For AHV or cases where the image already exists in the Foundation installer store, no upload is necessary.
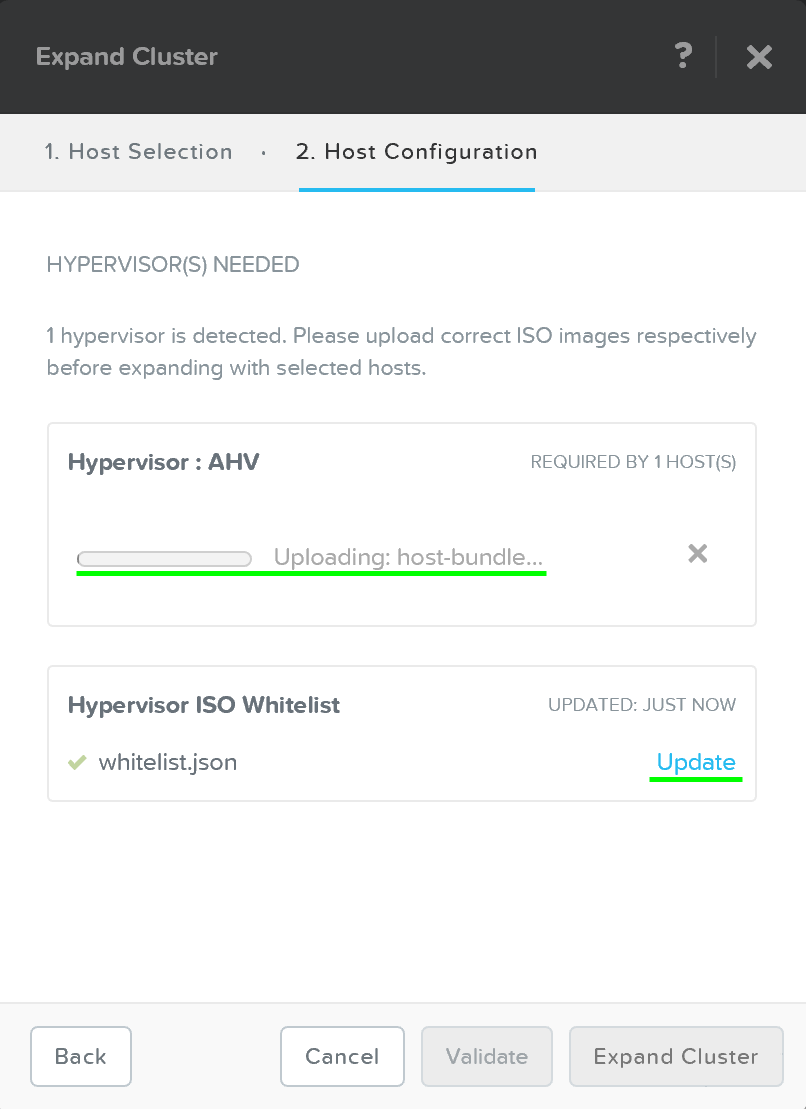 Expand Cluster - Host Configuration
After the upload is completed you can click on ‘Expand Cluster’ to begin the imaging and expansion process:
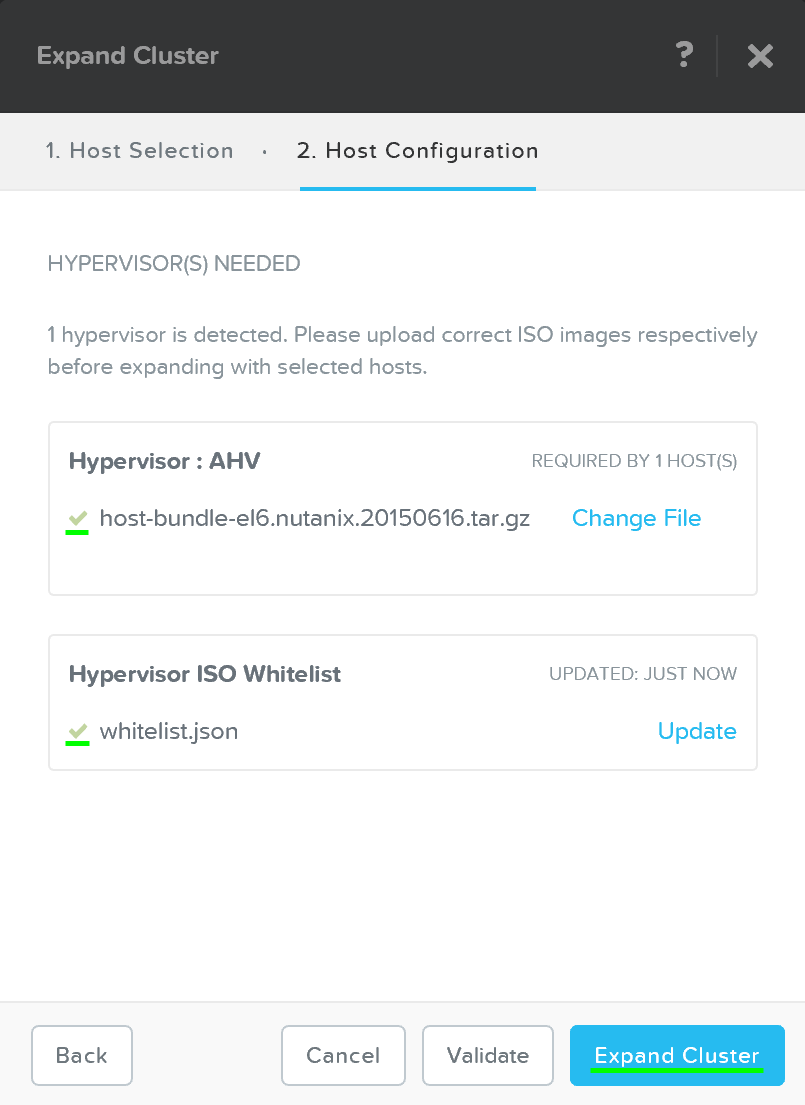 Expand Cluster - Execution
The job will then be submitted and the corresponding task item will appear:
 Expand Cluster - Execution
Detailed tasks status can be viewed by expanding the task(s):
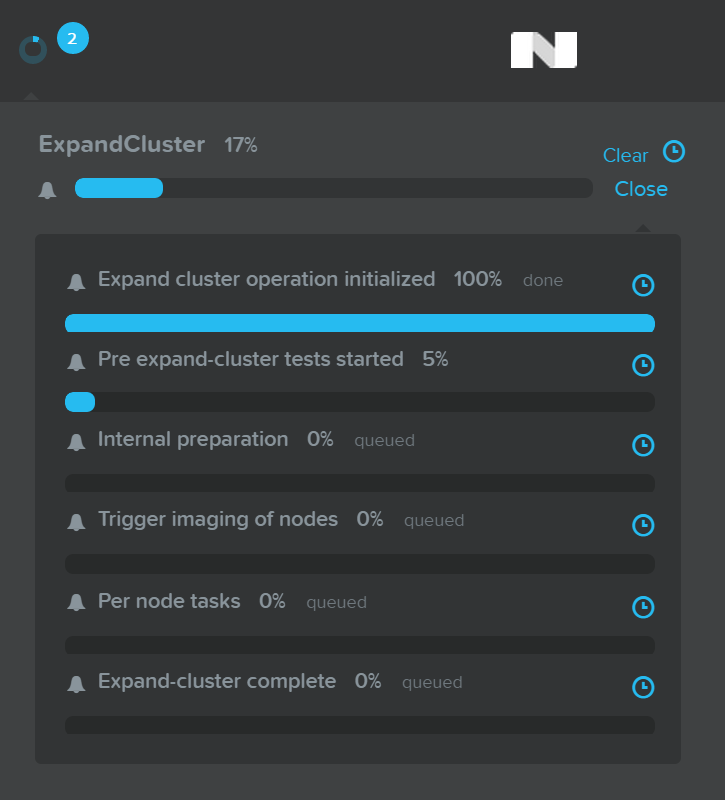 Expand Cluster - Execution
After the imaging and add node process has been completed you’ll see the updated cluster size and resources:
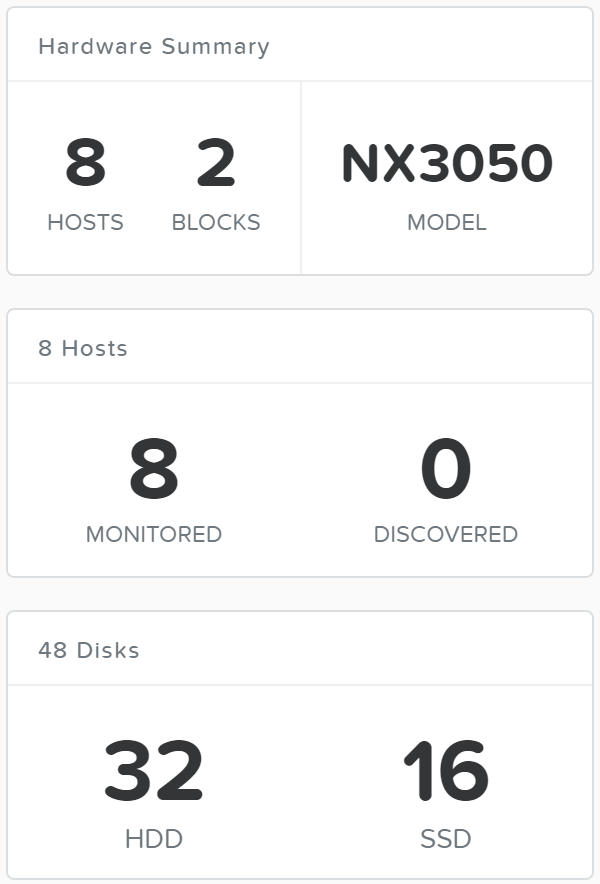 Expand Cluster - Execution
I/O Metrics
Identification of bottlenecks is a critical piece of the performance troubleshooting process. In order to aid in this process, Nutanix has introduced a new ‘I/O Metrics’ section to the VM page.
Latency is dependent on multitude of variables (queue depth, I/O size, system conditions, network speed, etc.). This page aims to offer insight on the I/O size, latency, source, and patterns.
To use the new section, go to the ‘VM’ page and select a desired VM from the table. Here we can see high level usage metrics:
 VM Page - Details
The ‘I/O Metrics’ tab can be found in the section below the table:
 VM Page - I/O Metrics Tab
Upon selecting the ‘I/O Metrics’ tab a detailed view will be shown. We will break this page down and how to use it in this section.
The first view is the ‘Avg I/O Latency’ section that shows average R/W latency for the past three hours. By default the latest reported values are shown with the corresponding detailed metrics below for that point in time.
You can also mouse over the plot to see the historical latency values and click on a time of the plot to view the detailed metrics below.
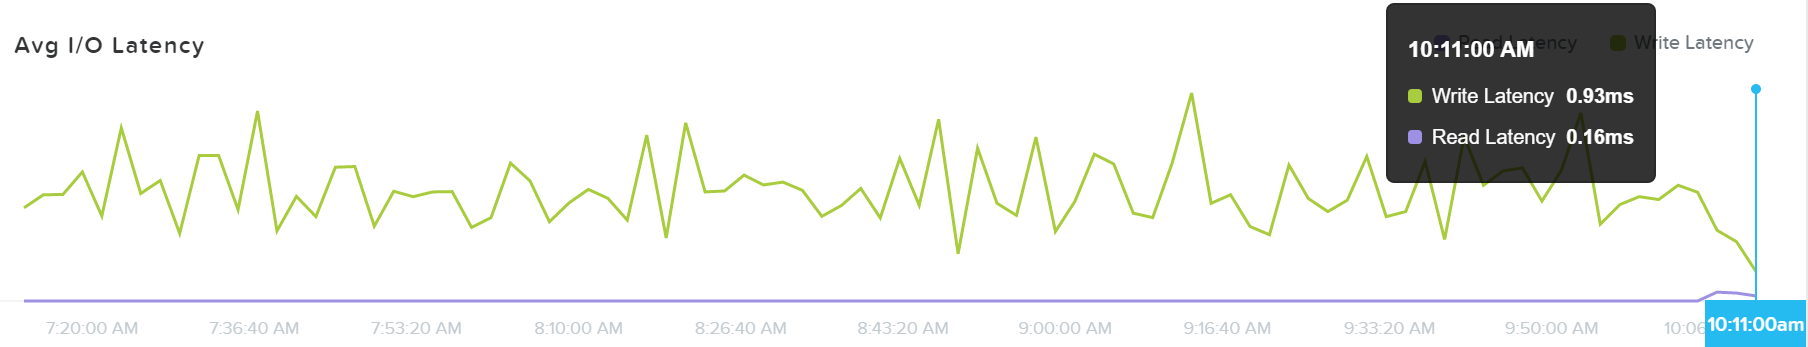 I/O Metrics - Latency Plot
This can be useful when a sudden spike is seen. If you see a spike and want to investigate further, click on the spike and evaluate the details below.
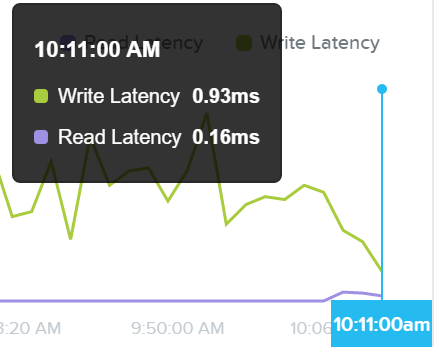 I/O Metrics - Latency Plot
If latency is all good, no need to dig any further.
The next section shows a histogram of I/O sizes for read and write I/Os:
 I/O Metrics - I/O Size histogram
Here we can see our read I/Os range from 4K to 32K in size:
 I/O Metrics - Read I/O Size histogram
Here we can see our write I/Os range from 16K to 64K with some up to 512K in size:
 I/O Metrics - Write I/O Size histogram
Note
Pro tip
If you see a spike in latency the first thing to check is the I/O size. Larger I/Os (64K up to 1MB) will typically see higher latencies than smaller I/Os (4K to 32K).
The next section shows a histogram of I/O latencies for read and write I/Os:
 I/O Metrics - Latency histogram
Looking at the read latency histogram we can see the majority of read I/Os are sub-ms (<1ms) with some up to 2-5ms.
 I/O Metrics - Read Latency histogram
Taking a look below at the ‘Read Source’ we can see most I/Os are being served from the SSD tier:
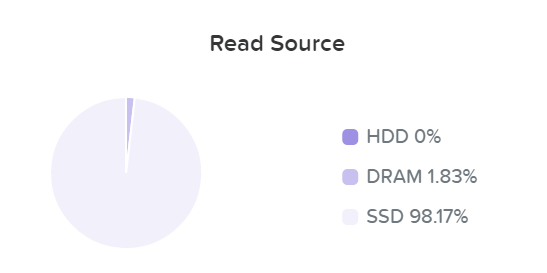 I/O Metrics - Read Source SSD
As data is read it will be pulled in to the Unified Cache realtime (Check the ‘I/O Path and Cache’ section to learn more). Here we can see the data has been pulled into the cache and is now being served from DRAM:
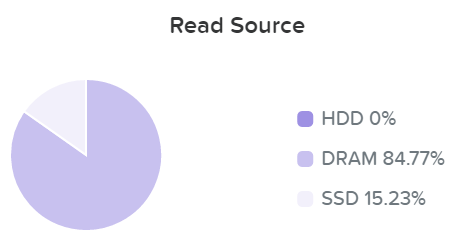 I/O Metrics - Read Source DRAM
We can now see basically all of our read I/Os are seeing sub-ms (<1ms) latency:
 I/O Metrics - Read Latency histogram
Here we can see the majority of our write I/O are seeing <1-2ms latency:
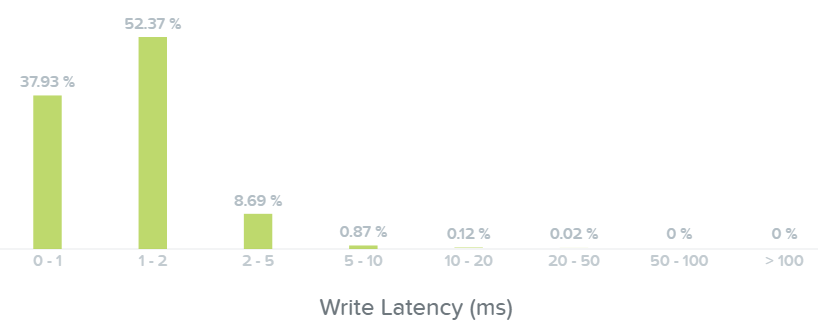 I/O Metrics - Write Latency histogram
Note
Pro tip
If you see a spike in read latency and the I/O sizes aren't large, check where the read I/Os are being served from. Any initial read from HDD will see higher latency than the DRAM cache; however, once it is in the cache all subsequent reads will hit DRAM and see an improvement in latency.
The last section shows the I/O patterns and how much is random vs. sequential:
 I/O Metrics - RW Random vs. Sequential
Typically I/O patterns will vary by application or workload (e.g. VDI is mainly random, whereas Hadoop would primarily be sequential). Other workloads will be a mix of both. For example, a database might be random on inserts or some queries, however sequential during ETL.
» Download this section as PDF (opens in a new tab/window)
Microservices Infrastructure (MSP) provides a common framework for delivering microservices associated with Prism Central-based components such as Flow Virtual Networking, Objects, and the Security Dashboard. MSP also provides services such as Identity and Access Management and internal service load balancing.
Before MSP, Prism Central was a monolithic application. With MSP enabled, certain services are migrated and spun up in a Kubernetes (K8s) cluster as pods. Over time, most of the Prism Central services will be migrated and converted to microservices leveraging the common platform. This will enable services to be upgraded independently through LCM, so particular services can be upgraded without having to upgrade the entire PC instance, resulting in faster upgrades and quick patch updates.
As of PC.2022.9, the Microservices Infrastructure is enabled by default. When you upgrade to the latest version of Prism Central, MSP will be automatically enabled. Refer to the Prism Central MSP documentation for the full list of prerequisites and considerations.
Network Configuration
When MSP is enabled, a Kubernetes cluster is created on Prism Central. This Kubernetes cluster is one node with a standalone Prism Central and three nodes with a scale-out Prism Central.
MSP uses the following subnets.
| Subnet | Purpose |
| 10.100.0.0/16 | Reserved for K8s pod network |
| 10.200.32.0/24 | K8s Services (Flow Virtual Networking, IAM, etc) |
| 10.200.0.0/16 | Reserved for K8s Services network |
| 10.100.0.0/24 | K8s pod - PC1 |
| 10.100.1.0/24 | K8s pod - PC2 |
| 10.100.2.0/24 | K8s pod - PC3 |
If you already use these subnets for DNS or Active Directory and require different IP ranges, contact Nutanix Support.
On the firewall, bidirectional traffic should be allowed between Prism Central and:
- All of the Prism Element CVM IPs
- Prism Element Virtual IPs
- Prism Element Data Services IPs
On TCP ports:
- 3205 - iSCSI data plane connection
- 3260 - iSCSI control plane connection
- 9440 - Prism UI/API
Additionally, Prism Central should be able to ping all the Prism Element CVM IPs and Prism Element Virtual IPs.
During deployment, Prism Central must access several cloud services over port 443. For the most up-to-date list and diagrams, refer to the Ports & Protocols page on the Support Portal. There is also a dark site method of deployment for networks without Internet access, which is covered in the Prism Central MSP documentation.
When deploying Prism Central or enabling MSP, there are two options for the internal network configuration.
- Private Network (default): an internal private network is deployed using VXLAN for Kubernetes node communication. The default settings use 192.168.5.0/24. This requires no additional IPs from the physical network.
- VLAN Network: a managed or unmanaged VLAN network that has been configured on the Nutanix cluster. Five IPs are needed from the physical network for a single-node PC setup and 10 IPs are needed for a three-node scale-out PC setup. This option will add a second NIC to every PC VM for Kubernetes node communication.
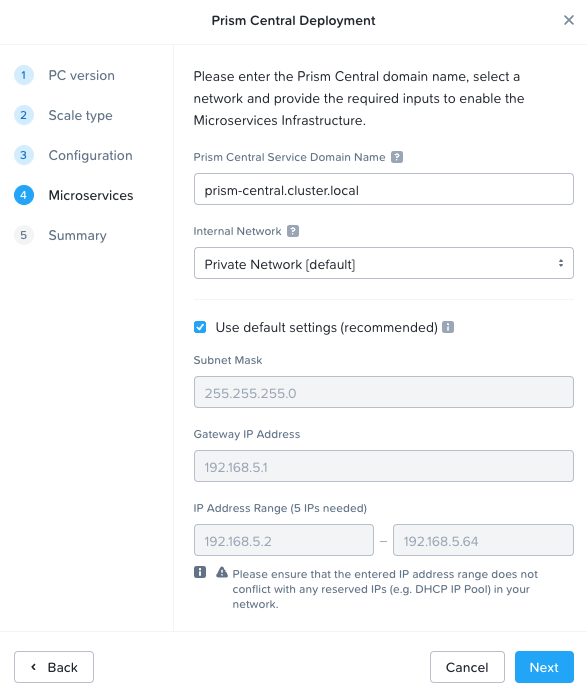 Microservices Setup During Prism Central Deployment
Architecture
The diagrams below assume the default private VXLAN network.
An example architecture diagram for the Kubernetes node on a single-PC deployment looks like the following. Note that the example does not show every service running in the Kubernetes cluster.
In this example, 10.10.250.50 is the IP address assigned to the PC VM and 10.100.0.0/24 is used as the network for the Kubernetes pod.
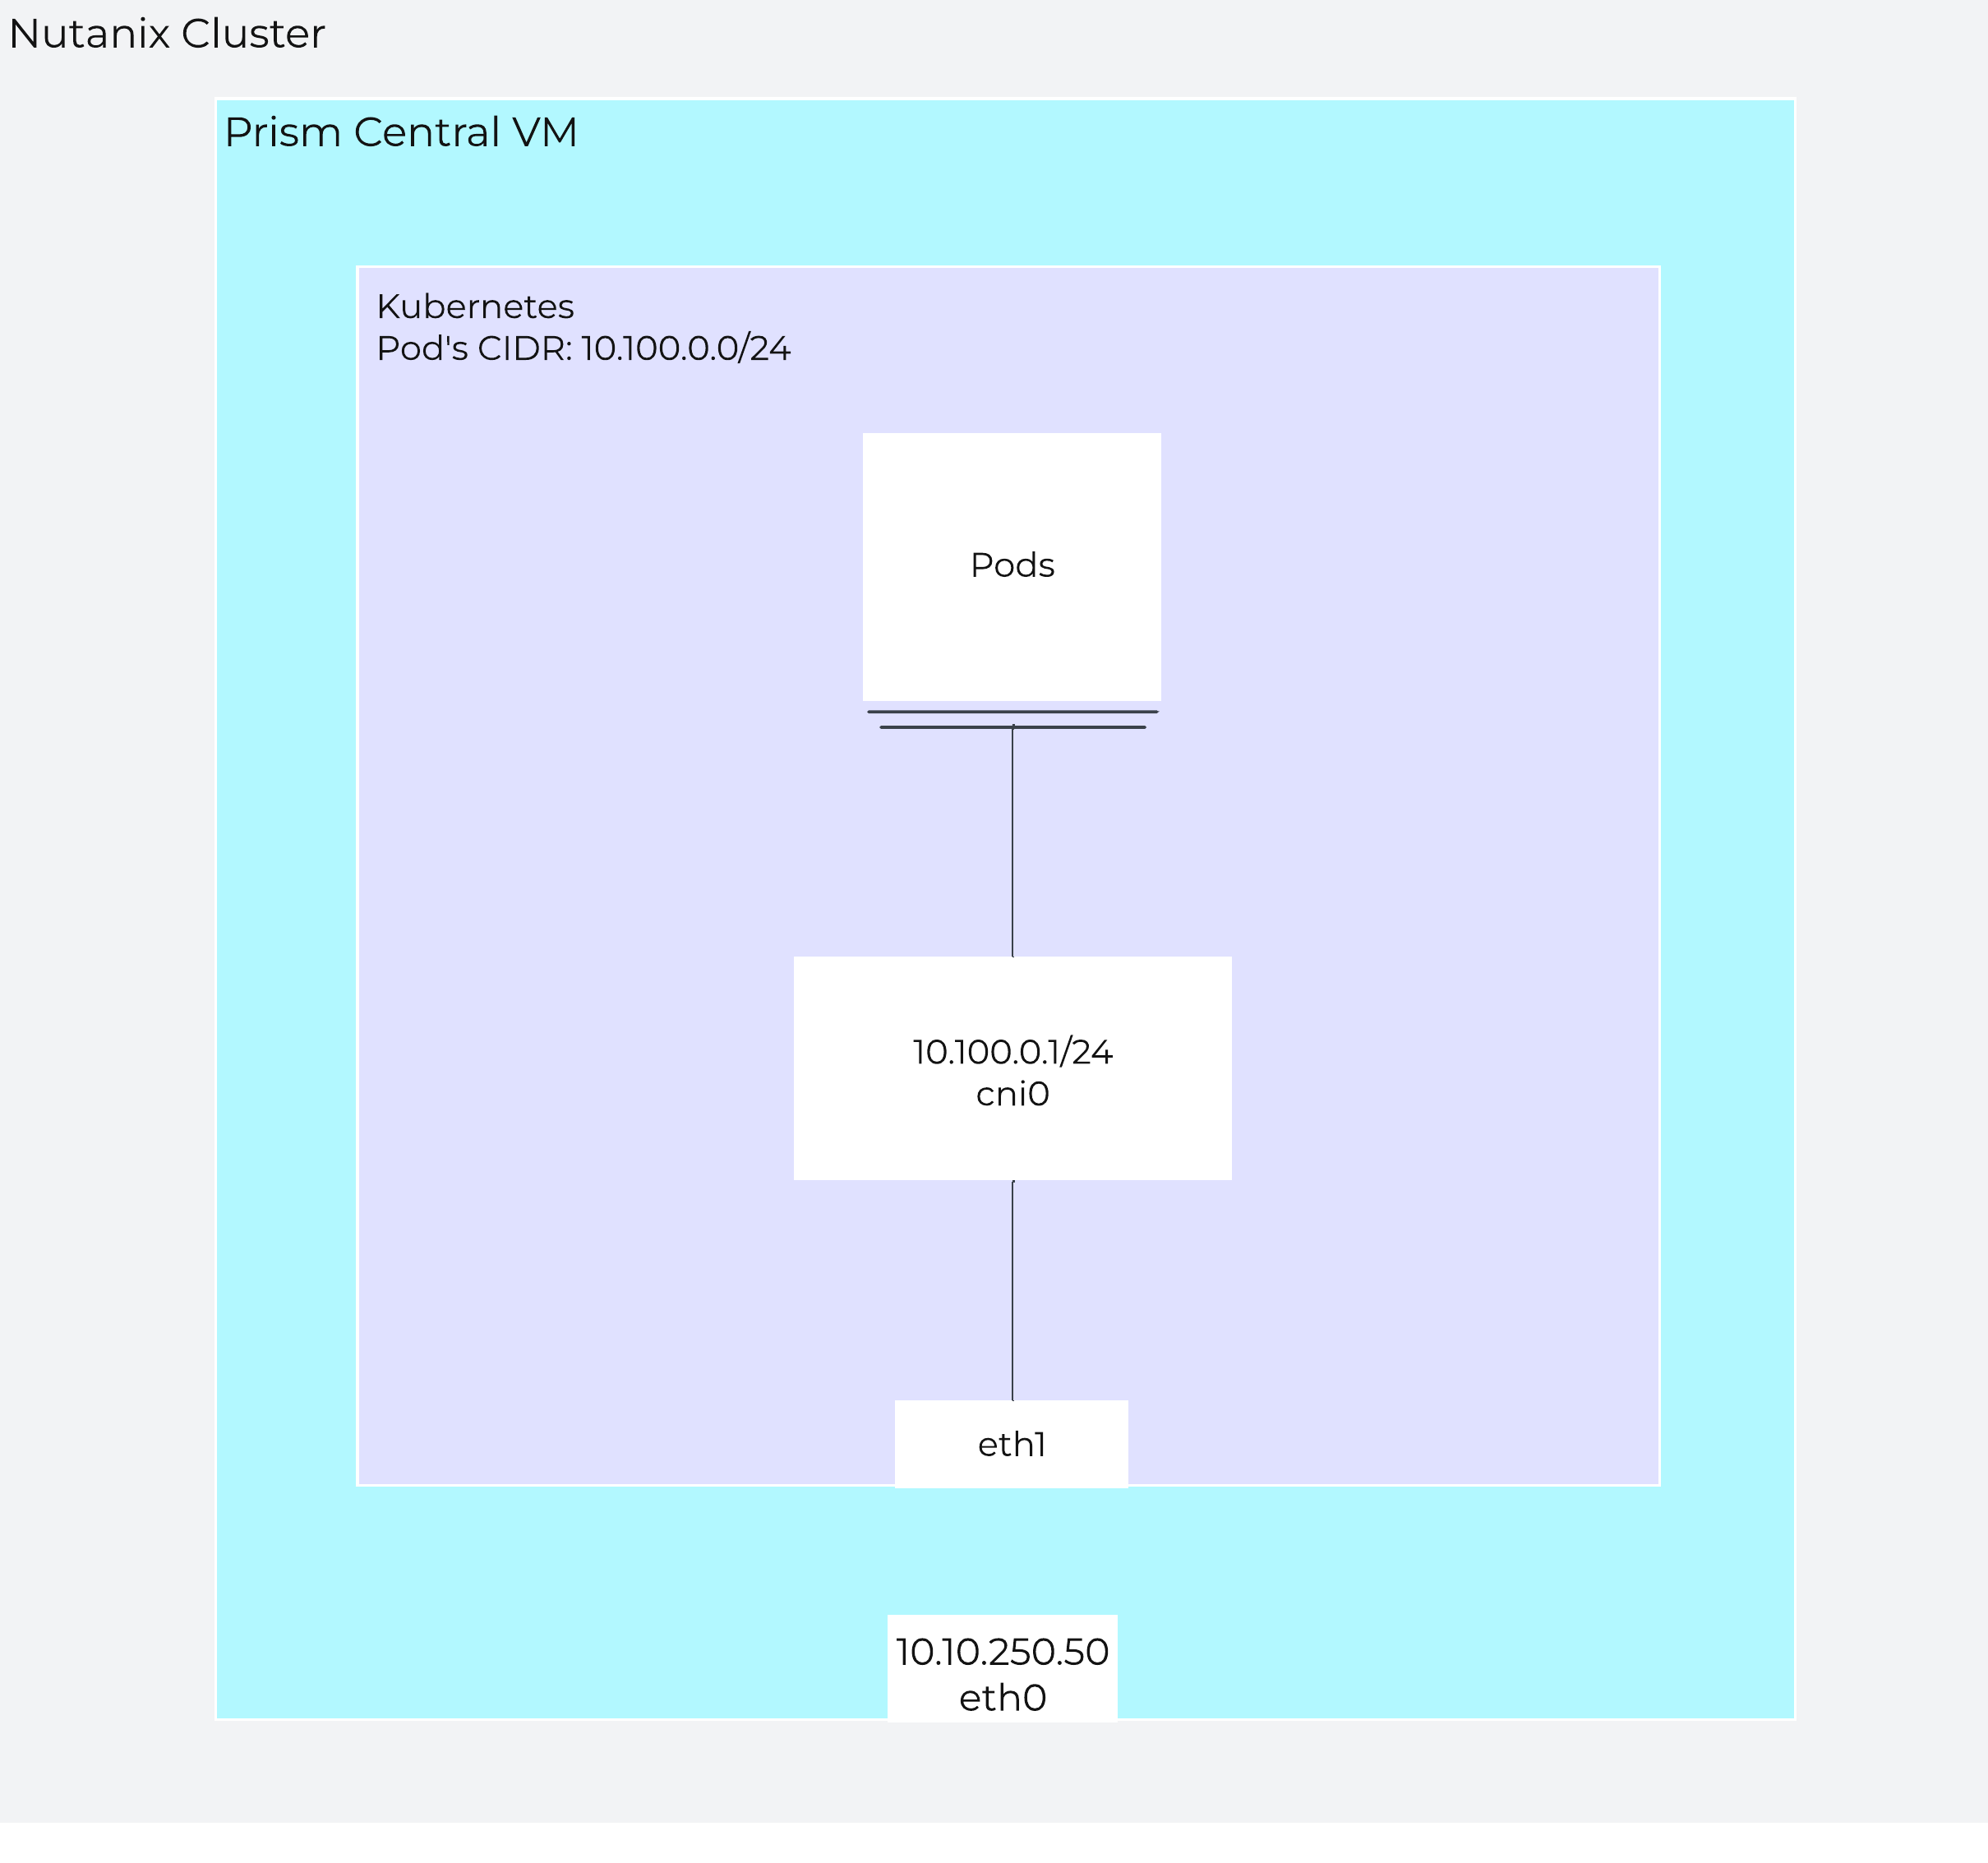 Single Node PC
For scale-out PC, two additional Kubernetes nodes are provisioned and they use the 10.100.1.0/24 and 10.100.2.0/24 networks for their pods, respectively.
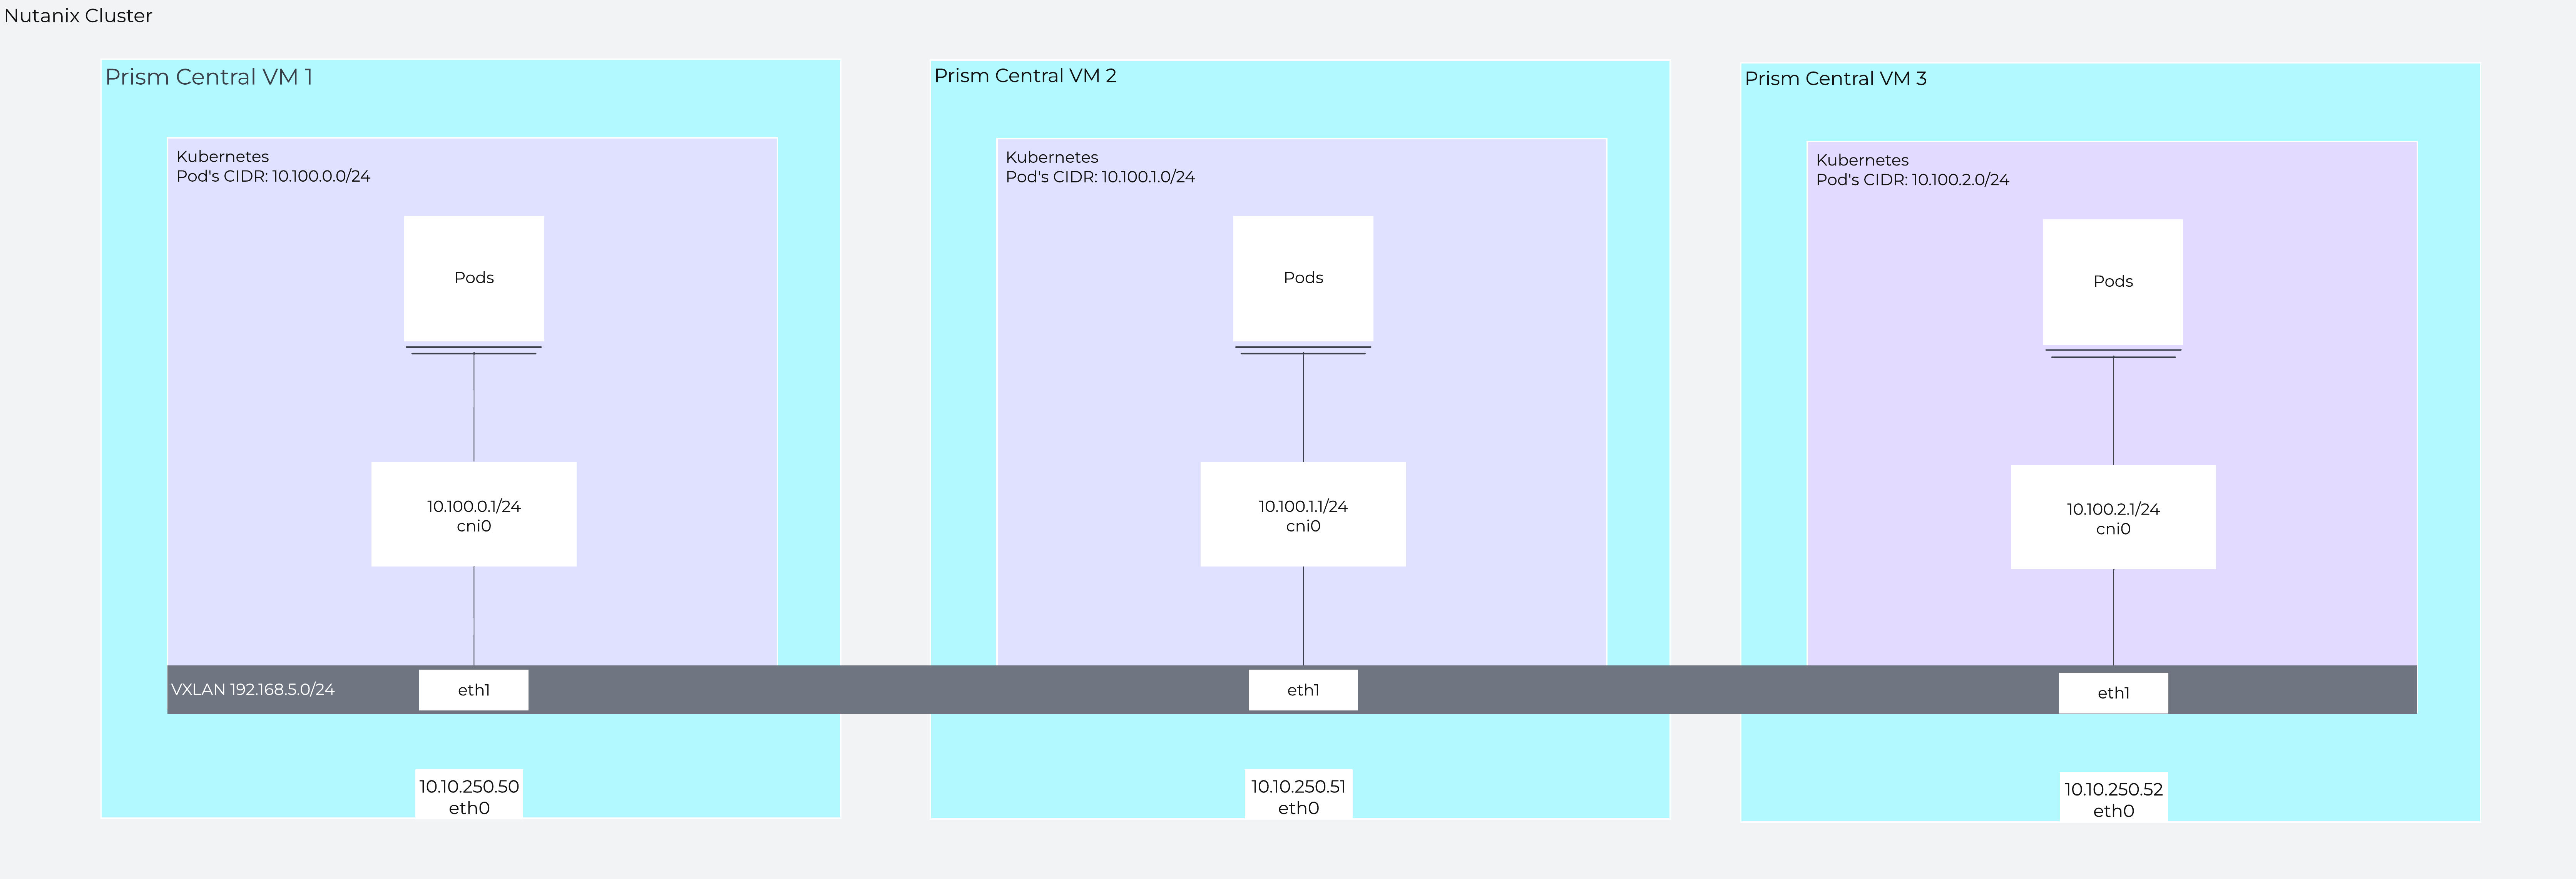 Scale-out PC
In a scale-out PC setup with VXLAN, pod-to-pod traffic across nodes uses direct routing and is encapsulated using the Prism Central VM IP.
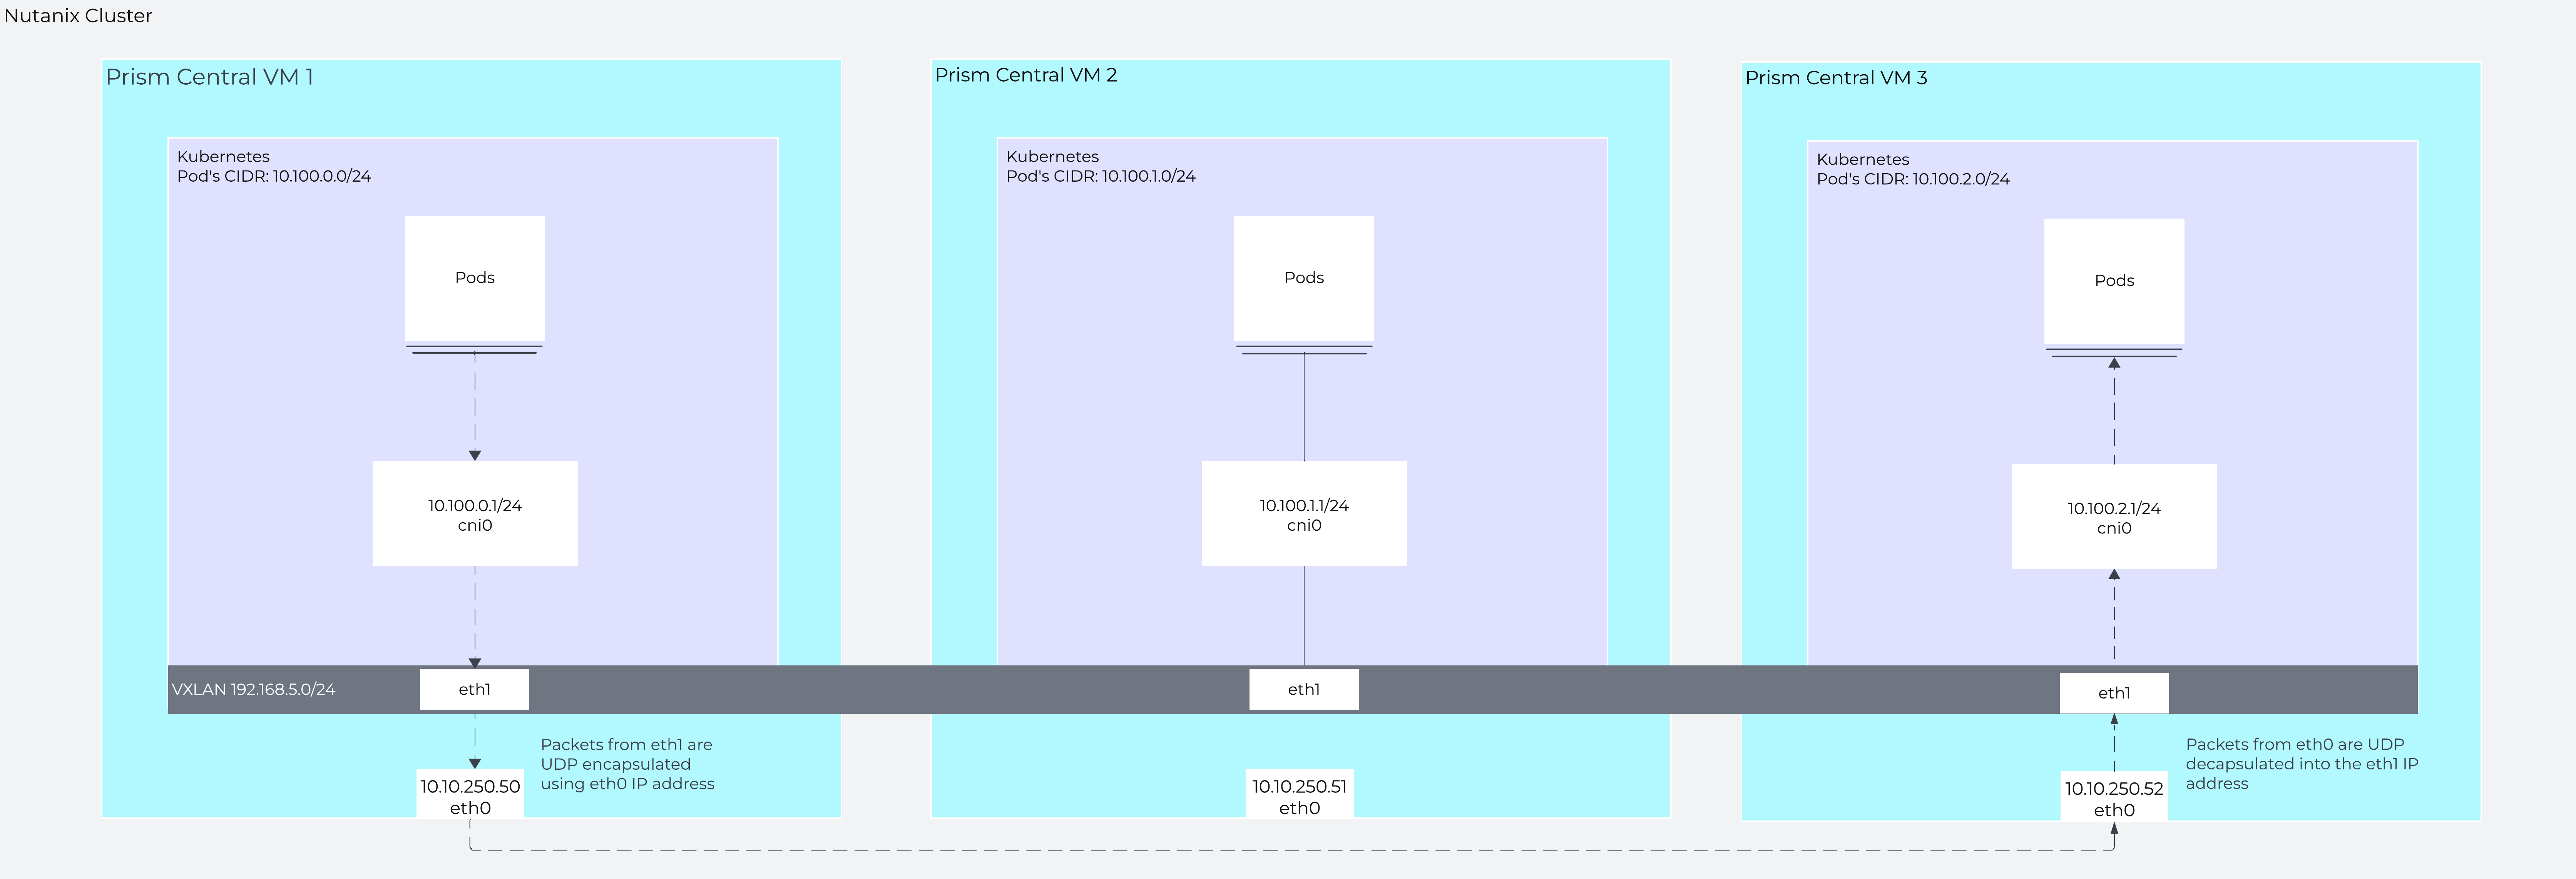 Traffic from a pod on PC VM 1 to a pod on PC VM 3
» Download this section as PDF (opens in a new tab/window)
Prism Central Backup and Restore enables the continuous backup of your Prism Central deployment and various service configurations and policies to Prism Element clusters managed by that same Prism Central. If the cluster hosting your Prism Central instance experiences a disaster, you can recover your PC deployment on another cluster.
Architecture
On Prism Element and Prism Central, there is a database called the Insights Data Fabric (IDF) that stores configuration, periodic performance, and metric data from various components and services of the infrastructure.
When Prism Central Backup & Restore is enabled, data from the Prism Central IDF instance is periodically replicated to the Prism Element IDF instance that has been designated for backup. You can select up to three Nutanix clusters, running AHV or ESXi, as PC backup targets. The replication happens every 30 minutes. Port 9440 is used for the replication.
When a restore operation occurs, Prism Central is rebuilt on one of the backup Prism Element clusters and re-seeded with the data from the IDF data backup.
In this architecture diagram, we have Prism Central managing three clusters with Prism Central hosted on Cluster 1. Note that these clusters could be in different physical locations. The clusters chosen for backup can be running either ESXi or AHV as long as they are running AOS 6.0 or later, are managed by Prism Central, and at least one cluster needs to be at least AOS 6.5.3.1. Additionally, NTP must be configured on the PC to synchronize time between the PC and the registered clusters.
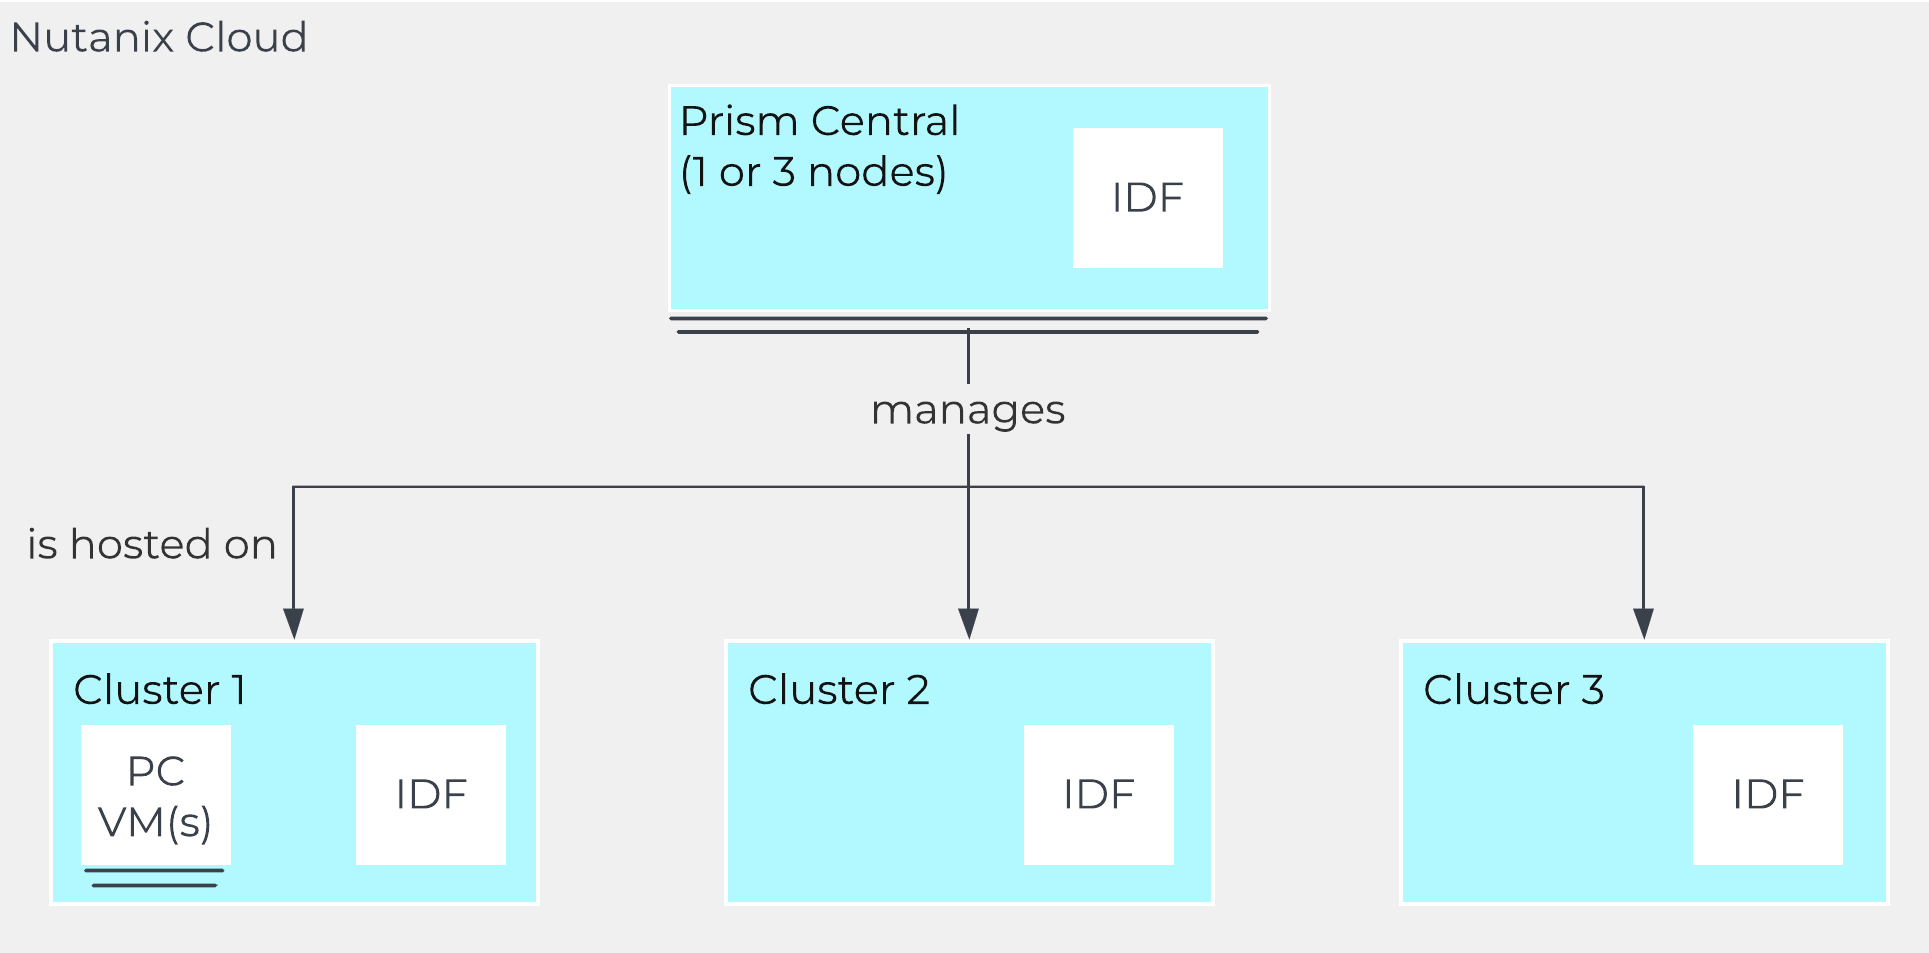
When enabling Prism Central Backup & Restore, the IDF data from Prism Central gets periodically synced to the IDF database on the chosen cluster(s) over TCP port 9440. In this example, Prism Central is hosted on Cluster 1 and is replicating to both Cluster 2 and Cluster 3.
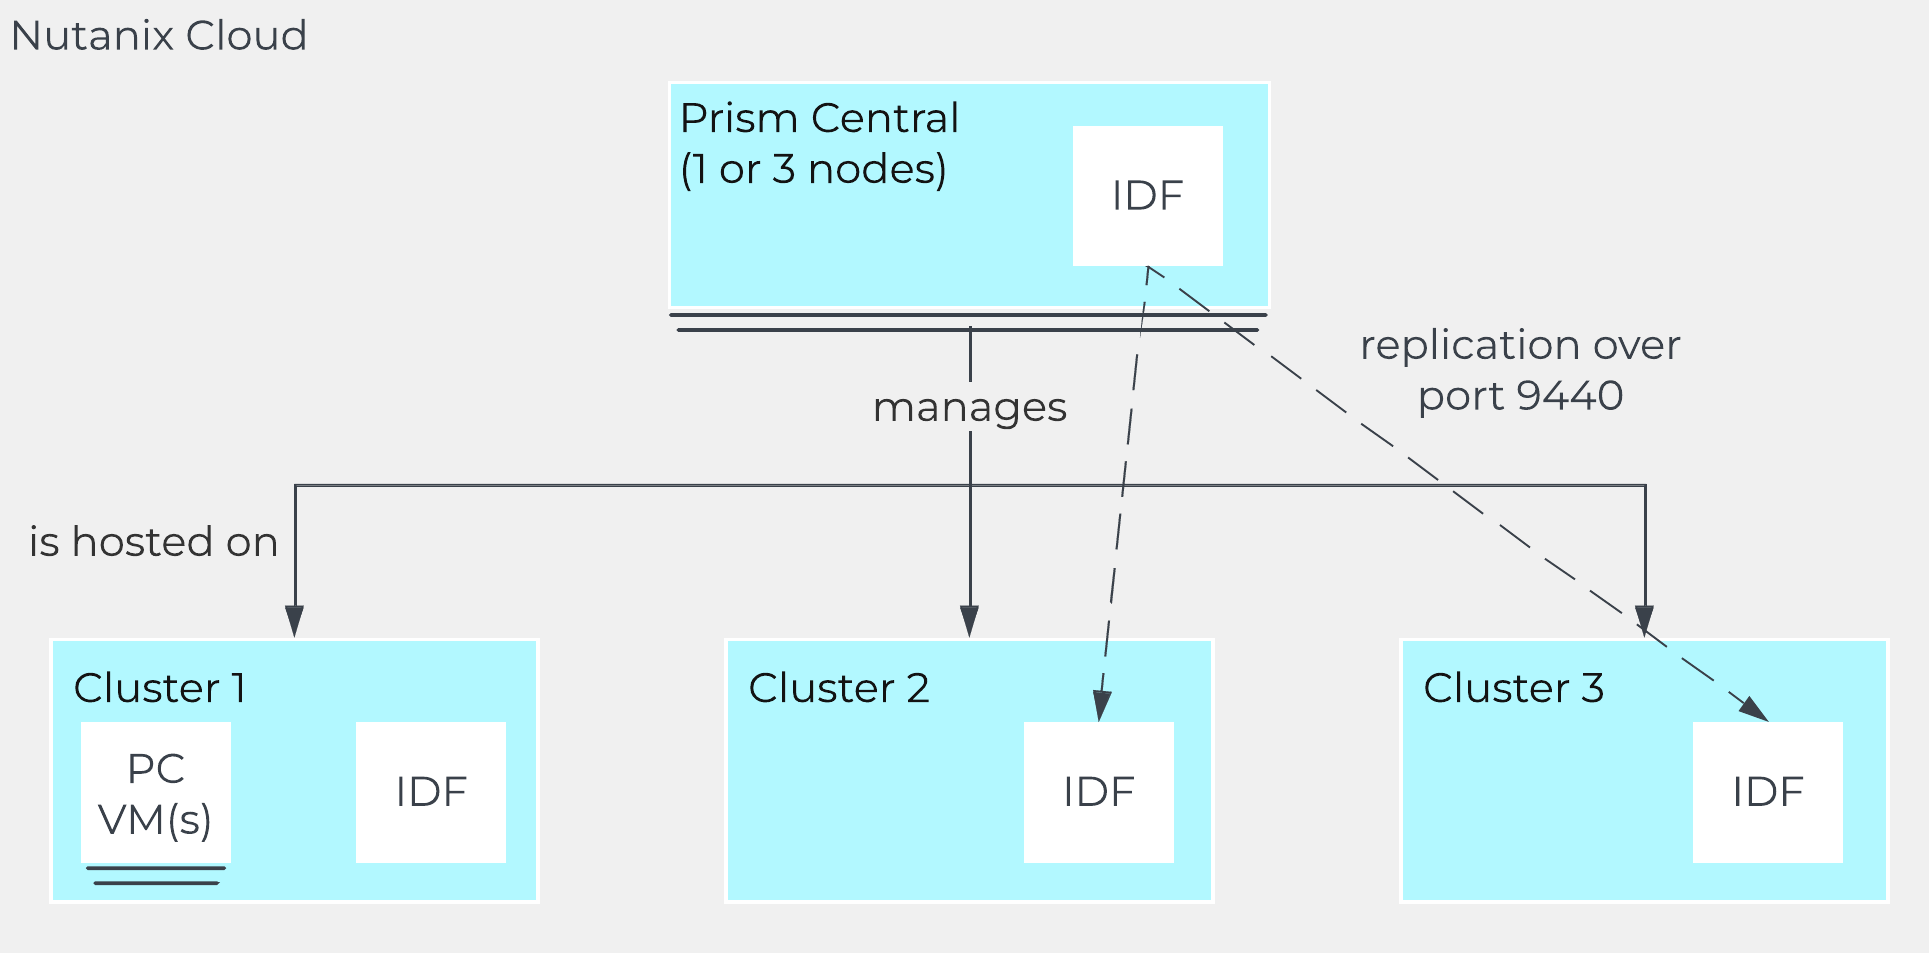
See the Prism Central Backup and Restore documentation for the full list of prerequisites along with which services and data are synced and restored.
If Cluster 1 is unavailable, Prism Central also becomes unavailable, and you can recover Prism Central from the Prism Element interface of either Cluster 2 or Cluster 3.
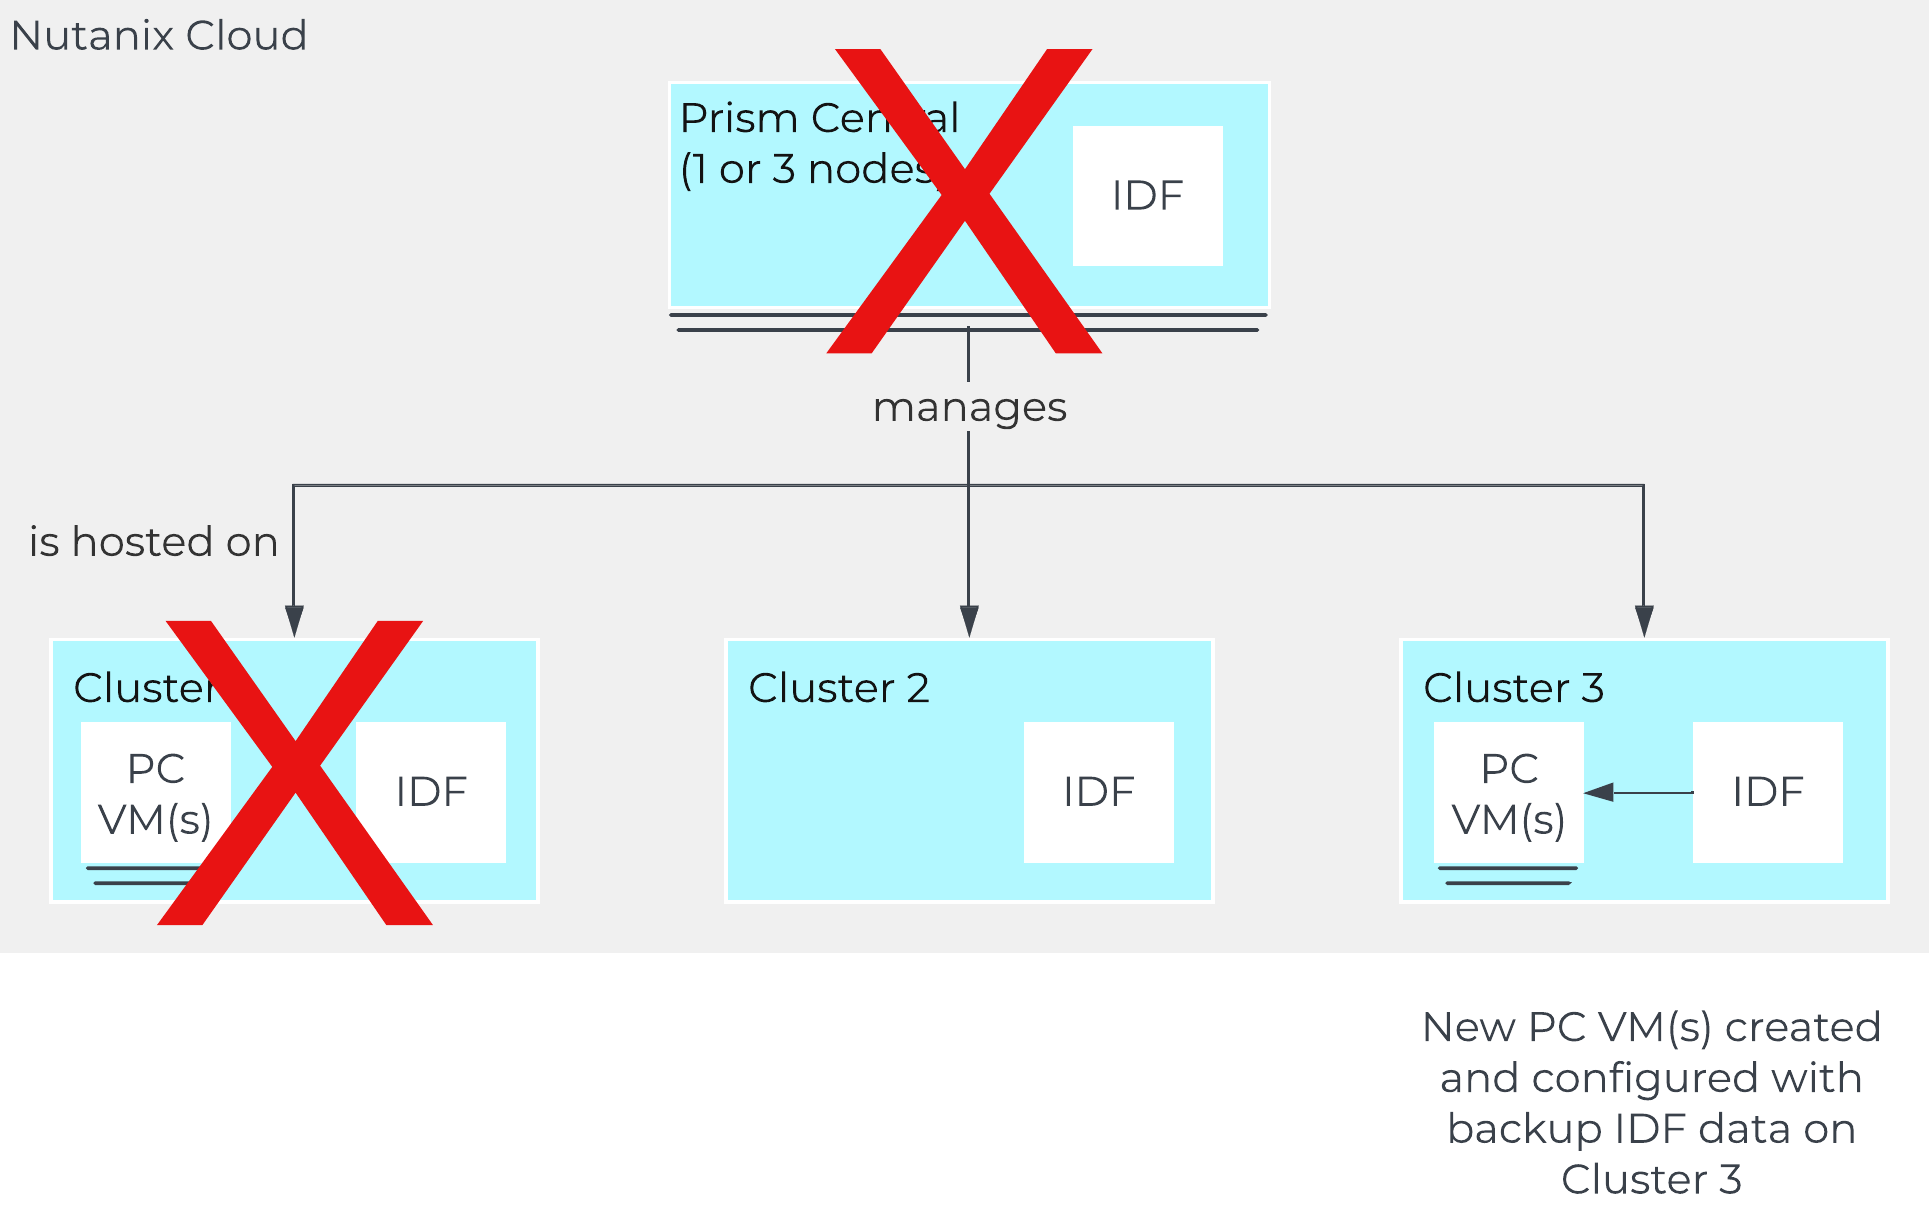
During the recovery process, ensure you use the new Prism Central deployment. If Cluster 1 comes back online, be sure to shut down or delete the original Prism Central. After recovery, replication continues to the same backup targets.
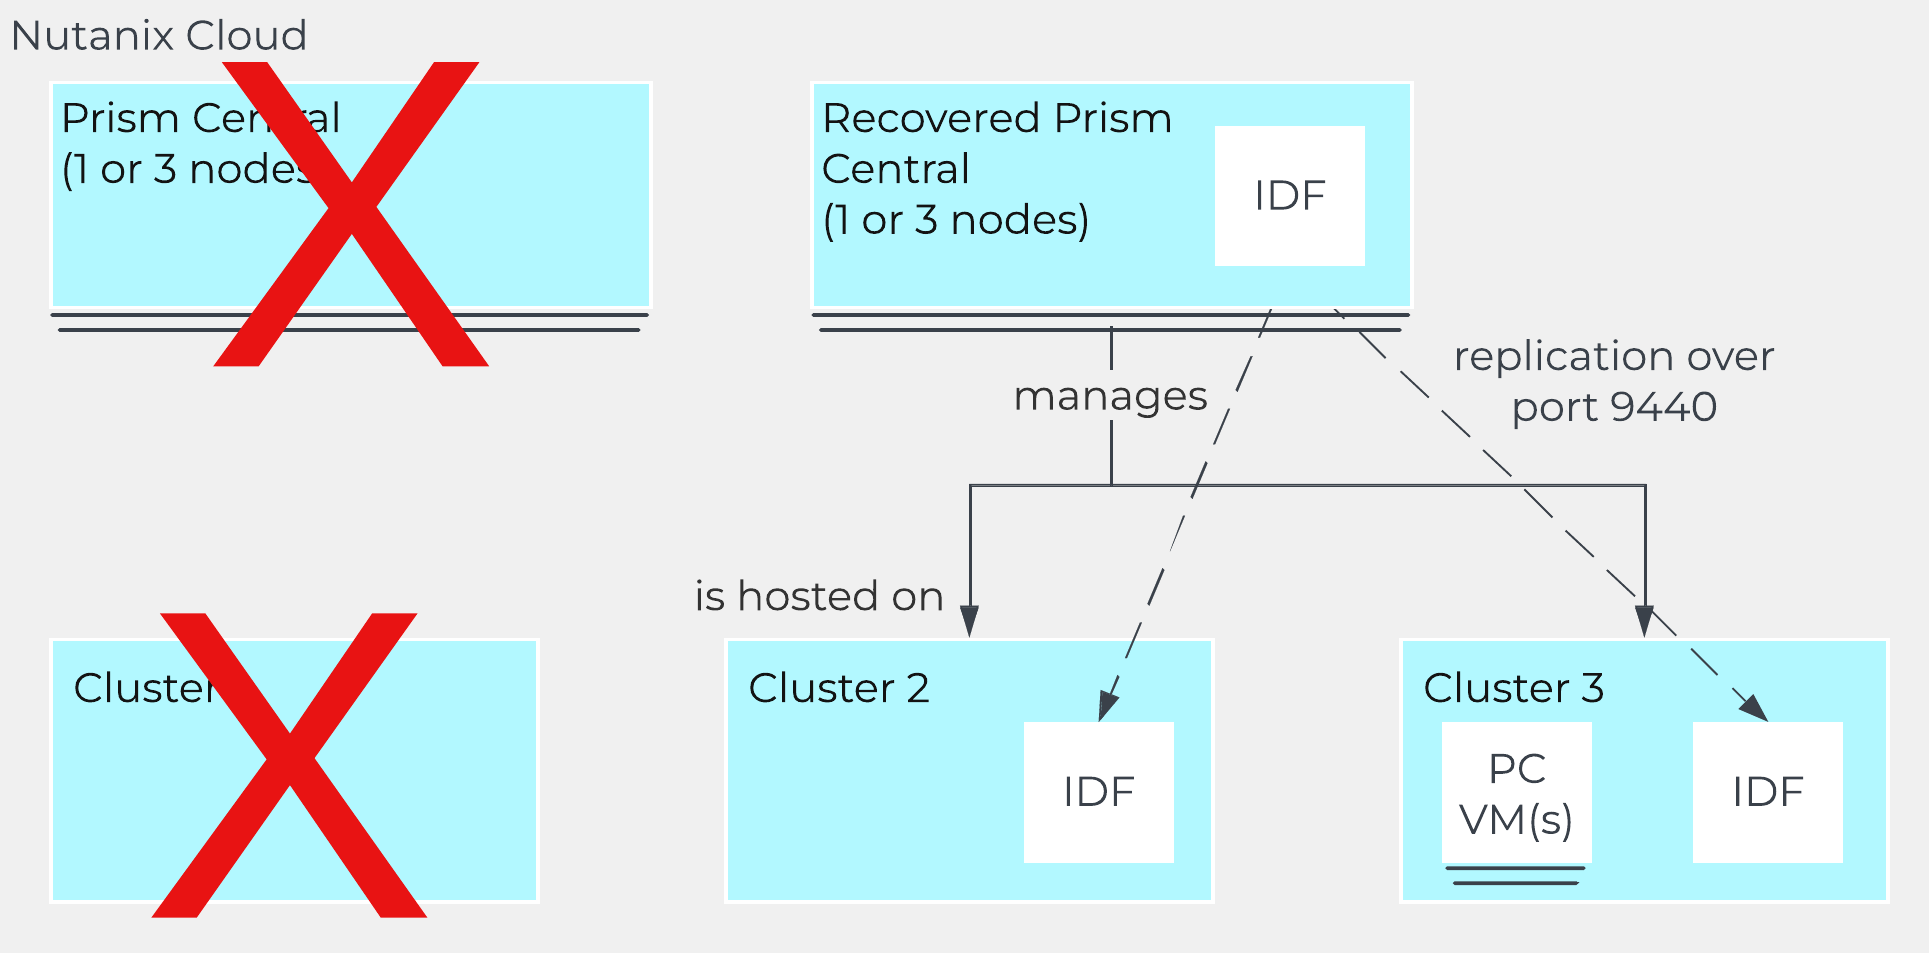
Nutanix Database ServiceLearn how Nutanix Database Service can simplify your database managment.
» Download this section as PDF (opens in a new tab/window)
Note
For those who are interested in getting hands on, take it for a spin with Nutanix Test Drive!
https://www.nutanix.com/test-ndbNutanix Database Service (NDB) is a Database-as-a-Service Platform that simplifies and automates database lifecycle management across on-premises and public clouds for Microsoft SQL Server, Oracle Database, PostgreSQL, MySQL, and MongoDB databases. With NDB, organizations can make database provisioning simple, fast, and secure to support agile application development, while efficiently and securely managing hundreds to thousands of databases to meet performance, availability, and cost requirements.
NDB can be deployed on any Nutanix cluster, including Nutanix Cloud Clusters (NC2) in the public cloud on AWS. Clusters can run AHV or ESXi. NDB takes advantage of Nutanix AOS snapshots, protection domain, and replication features, and leverages them for database management.
NDB runs on virtual machines (VM) and can be deployed in a highly available (HA) configuration. NDB also benefits from HA features of the Nutanix cluster, including live migration of the NDB VMs during Nutanix upgrades and node replacement or bringing up the VM on another host after failure. For more information on running databases on the Nutanix Cloud Platform with the Nutanix Database Service, check out the following resources:
- Nutanix.com Database Solutions Page
- Nutanix Validated Design for Databases
- Nutanix University NDB Playlist
The following chapters will discuss NDB in more detail:
» Download this section as PDF (opens in a new tab/window)
NDB Architecture
NDB is a software solution that can be deployed on Nutanix clusters running AHV or ESXi. NDB can be deployed with a single control plane VM, across multiple Nutanix clusters, with high availability (HA) configurations, and multi-cluster with HA configurations. However NDB is installed and configured, the database administration functions - provisioning, cloning, copy data management, patching, and backup - remain the same. In an HA deployment, the API, GUI, and metadata repository are resilient and will stay online during upgrades or a failure of a single VM. You can learn more about the configuration of the NDB control plane from the next page in this guide.
NDB Single Control Plane VM Deployment
NDB can be deployed as a single control plane VM; this install is ideal for situations where you do not need data resiliency for NDB’s API, GUI or metadata. However, the Nutanix Cloud Platform hosting the VM is highly available and resilient. During upgrades, NDB functionality will be offline during parts of the upgrade process.
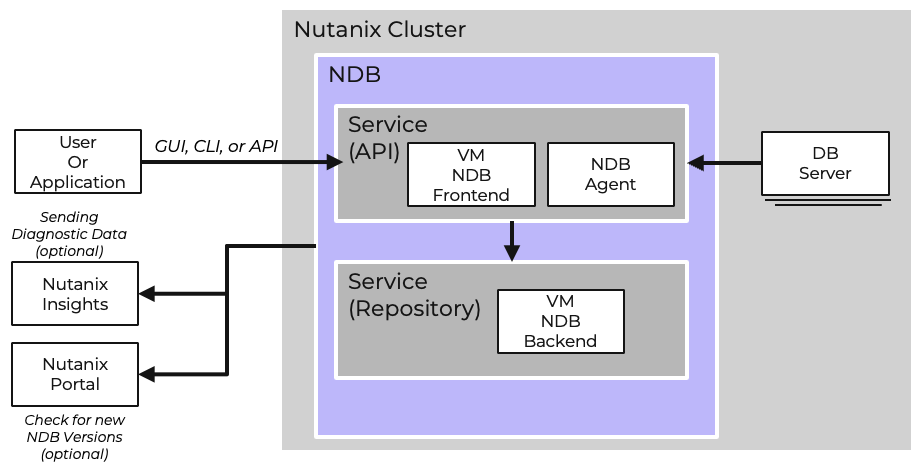
NDB Single Control Plane VM Components
- NDB Frontend
- The frontend server provides the web interface and serves as an API endpoint.
- Nutanix Database Agent
- The Agent is a service that schedules and monitors the NDB-related operations on database server VMs.
- Nutanix Database Service Backend The backend is the repository database that manages metadata such as deployed databases, database VMs configured, time machines, snapshots, log catch-up operations, retention policies, etc.
NDB Multi-Cluster Deployment
If you have multiple Nutanix clusters, you can deploy NDB across two or more clusters, which can address several use cases, including the following.
- Create and manage databases across multiple Nutanix clusters for high availability and disaster recovery (for example, Microsoft SQL Server availability groups or PostgreSQL high availability).
- Manage time machine data availability across all registered Nutanix clusters using data access management policies.
- Administer your production and nonproduction database instances across geographically distributed Nutanix clusters from a single panel.
- Clone databases for test and development from source databases across multiple sites.
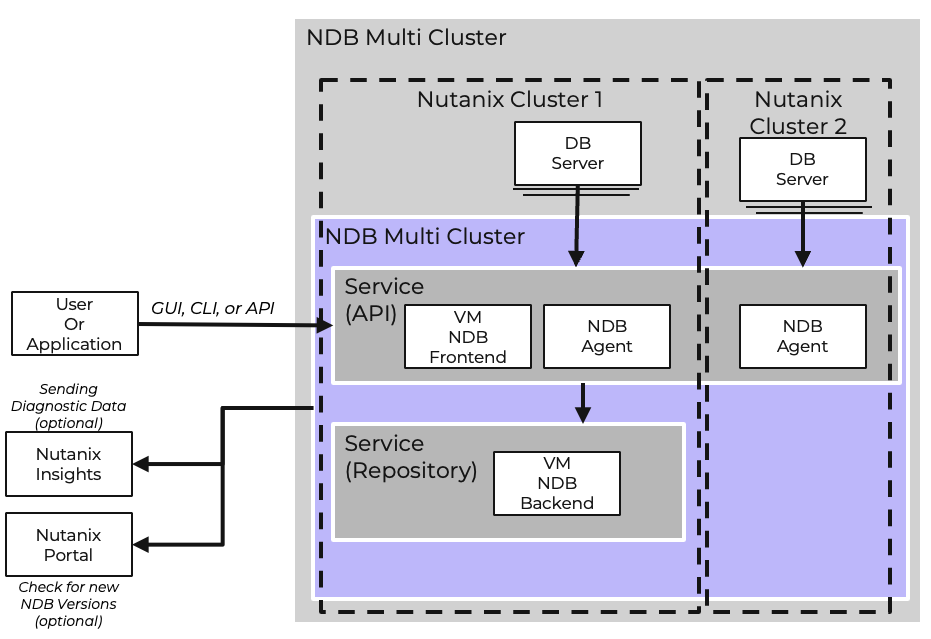
NDB High Availability (HA) Deployment
To ensure high availability with auto-failover for the NDB control plane, Nutanix requires three Nutanix clusters, running AHV or ESXi, to distribute the NDB control plane VMs across failure domains. To protect against site failure, these should be at separate DCs or sites with a round-trip time (RTT) of less than 25ms. Network latency greater than 25ms between selected clusters is not supported. A two-cluster topology is not supported as the Nutanix cluster running two API servers and two repository servers is considered a single point of failure.
Nutanix Database Service High Availability Components
- API server
- The stateless REST API gateway for the NDB control plane is used for the API frontend and the user interface.
- Repository
- A PostgreSQL database runs the data persistence layer of the NDB control plane and stores NDB metadata. In an HA configuration, NDB uses a Patroni failover manager with three PostgreSQL replicas (primary, synchronous, and asynchronous).
- HAProxy
- A high availability load balancer and proxy server that routes connectivity to API and repository servers.
- VIP
- A floating virtual IP address (VIP) spans HAProxy nodes to provide high availability to user connections. All front-end user connections go through the VIP. NDB uses Keepalived as the routing software to float a VIP across HAProxy nodes.
- NDB agent
- A VM in the NDB control plane management stack is created when you enable NDB for multiple clusters. All remote Nutanix clusters added to NDB have an instance of the NDB agent that manages, schedules, and runs database operations for that cluster.
- NDB database agent
- An NDB service runs on a database server VM. It schedules and monitors NDB-related operations on database server VMs.
When running HA on multiple clusters, the VLAN for the HA VMs needs to be shared on both clusters, or a stretched VLAN between the HA Proxy’s servers is required to place them on different Nutanix Clusters.
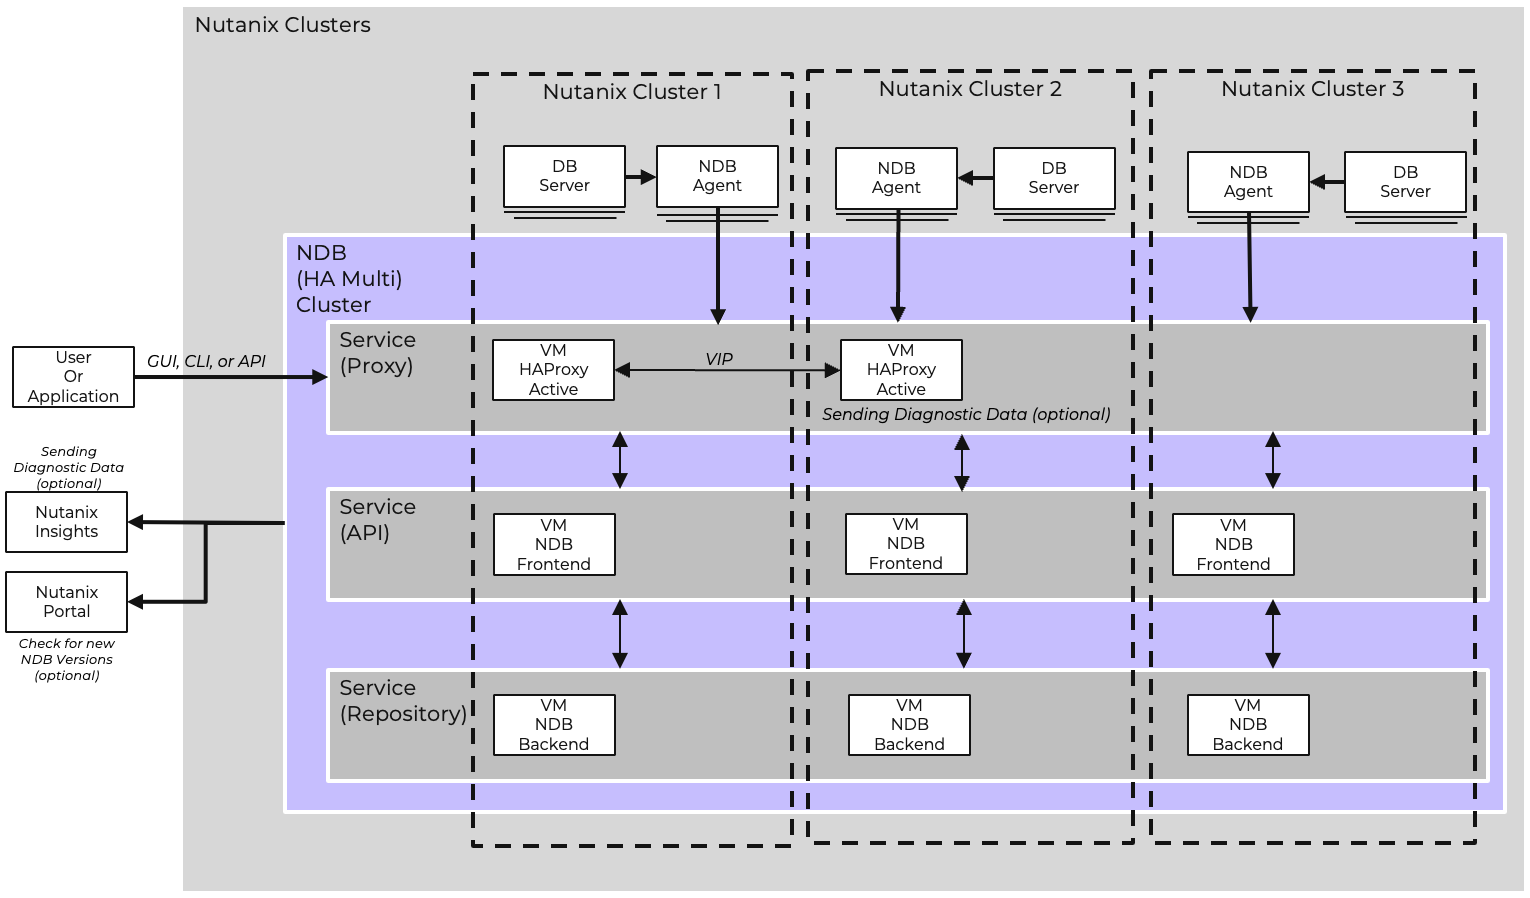
IP Address Requirements and VM Distribution for Different NDB Topologies
The NDB Administration Guide has the most up-to-date requirements for IP address and VM distribution to fit the needs of your Nutanix environment. The NBD HA reference architecture link below is also a good guide to see what best works in your environment.
Note
Pro tip
* In multi-cluster topologies:
* NDB server: In a non-HA configuration, the NDB server hosts all NDB service control plane components. When you enable HA, the original NDB server becomes the first NDB API server as part of the HA scale-out, which is why it does not exist in HA topology options.
High Availability Reference Architecture
Follow this link to find a reference architecture for NDB HA. This reference architecture is a comprehensive guide to configuring and deploying NDB High Availability (HA) with Nutanix AHV across multiple Nutanix clusters.
» Download this section as PDF (opens in a new tab/window)
Nutanix Database Service Control Plane
Control Plane Configuration
The following are the NDB service topology options:
- Single cluster, multi-cluster not enabled, NDB HA not enabled: single Nutanix cluster managed without HA.
- Multi cluster enabled, NDB HA not enabled: multiple Nutanix clusters managed without HA.
- Multi cluster enabled, NDB HA enabled across clusters: at least 3 Nutanix clusters managed, NDB control plane HA enabled across three Nutanix clusters.
When NDB is configured without HA enabled, as listed in the first two options above, the NDB services will be running on a single VM and will be unavailable when you upgrade NDB. The VM can be migrated to other nodes on the Nutanix Cluster it is running on. When HA is enabled, as in the last option above, NDB services spread out over multiple VMs, which makes the NDB services more resilient and will allow the NDB to stay online during upgrades.
You can read more about NDB HA on the architecture page in this guide.
Note
Note:
* You need a subscription to Nutanix Objects to store log backups in the Nutanix Objects store. For more information, see KB 13612.
* A database can be managed by only one NDB instance.
Time Machine Configuration
The maximum number of time machines for protecting databases that you can manage in your NDB environment will change depending on whether you are using NDB with high availability and if you are using NDB with Nutanix Objects. You can find these details in the NDB Administration Guide as well as the correct resource configuration for vCPU, cores and memory for the NDB control plane VMs.
Network Configuration
NDB can use any network VLAN configured on the Nutanix Cluster once the VLAN is added in the Administration section and a network profile is set up. Details for network ports and segmented networks are below.
Network Port Requirements
The port reference guides provide detailed port information for Nutanix products and services, including port sources and destinations, service descriptions, directionality, and protocol requirements.
This table provides links to the port reference guides.1
| NDB Port Requirments | Link to Document |
|---|---|
| Database server VM | NDB (Database Server VM) |
| Multi-cluster network | NDB (Multi-cluster Network) |
| Oracle | NDB (Oracle) |
| SQL Server | NDB (SQL Server) |
| PostgreSQL | NDB (PostgreSQL) |
| MySQL and MariadB | NDB (MySQL) |
| NDB control plane (HA) | NDB control plane (HA) |
Network Segmentation
NDB supports Nutanix Cloud Clusters with network segmentation configured for the management, virtual machines, and data services. See the architecture diagram below.
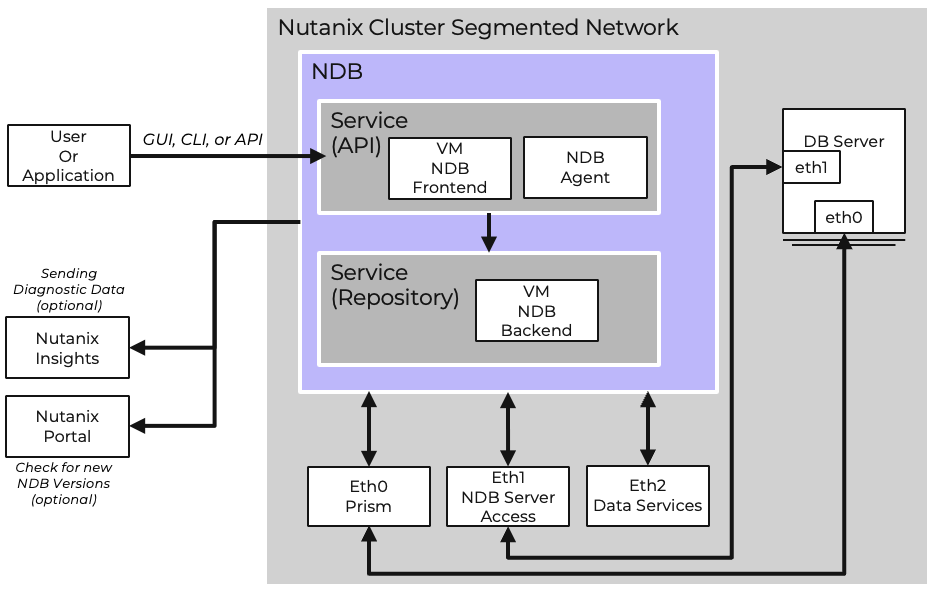
Learn if your databases can utilize segmented networks and how to set up each database’s network profile in the NDB Management guide on the portal.
Database Best Practices
When NDB provisions a database, it will apply the current recommended best practices from Nutanix. Click on the links below to view best practices for deploying databases with NDB in the Nutanix support portal.
- MySQL/MariaDB Best Practices
- PostgreSQL Best Practices
- Microsoft SQL Best Practices
- Oracle Best Practices
- If you are not using the Nutanix Database Service and are running databases on Nutanix, you must apply these best practices manually to get the best performance from your databases.
Footnotes
APIsLearn how you can automate Prism Element, Prism Central and other Nutanix product functionality via REST API.
» Download this section as PDF (opens in a new tab/window)
The Prism Central and Prism Element user interfaces are key components of Nutanix Cloud Platform (NCP) management. However, multiple use cases require programmatic control of Prism Central features and functions, combined with equivalent programmatic control over Nutanix products that integrate with Prism Central. Most functionality exposed through the Prism Central and Prism Element interfaces are also exposed through a full set of REST APIs and, with the release of the Nutanix v4 APIs, through a set of language-specific SDKs. These APIs and SDKs provide the ability to programmatically interface with the Nutanix Cloud Platform, allowing customers and partners to enable automation, 3rd-party tools, scripts, apps or even create a customized UI if required.
Core to any dynamic or “software-defined” environment, Nutanix provides various methods to allow for simple programmability and interfacing. Here are the main interfaces:
- REST API
- Language-specific SDKs
- CLI - aCLI, nCLI and nuclei
- Scripting interfaces
Note
Nutanix.dev - Nutanix Developer Portal
To learn more about the available Nutanix Prism and product APIs, review sample code and go through self-paced labs, be sure to check out https://www.nutanix.dev!
Resources and Scripts:
- Nutanix.dev (Developer Portal): https://www.nutanix.dev
- Nutanix.dev Github - https://github.com/nutanixdev
- Nutanix.dev Code Samples - https://www.nutanix.dev/code_samples
- Nutanix.dev Technical Articles - https://www.nutanix.dev/blog/
- Nutanix v4 API Documentation: https://developers.nutanix.com
- Nutanix Github - https://github.com/nutanix
Disclaimer: All code samples are © Nutanix, Inc., and are provided as-is under the MIT license (https://opensource.org/licenses/MIT).
» Download this section as PDF (opens in a new tab/window)
REST API and SDK Introduction
Note: The Nutanix v4 APIs are the recommended version for all use cases. This introduction will focus on the v4 Prism Central APIs; legacy APIs (v1, v2 and v3) should only be used when the a specific function or feature is not available in the v4 APIs.
The Prism Central REST API exposes nearly every capability and data point of the Prism Central UI and allows for orchestration or automation tools to easily drive Nutanix Prism Central operations. This enables tools like Terraform, Ansible, Saltstack, Puppet and more to easily create custom workflows for the Nutanix Cloud Platform. This means that any third-party developer could create their own custom UI and pull in Nutanix data via REST.
Note
REST APIs vs SDKs
This section of the Nutanix Cloud Bible will include on REST API examples. Note, however, that all REST API functionality is also available via the language-specific Nutanix v4 SDKs.
Nutanix v4 API and SDK Documentation
All Nutanix v4 API documentation is accessed through the new documentation portal, available at https://developers.nutanix.com. The screenshot below shows the home page for the Nutanix v4 API documentation.

Note: Legacy v3 APIs are still supported in the Nutanix REST API Explorer, available when logged into Prism Central.
Nutanix v4 API: SDK Language Support
The following language-specific SDKs are currently available.
- Python (3.6, 3.7, 3.8 and 3.9 are officially supported)
- Java
- Go
- JavaScript
- Microsoft C#
REST API Explorer for legacy v2 APIs (Prism Element)
Legacy APIs are still supported in the Nutanix REST API Explorer, as shown in the screenshots below.

Operations can be expanded to display details and examples of the REST call:

REST API Explorer for legacy v3 APIs (Prism Central)


REST API Authentication
Nutanix v4 REST APIs support two authentication types:
- HTTP Basic Authentication by username and password
- Nutanix IAM API key authentication using built-in or environment-specific Authorization Policies
Nutanix v4 REST API authentication fully supports Nutanix IAM (Identity and Access Management) Roles and Authorization Policies.
Nutanix IAM Authorization Policies provide the ability to apply granular control over specific entities. For example, an IAM Authorization Policy defining a user with permission to work with only Virtual Machines will not allow the user to work with networking entities (subnets, etc).
REST API Versions
Nutanix Prism Element and Prism Central currently offer three generally available APIs:
- v4, available in Prism Central only. Recommended API for all administrative activity such as virtual machine management and CRUD operations as well as Prism Central integrated product management such as NCM Self-Service and Flow Network Security.
- Legacy v3, available in Prism Central only. Fully supported until deprecation at a later date and used for multicluster activities such as virtual machine management, Nutanix product management including NCM Self-Service (formerly Calm), Flow Networy Security.
- Legacy v2.0, available in Prism Element only. Fully supported until deprecation at a later date. Used for cluster-local activities such as storage container management operations, specifically in environments without a Prism Central deployment.
For detailed information on the available API versions and the operations they expose, see API Versions on Nutanix.dev.
Nutanix Products Providing APIs
A non-exhaustive list of Nutanix products that can be fully or partially managed by API is as follows. Documentation is linked, where appropriate.
- Nutanix Prism Central: v4
- Nutanix Prism Central: v3
- Nutanix Prism Element
- NCM Self-Service
- Nutanix Database Service
For a complete list of all API references, see Nutanix.dev API Reference.
Prism Central v4 APIs and SDKs
Current GA and primary REST API for all Prism Central programmatic operations.
Prism Element v2.0 vs Prism Central v3 APIs
Note: Provided for legacy and backwards-compatibility support only.
The chosen API will depend on the required operations.
Prism Central v3 is multi-cluster and available through Prism Central only. It exposes operations that can impact multiple clusters such as distributed disk images, NCM Self-Service (formerly Calm) blueprints and apps, marketplace items and network security rules.
Prism Element v2.0 is cluster-local and available through Prism Element only. It exposes operations specific to the local cluster entities such as storage containers, data-at-rest encryption, storage pools and hosts.
Usage Examples: Prism Central API v4 REST APIs
Request
Accessible through Nutanix Prism Central only; all API requests are as constructed as follows.
METHOD https://PRISM_CENTRAL_IP_OR_FQDN:9440/api/NAMESPACE/VERSION/PATH/ACTIONS
Example of a request to list all Prism Central images, assuming the Prism Central IP is 192.168.1.110.
GET https://192.168.1.110:9440/api/vmm/v4.2/content/images
Example of image creation:
POST https://192.168.1.110:9440/api/vmm/v4.2/content/images
Accompanied by image configuration in JSON format. For example:
{
  "name": "rocky10cloud",
  "type": "DISK_IMAGE",
  "description": "Rocky Linux 10 Cloud Image from v4 APIs",
  "source": {
    "url": "",
    "$objectType": "vmm.v4.content.UrlSource"
  },
  "clusterLocationExtIds": [
    ""
  ]
}
To ensure request idempotency, this request must be accompanied by the Ntnx-Request-Id header, the value of which is a UUID that uniquely identifies this specific request. UUID generation will vary by environment but can be generated by various online tools.
Response
The response from this request contains the task status, indicated by the data.extId field. This task, when viewed in Prism Central or via API, would show the operation’s status, including percentage complete and any errors that occurred during the process.
{
    "data": {
        "$reserved": {
            "$fv": "v4.r2"
        },
        "$objectType": "prism.v4.config.TaskReference",
        "extId": "ZXJnb24=:a4f483b6-0907-4ac2-a7df-b54e42d062d3"
    },
    "$reserved": {
        "$fv": "v4.r2"
    },
    "$objectType": "vmm.v4.content.CreateImageApiResponse",
    "metadata": {
        "flags": [
            {
                "$reserved": {
                    "$fv": "v1.r0"
                },
                "$objectType": "common.v1.config.Flag",
                "name": "hasError",
                "value": false
            },
            {
                "$reserved": {
                    "$fv": "v1.r0"
                },
                "$objectType": "common.v1.config.Flag",
                "name": "isPaginated",
                "value": false
            },
            {
                "$reserved": {
                    "$fv": "v1.r0"
                },
                "$objectType": "common.v1.config.Flag",
                "name": "isTruncated",
                "value": false
            }
        ],
        "$reserved": {
            "$fv": "v1.r0"
        },
        "$objectType": "common.v1.response.ApiResponseMetadata",
        "links": [
            {
                "$reserved": {
                    "$fv": "v1.r0"
                },
                "$objectType": "common.v1.response.ApiLink",
                "href": "https://192.168.1.110:9440/api/prism/v4.2/config/tasks/ZXJnb24=:a4f483b6-0907-4ac2-a7df-b54e42d062d3",
                "rel": "self"
            },
            {
                "href": "https://192.168.1.110:9440/api/vmm/v4.2/content/images",
                "rel": "image-list"
            }
        ]
    }
}
To use this example in your own environment, change the `` variables to those matching your requirements.
Related Resources
- v4 REST API: Create Prism Central Image complete REST API code sample on Nutanix.dev
- v4 Python SDK: Create Prism Central Image complete Python SDK code sample on Nutanix.dev
- Nutanix v4 API Code Sample Library.
Usage Examples: Prism API v3.0
Request
Nutanix Prism API v3 is available through Prism Central only. All API requests are as constructed as follows.
METHOD https://PRISM_CENTRAL_IP:9440/api/nutanix/v3/API_NAME/VARIABLES
Example of a request to list all virtual machines, assuming the Prism Central IP is 192.168.1.110.
POST https://192.168.1.110:9440/api/nutanix/v3/vms/list
Accompanied by an appropriate payload in JSON format. In this example Prism Central is instructed to return all items of type vm.
{
    "kind": "vm"
}
Example of VM creation:
POST https://192.168.1.110:9440/api/nutanix/v3/vms
Accompanied by VM configuration in JSON format. For example:
{
    "spec": {
        "name": "vm_api_v3",
        "resources": {},
        "cluster_reference": {
            "uuid": "0005f2f7-eee7-1995-6145-ac1f6b35fe5e",
            "kind": "cluster"
        }
    },
    "metadata": {
        "kind": "vm"
    }
}
Response
The response from this request contains the task status, currently PENDING, and task details including the cluster that owns the new VM and a task_uuid that can be queried using the tasks API.
{
    "status": {
        "state": "PENDING",
        "execution_context": {
            "task_uuid": "1c64cc8b-241d-4132-955f-f6e26239ac02"
        }
    },
    "spec": {
        "name": "vm_api_v3",
        "resources": {},
        "cluster_reference": {
            "kind": "cluster",
            "uuid": "0005f2f7-eee7-1995-6145-ac1f6b35fe5e"
        }
    },
    "api_version": "3.1",
    "metadata": {
        "use_categories_mapping": false,
        "kind": "vm",
        "spec_version": 0,
        "uuid": "d965afdc-4606-4a0b-bc99-f868ae615039"
    }
}
To use this example in your own environment, change the cluster uuid to a value appropriate for your cluster.
For more information see, Create a new VM in the Nutanix.dev API reference.
Usage Examples: Prism API v2.0
Request
Nutanix Prism API v2.0 is available through Prism Element only. All API requests are as constructed as follows.
METHOD https://CVM_OR_CLUSTER_IP:9440/api/nutanix/v2.0/API_NAME/VARIABLES
Example of a request to list all storage containers, assuming the cluster IP is 192.168.1.110.
GET https://192.168.1.110:9440/api/nutanix/v2.0/storage-containers
Example of VM creation:
POST https://192.168.1.110:9440/api/nutanix/v2.0/vms
Accompanied by VM configuration in JSON format. For example:
{
    "description": "VM created by v2.0 API",
    "memory_mb": 1024,
    "name": "vm_api_v2.0",
    "num_vcpus": 1,
    "num_cores_per_vcpu": 1,
    "vm_disks": [
        {
            "is_cdrom": false,
            "vm_disk_create": {
                "size": 128849018880,
                "storage_container_uuid": "b2fefc62-6274-4c84-8e6c-a61f5313ea0e"
            }
        }
    ]
}
Response
The response from this request contains a Prism task UUID that can be queried using the prism namespace’s tasks API.
{
    "task_uuid": "eec7d743-b6c7-4c6d-b821-89b91b142f1d"
}
To use this example in your own environment, change storage_container_uuid to a value appropraite for your cluster.
For more information see Create a Virtual Machine in the Nutanix.dev API reference.
Note: The /api/nutanix/v2.0 path is an alias for /PrismGateway/services/rest/v2.0. The PrismGateway path will often be referenced in the Prism API v2.0 documentation; both paths can be used interchangeably and will produce identical results.
» Download this section as PDF (opens in a new tab/window)
aCLI
The Acropolis CLI (aCLI) is the CLI for managing the Acropolis and AHV portion of the Nutanix product for tasks like AHV host, network, and VM management. These capabilities were enabled in releases after AOS 4.1.2 and are available on Nutanix AHV cluster CVMs only. aCLI is not supported on Prism Central.
The current aCLI command reference can be found on the Nutanix Portal.
Enter aCLI Shell
Description: Enter aCLI shell.
acliOR
Description: Execute aCLI command via Linux shell
acli <command>Output aCLI Response in JSON Format
Description: Enter aCLI shell. Any responses to commands will be in JSON format.
acli –o jsonList AHV Hosts
Description: Lists AHV nodes in the cluster.
host.listThis screenshot shows the output from ‘host.list’ in both tabulated and JSON format. The obfuscated information are cluster specific serial numbers and IP address details.

Create Network
Description: Create network based on VLAN
net.create NAME TYPE.ID[.VSWITCH] ip_config=A.B.C.D/NN vlan="VLAN"Example:
net.create vlan.133 ip_config=10.1.1.1/24 vlan="133"List Networks
Description: List networks
net.listCreate DHCP Scope
Description: Create dhcp scope
net.add_dhcp_pool NET NAME start=START IP A.B.C.D end=END IP W.X.Y.ZNote: The last usable IP address in the network range is selected for the Acropolis DHCP server if an address for the DHCP server wasn’t set during network creation.
Example:
net.add_dhcp_pool vlan.100 start=10.1.1.100 end=10.1.1.200 vlan="100"Get Existing Network Details
Description: Get a network’s VMs and details including VM name / UUID, MAC address and IP
net.list_vms NETNAMEExample:
net.list_vms vlan.133Configure DHCP DNS Servers for Network
Description: Set DHCP DNS
net.update_dhcp_dns NETNAME servers=COMMA SEPARATED DNS IPs domains=COMMA SEPARATED DOMAINSExample:
net.update_dhcp_dns vlan.100 servers=10.1.1.1,10.1.1.2 domains=ntnxlab.localCreate Virtual Machine
Description: Create VM
vm.create COMMA SEPARATED VM NAMES memory=NUM MEM MB num_vcpus=NUM VCPU num_cores_per_vcpu=NUM CORES ha_priority=PRIORITY INTExample:
vm.create testVM memory=2G num_vcpus=2Bulk Create Virtual Machines
Description: Create bulk VMs
vm.create CLONEPREFIX[STARTING INT..END INT] memory=NUM MEM MB num_vcpus=NUM VCPU num_cores_per_vcpu=NUM CORES ha_priority=PRIORITY INTExample:
vm.create testVM[000..999] memory=2G num_vcpus=2Clone VM from Existing
Description: Create clone of existing VM
vm.clone CLONE NAME(S) clone_from_vm=SOURCE VM NAMEExample:
vm.clone testClone clone_from_vm=MYBASEVMBulk Clone VMs from Existing VM
Description: Create bulk clones of existing VM
vm.clone CLONEPREFIX[STARTING INT..END INT] clone_from_vm=SOURCE VM NAMEExample:
vm.clone testClone[001..999] clone_from_vm=MYBASEVMCreate Disk and Add to VM
Description: Create disk for OS
vm.disk_create VM NAME create_size=Size and qualifier, e.g. 500G container=CONTAINER NAMEExample:
vm.disk_create testVM create_size=500G container=defaultAdd NIC to VM
Description: Create and add NIC
vm.nic_create VM NAME network=NETWORK NAME model=MODELExample:
vm.nic_create testVM network=vlan.100Set VM Boot Device to Disk
Description: Set a VM boot device
Set to boot from specific disk id
vm.update_boot_device VM NAME disk_addr=DISK BUSExample:
vm.update_boot_device testVM disk_addr=scsi.0Add CD-ROM to VM
vm.disk_create VM NAME cdrom="true" empty="true"Example:
vm.disk_create testVM cdrom="true" empty="true"Set VM Boot Device to CD-ROM
Set to boot from CD-ROM
vm.update_boot_device VM NAME disk_addr=CD-ROM BUSExample:
vm.update_boot_device testVM disk_addr=ide.0Mount ISO to CD-ROM
Description: Mount ISO to VM CD-ROM
Steps:
- Upload ISOs to container
- Enable whitelist for client IPs
- Upload ISOs to share
Create CD-ROM with ISO
vm.disk_create VM NAME clone_from_afsf_file=/CONTAINER/ISO CD-ROM=trueExample:
vm.disk_create testVM clone_from_adfs_file=/default/myfile.iso CD-ROM=trueDetach ISO from CD-ROM
Description: Remove ISO from CD-ROM
vm.disk_update VM NAME CD-ROM BUS empty=truePower On VM(s)
Description: Power on VM(s)
vm.on VM NAME(S)Example:
vm.on testVMPower on all VMs.
Example:
vm.on *Power on all VMs matching a prefix.
Example:
vm.on testVM*Power on range of VMs.
Example:
vm.on testVM[0-9][0-9]nCLI
The current nCLI command reference can be found on the Nutanix Portal.
The Nutanix Command Line Interface (nCLI) allows you to run system administration commands against the Nutanix cluster. In contrast to aCLI, nCLI can be installed on your local machine. See the Nutanix Portal link above for installation details.
Display Nutanix Version
Description: Displays the current version of the Nutanix software
ncli cluster versionThis screenshot shows the output from ‘ncli version’ as both a single-line command and from within an ncli “session”.

Add Subnet to NFS whitelist
Description: Adds a particular subnet to the NFS whitelist
ncli cluster add-to-nfs-whitelist ip-subnet-masks=10.2.0.0/255.255.0.0List Storage Pools
Description: Displays the existing storage pools
ncli sp lsNote: This example shows the use of shortened commands. “storagepool” becomes “sp”, “list” becomes “ls”.
List Storage Containers
Description: Displays the existing containers
ncli ctr lsCreate Storage Container
Description: Creates a new container
ncli ctr create name=NAME sp-name=SP NAMEList VMs
Description: Displays the existing VMs
ncli vm lsList Public Keys
Description: Displays the existing public keys
ncli cluster list-public-keysAdd Public Key
Description: Adds a public key for cluster access
SCP public key to CVM
Add public key to cluster
ncli cluster add-public-key name=myPK file-path=~/mykey.pubRemove Public Key
Description: Removes a public key for cluster access
ncli cluster remove-public-keys name=myPKCreate Protection Domain
Description: Creates a protection domain
ncli pd create name=NAMECreate Remote Site
Description: Create a remote site for replication
ncli remote-site create name=NAME address-list=Remote Cluster IPCreate Protection Domain For All VMs In Storage Container
Description: Protect all VMs in the specified container
ncli pd protect name=PD NAME ctr-id=Container ID cg-name=NAMECreate Protection Domain With Specified VMs
Description: Protect the VMs specified
ncli pd protect name=PD NAME vm-names=VM Name(s) cg-name=NAMECreate Protection Domain for AOS files (aka vDisk)
Description: Protect the DSF Files specified
ncli pd protect name=PD NAME files=File Name(s) cg-name=NAMECreate Protection Domain Snapshot
Description: Create a one-time snapshot of the protection domain
ncli pd add-one-time-snapshot name=PD NAME retention-time=secondsCreate Snapshot and Replication Schedule to Remote Site
Description: Create a recurring snapshot schedule and replication to n remote sites
ncli pd set-schedule name=PD NAME interval=seconds retention-policy=POLICY remote-sites=REMOTE SITE NAMEList Replication Status
Description: Monitor replication status
ncli pd list-replication-statusMigrate Protection Domain to Remote Site
Description: Fail-over a protection domain to a remote site
ncli pd migrate name=PD NAME remote-site=REMOTE SITE NAMEActivate Protection Domain
Description: Activate a protection domain at a remote site
ncli pd activate name=PD NAMECheck Cluster Resiliency Status
# Node status
ncli cluster get-domain-fault-tolerance-status type=node
# Block status
ncli cluster get-domain-fault-tolerance-status type=rackable_unitnuclei
Nuclei is a Prism Central-only command-line tool. Typically used by support engineers (SREs) it can currently be used for administrative purposes when advised by the Nutanix support organisation. Nuclei is not typically required in most environments.
Enter nuclei Shell
Description: Enter nuclei shell.
nucleiOR
Description: Execute nuclei command via Linux shell
nuclei <command># List Users
nuclei user.list
Or, without entering a nuclei session:

» Download this section as PDF (opens in a new tab/window)
PowerShell Cmdlets
To get started with Nutanix PowerShell Cmdlets, see PowerShell Cmdlets Reference on the Nutanix Support Portal.
The below will cover the Nutanix PowerShell Cmdlets, how to use them and some general background on Windows PowerShell.
PowerShell Versions
At the time of writing, the latest available version is PowerShell 7.3.4
Commands outlined in this Nutanix Bible chapter may not apply to earlier PowerShell versions.
Nutanix Cmdlets Versions
At the time of writing, the latest available version is Nutanix Cmdlets v2.0
Commands outlined in this Nutanix Bible chapter may not apply to other versions of the Nutanix Cmdlets.
PowerShell Basics
Windows PowerShell is a powerful shell and scripting language built on the .NET framework. It is a very simple to use language and is built to be intuitive and interactive. Within PowerShell there are a few key constructs/Items:
Cmdlets
Cmdlets are commands or .NET classes which perform a particular operation. They are usually conformed to the Getter/Setter methodology and typically use a Verb-Noun based structure. For example: Get-Process, Set-Partition, etc.
Piping Or Pipelining
Piping is an important construct in PowerShell (similar to its use in Linux) and can greatly simplify things when used correctly. With piping you’re essentially taking the output of one section of the pipeline and using that as input to the next section of the pipeline. The pipeline can be as long as required (assuming there remains output which is being fed to the next section of the pipe). A very simple example could be getting the current processes, finding those that match a particular trait or filter and then sorting them:
Get-Service | where {$_.Status -eq "Running"} | Sort-Object NamePiping can also be used in place of for-each, for example:
# For each item in my array
$myArray | %{
  # Do something
}
Key Object Types
Below are a few of the key object types in PowerShell. You can easily get the object type by using the .getType() method, for example: $someVariable.getType() will return the objects type.
Variables
$myVariable = "foo"Note: You can also set a variable to the output of a series or pipeline of commands:
$myVar2 = (Get-Service | where {$_.Status -eq "Running"})$myVar3 = (Get-Process | where {$_.ProcessName -eq "Chrome"})In this example the commands inside the parentheses will be evaluated first then variable will be the outcome of that.
Array
$myArray = @("Value","Value")Note: You can also have an array of arrays, hash tables or custom objects
Hash Table
$myHash = @{"Key" = "Value";"Key" = "Value"}Useful Commands
Get the help content for a particular Cmdlet (similar to a man page in Linux)
Get-Help Cmdlet NameExample:
Get-Help Get-ProcessList properties and methods of a command or object
<expression or object> | Get-MemberExample:
$someObject | Get-MemberCore Nutanix Cmdlets And Usage
The Nutanix Cmdlets can be downloaded directly from the Prism Central UI and can be found on the drop down in the upper right hand corner:

Nutanix Cmdlets v2.0 - Usage Examples
The current Nutanix Cmdlet v2.0 reference can be found on the Nutanix Portal.
List Nutanix Cmdlets
Get-Command -Module Nutanix.Prism.CommonGet-Command -Module Nutanix.Prism.Ps.CmdsConnect To Prism Central
Prompt for all connection details and accept valid SSL certificates only:
Connect-PrismCentralSupply connection details (excluding password), accept valid and invalid SSL certificates:
Connect-PrismCentral -AcceptInvalidSSLCerts -Server <prism_central_ip_addres> -UserName <username>List All Virtual Machines
Get-VMGet Nutanix VMs Matching A Certain String
Assign to variable:
$searchString = "my-vm-name"
$vms = Get-VM | where {$_.vmName -match $searchString}
Interactive:
$myVm = Get-VM | where {$_.vmName -match "myVmName"}Interactive and formatted:
$myVm = Get-VM | where {$_.vmName -match "myVmName"} | ftList All Storage Containers
Get-StorageContainerGet Storage Container With Similar Names
Get-StorageContainer | where {$_.name -like "Nutanix*"}List All Networks
Get-NetworkGet Specific Network By Name
Get-Network | where ${_.name -eq "Default"}Disconnect From Prism Central
Disconnect-PrismCentralNote
Legacy Nutanix Cmdlets Information
The information in the following section applies to legacy Nutanix Cmdlets and PowerShell versions only. It has been left here for legacy support. Where possible, new users are recommended to install the latest version of both PowerShell and the Nutanix Cmdlets.
Nutanix Cmdlets v1.0 - Usage Examples
The Nutanix Cmdlet v1.0 reference can be found on the Nutanix Portal.
Load Nutanix Snapin
Check if snapin is loaded and if not, load
if ( (Get-PSSnapin -Name NutanixCmdletsPSSnapin -ErrorAction SilentlyContinue) -eq $null )
{
    Add-PsSnapin NutanixCmdletsPSSnapin
}
List Nutanix Cmdlets
Get-Command | Where-Object{$_.PSSnapin.Name -eq "NutanixCmdletsPSSnapin"}Connect To A Nutanix cluster
Connect-NutanixCluster -Server $server -UserName "myuser" -Password (Read-Host "Password: " -AsSecureString) -AcceptInvalidSSLCerts
Get Nutanix VMs Matching A Certain Search String
Set to variable
$searchString = "myVM"
$vms = Get-NTNXVM | where {$_.vmName -match $searchString}
Interactive
Get-NTNXVM | where {$_.vmName -match "myString"}Interactive and formatted
Get-NTNXVM | where {$_.vmName -match "myString"} | ftGet Nutanix vDisks
Set to variable
$vdisks = Get-NTNXVDiskInteractive
Get-NTNXVDiskInteractive and formatted
Get-NTNXVDisk | ftGet Nutanix Storage Containers
Set to variable
$containers = Get-NTNXContainerInteractive
Get-NTNXContainerInteractive and formatted
Get-NTNXContainer | ftGet Nutanix Protection Domains
Assign to variable
$pds = Get-NTNXProtectionDomainInteractive
Get-NTNXProtectionDomainInteractive and formatted
Get-NTNXProtectionDomain | ftGet Nutanix Consistency Groups
Set to variable
$cgs = Get-NTNXProtectionDomainConsistencyGroupInteractive
Get-NTNXProtectionDomainConsistencyGroupInteractive and formatted
Get-NTNXProtectionDomainConsistencyGroup | ftModern Applications and AI/ML
Cloud Native ServicesLearn about how Nutanix supports the development of cloud native workloads.
» Download this section as PDF (opens in a new tab/window)
The CNCF defines cloud native as “a set of technologies that empower organizations to build and run scalable applications in modern, dynamic environments such as public, private and hybrid clouds”. The primary technologies driving this shift to application modernization include containers, microservices, and Kubernetes.
Nutanix Cloud Infrastructure (NCI) is the ideal foundation for cloud-native workloads running on Kubernetes at scale. Nutanix provides platform mobility, allowing you to run workloads on your Nutanix private and public cloud. The Nutanix architecture was designed with hardware failures in mind, offering better resilience for Kubernetes platform components and application data. With the addition of each NCI node, you benefit from the scalability and resilience provided to the Kubernetes compute nodes. Equally important, an additional storage controller deploys with each HCI node, which results in better storage performance for your stateful containerized applications.
Nutanix Kubernetes Platform (NKP) is an enterprise-ready, cloud-native platform that simplifies Kubernetes management and deployment across various infrastructures, including cloud, multi-cloud, hybrid cloud, on-premises, edge, and air-gapped environments. NKP enables faster deployment of production-ready cloud-native environments and integrates with other Nutanix products like Nutanix Cloud Infrastructure (NCI), Nutanix Unified Storage, and Nutanix Database Service to deliver a consistent platform for containers and virtual machines across different cloud environments.
Note
Existing NKE Customers
Nutanix Kubernetes Engine (NKE) customers can migrate to Nutanix Kubernetes Platform (NKP) 2.12 or later. There will be no further NKE releases after 2.10.
NUS provides persistent and scalable software-defined storage to the Kubernetes clusters. These include block and file storage via the Nutanix CSI driver and S3-compatible object storage via the Nutanix COSI driver. Furthermore, with NDB, you can provision and operate databases at scale using the NDB Kubernetes Operator.
The following chapters will cover these in more detail:
» Download this section as PDF (opens in a new tab/window)
Nutanix Kubernetes Platform (NKP) provides a consistent experience for deploying and managing Kubernetes clusters at scale across on-premises, edge locations, and public cloud environments.
This platform meets developers’ demands by providing pure upstream, open-source Kubernetes with strategically selected best-of-breed infrastructure applications, which are critical for running Kubernetes in a production environment. View all out-of-the-box applications.
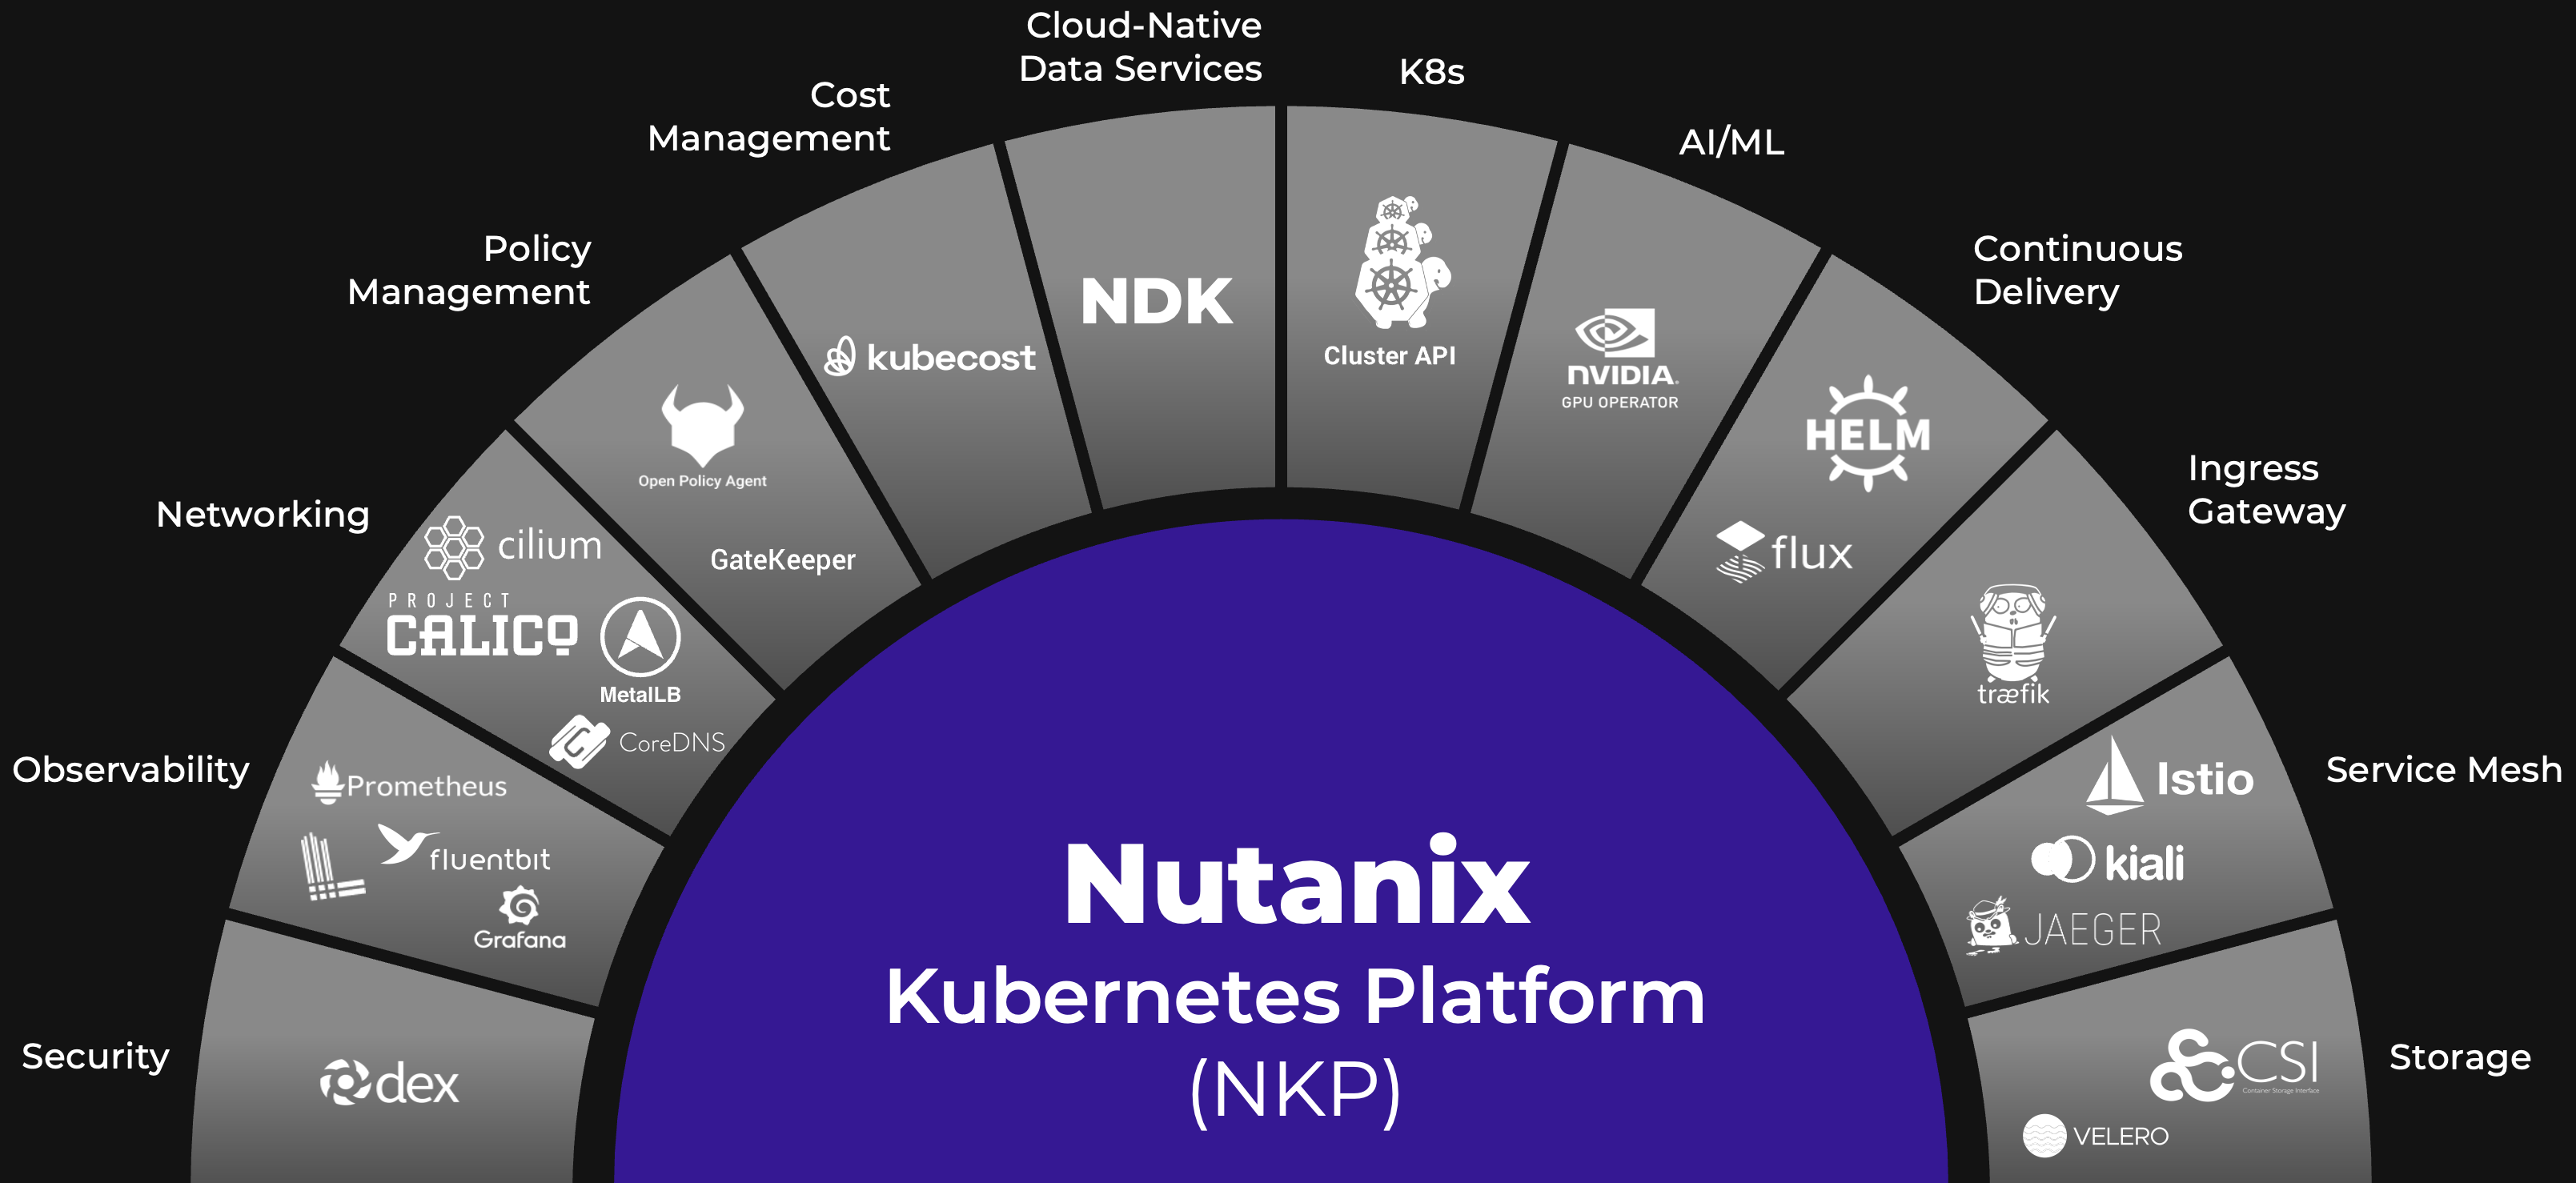
Supported Configurations
The solution applies to the configurations below:
Core Use Case(s):
- Containers
- Microservices
- GenAI frameworks
- Application modernization
- Edge computing
- Commercial off-the-shelf products
Supported Environments:
- Nutanix
- vSphere
- Public Clouds (AWS, Azure, and GCP)
- Pre-provisioned (bare metal and VMs)
Locations:
- On-premises
- Public cloud
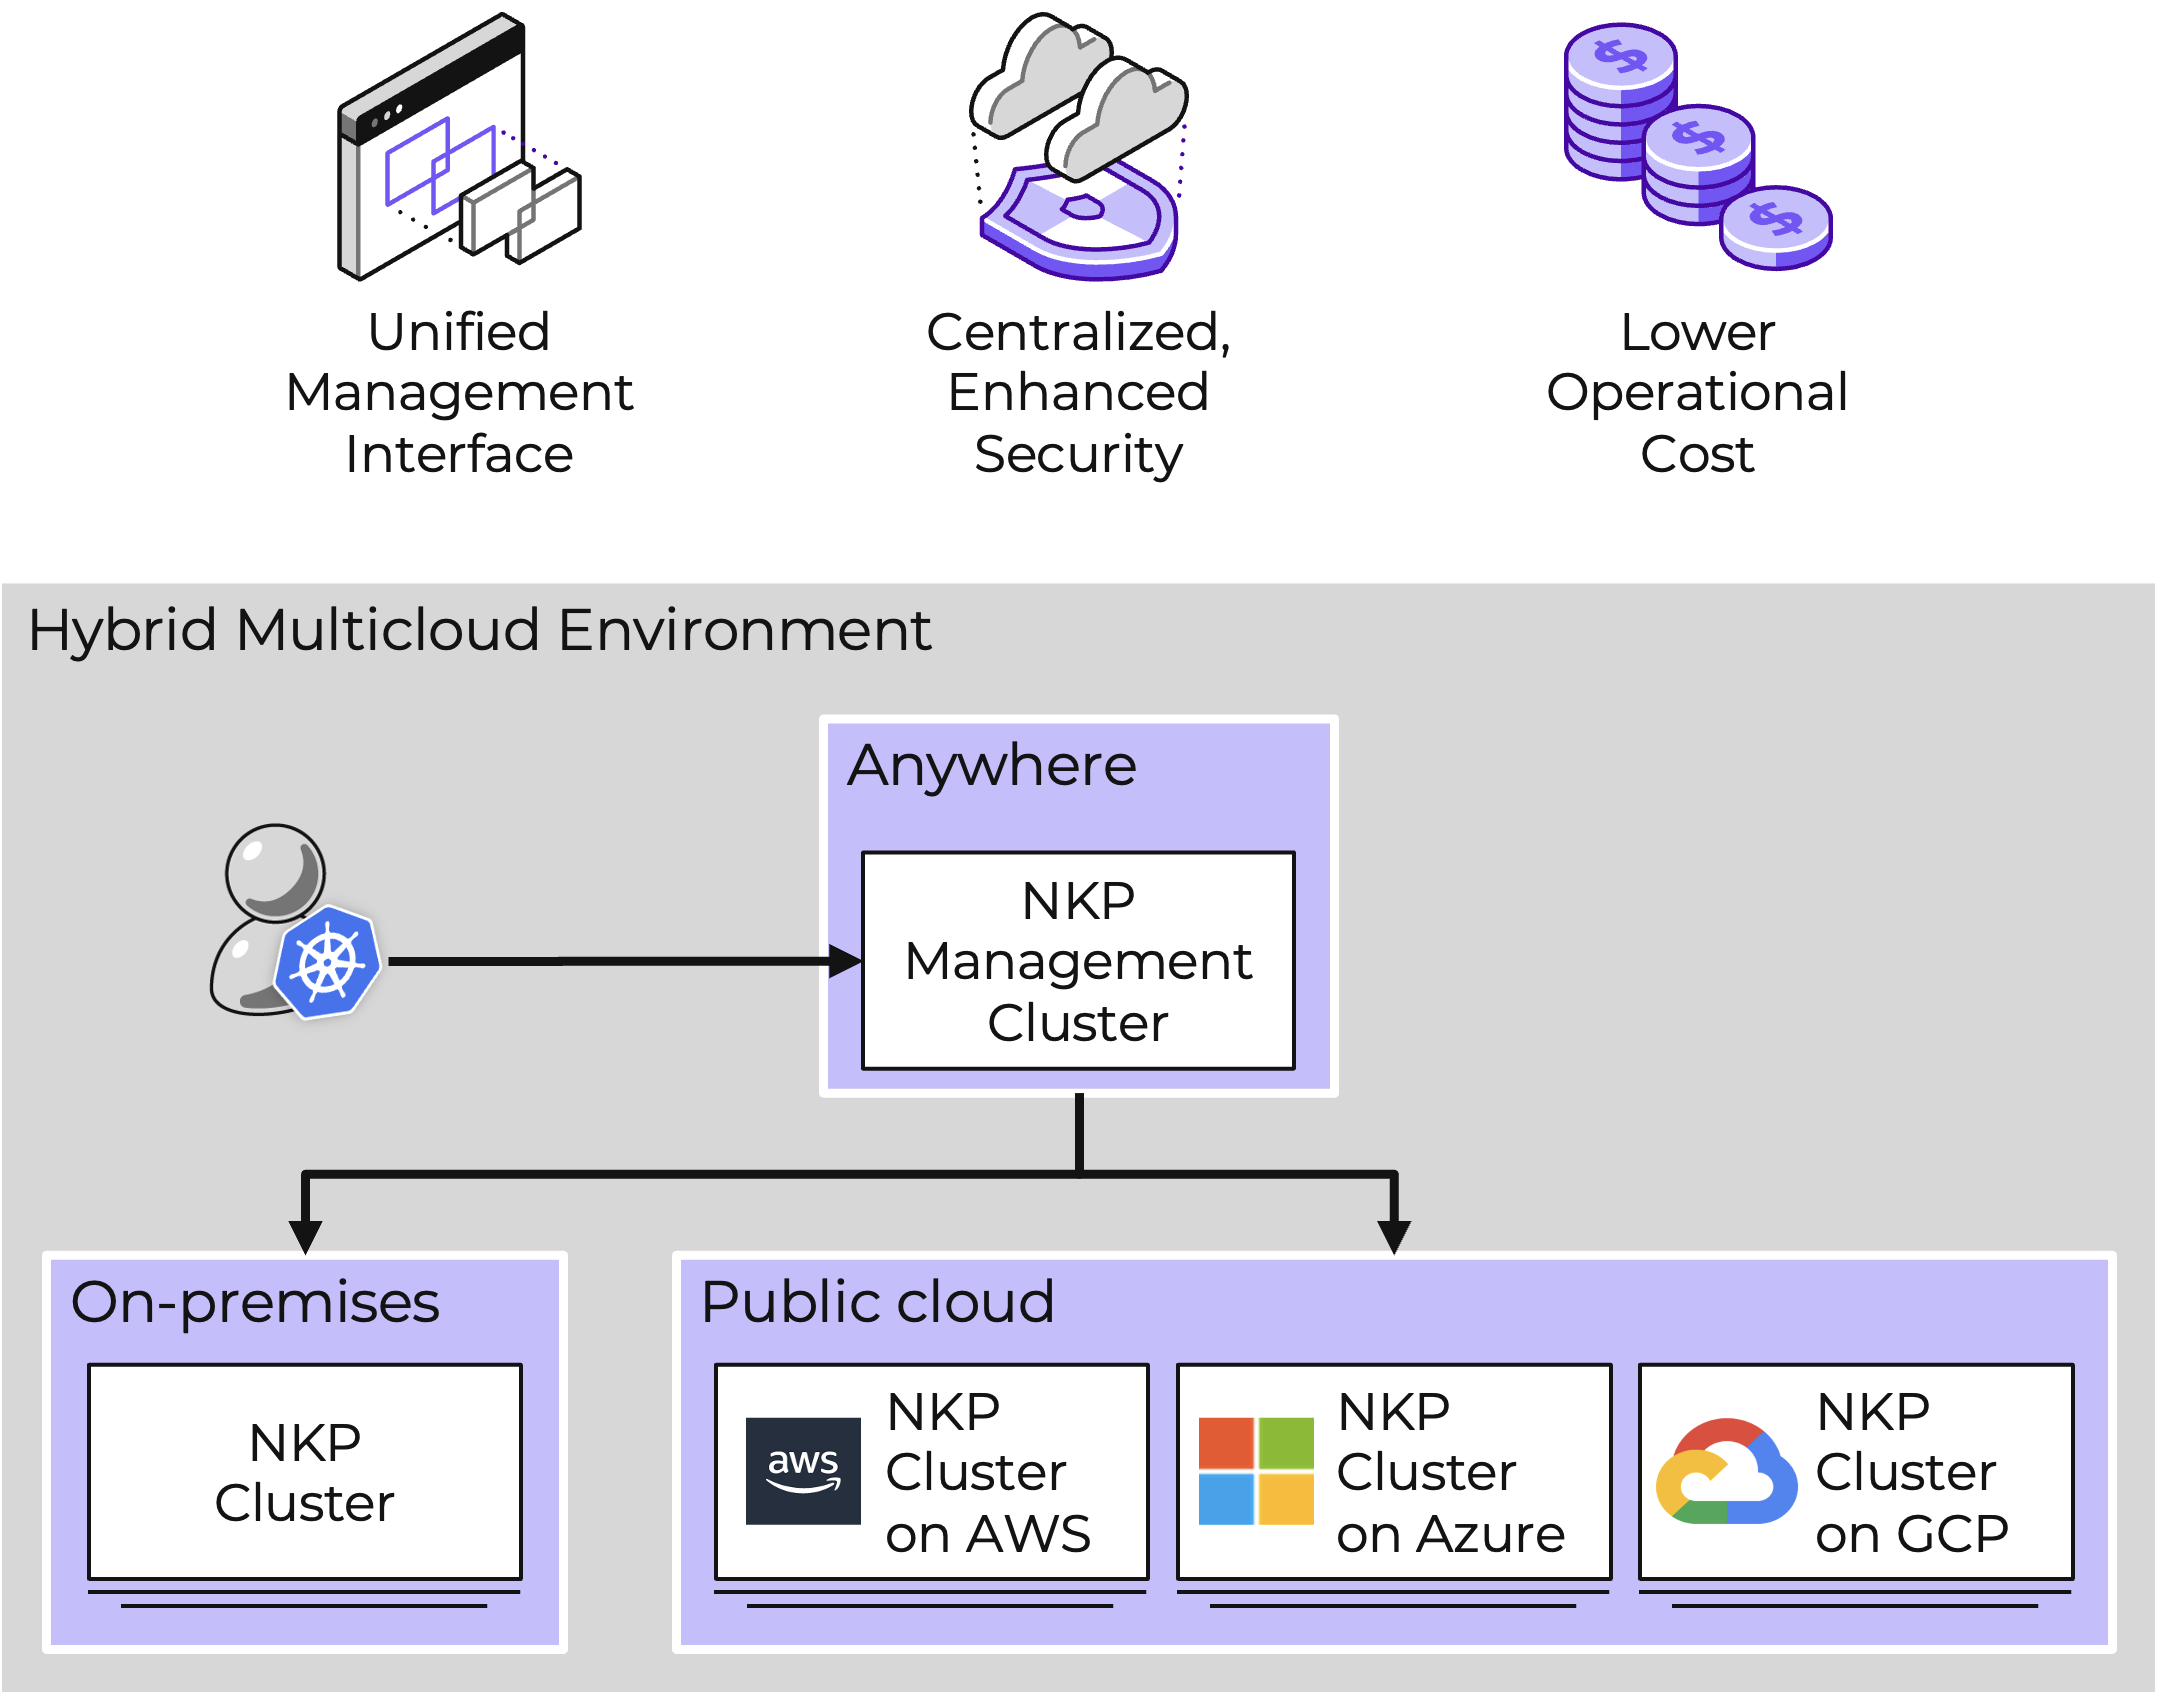
Supported OS image(s):
- Rocky Linux, Ubuntu, Flatcar, Bring Your Own Image (BYOI), view list of supported images
Management interfaces(s):
- NKP UI
- NKP CLI
- kubectl
Upgrades:
- NKP CLI
Compatible Features:
- Multi-cluster lifecycle operations
- Built-in multi-tenancy
- GitOps
- Autoscaling & self-healing
- Customizable observability and logging dashboards
- GPU operator support
- AI-assisted chatbot
- Application catalog
- Cost management
Air-gapped Environments:
NKP supports air-gapped deployments, enabling organizations to run production Kubernetes in secure, isolated environments. This includes on-premises and cloud-based air-gapped environments.
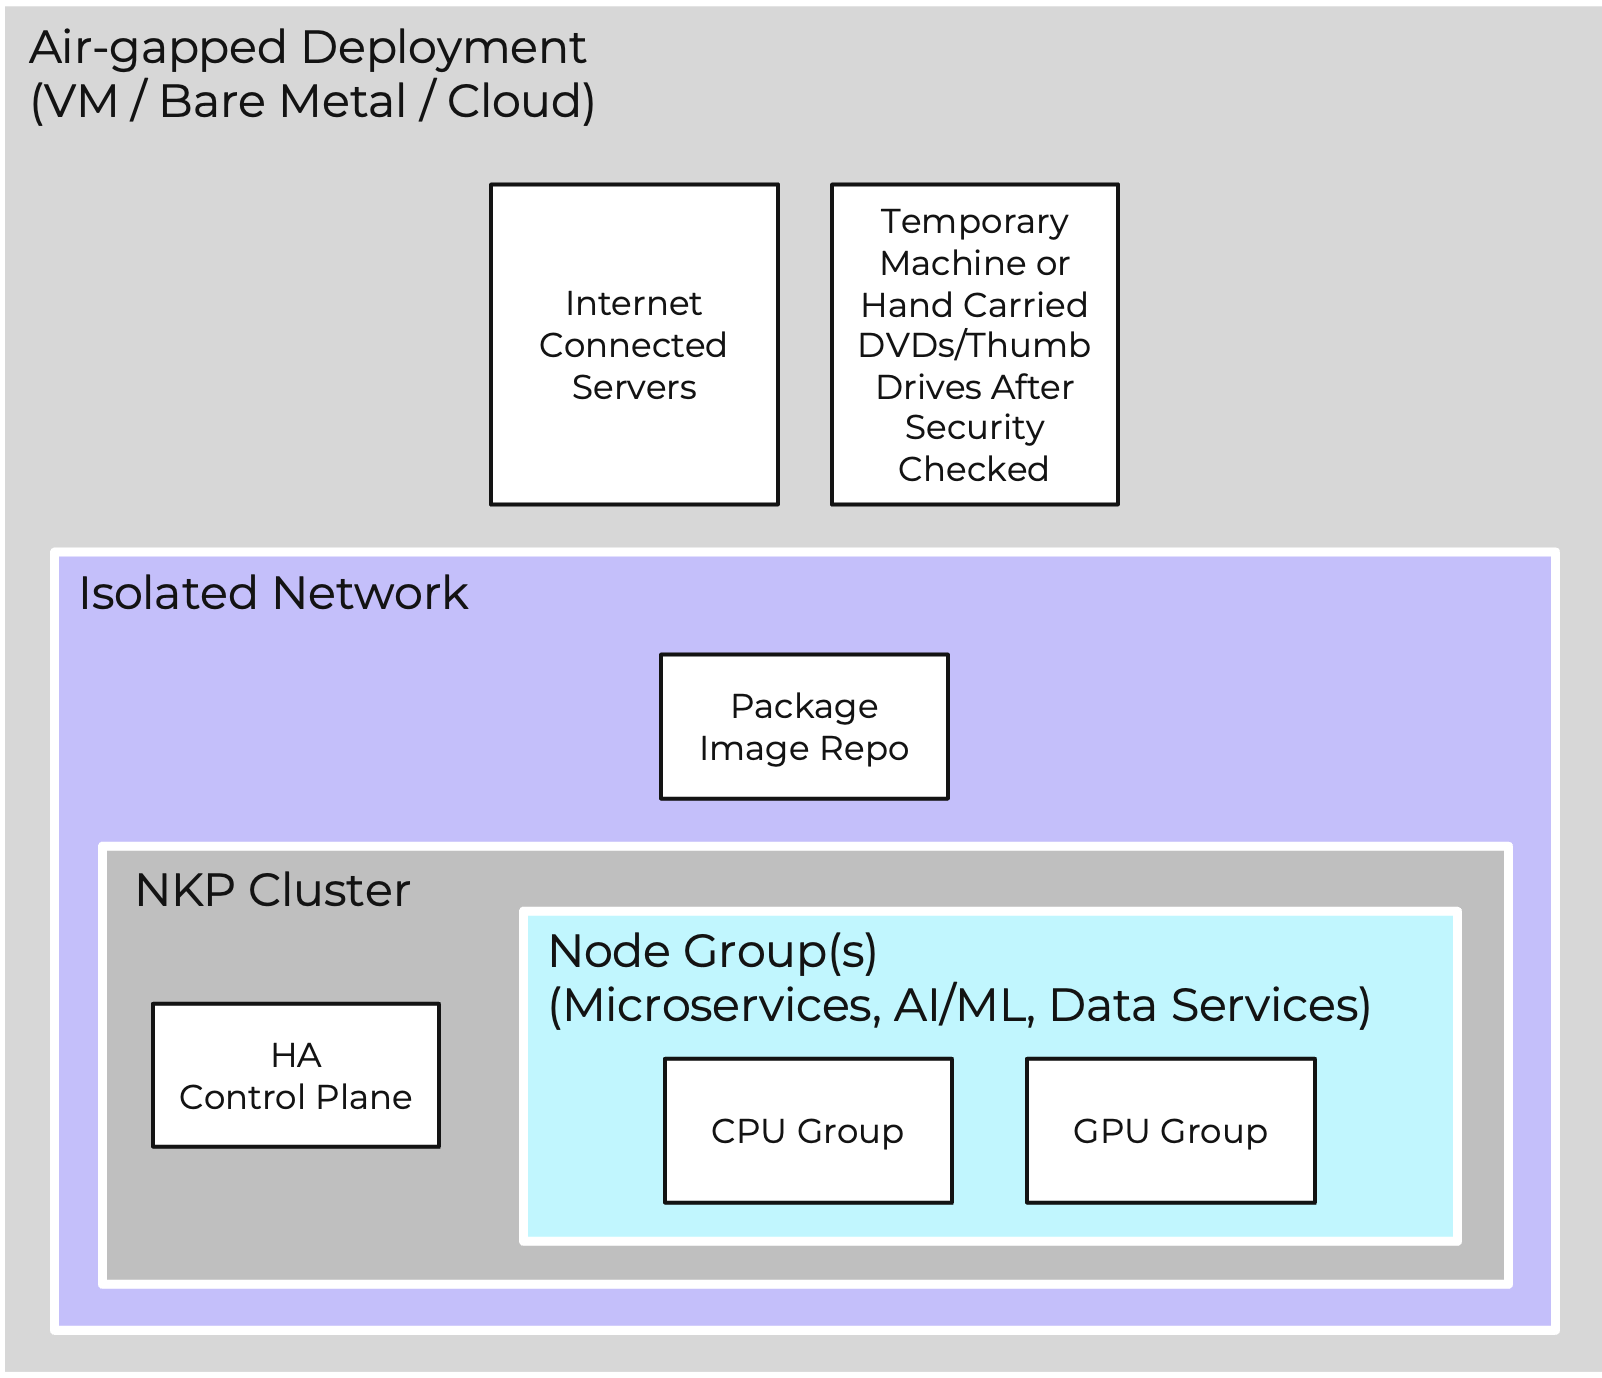
Cluster Types
NKP can be deployed as a single self-managed cluster or in a multi-cluster architecture. The different cluster types for these two environments are:
- Management Cluster hosts NKP, is self-managed, and manages other clusters.
- Managed Clusters are NKP-created workload clusters fully managed by the NKP Management cluster.
- Attached Clusters are externally created workload clusters connected to NKP for application management.
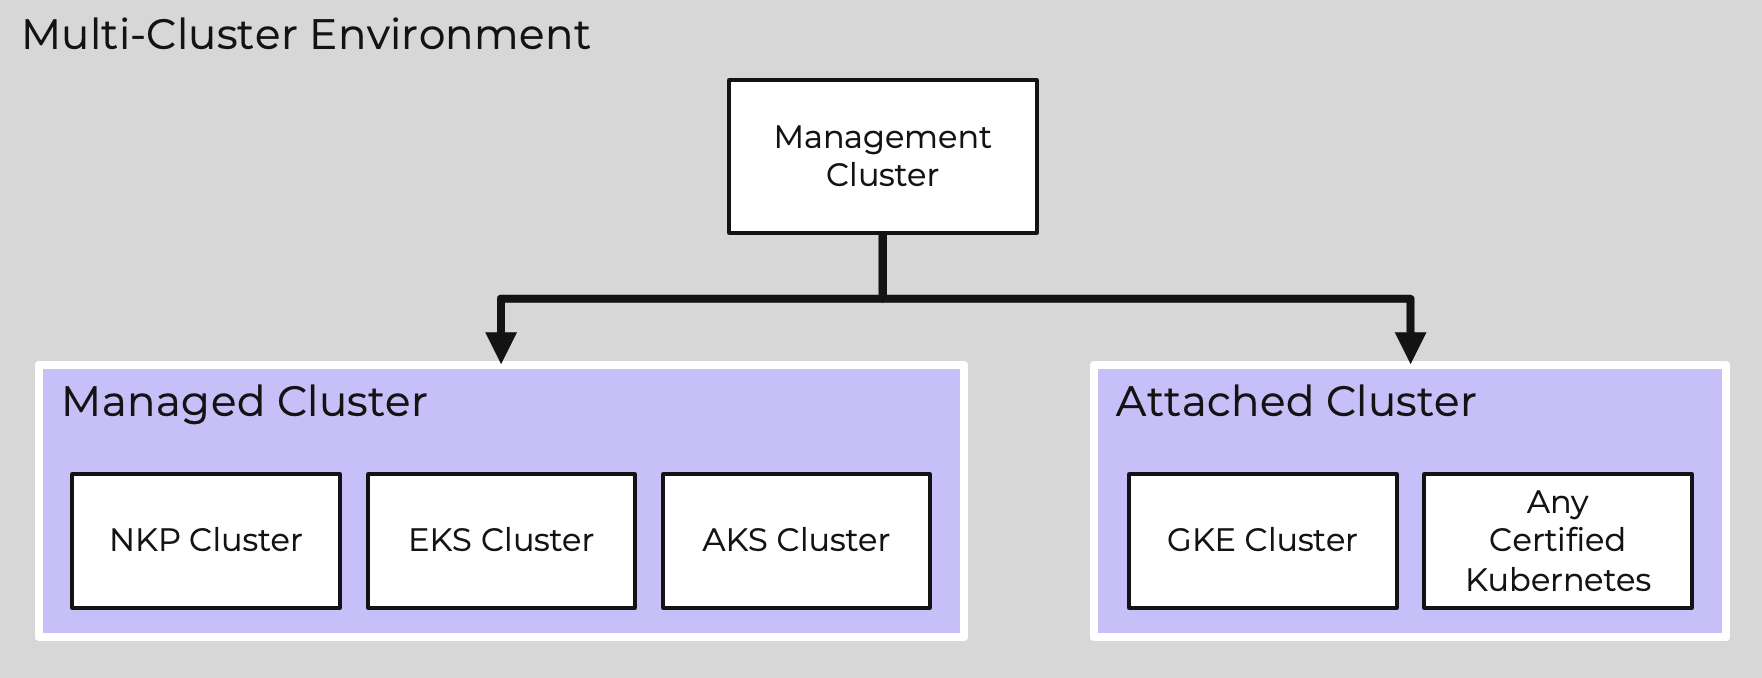
Hybrid Cloud Fleet Management
NKP Fleet Management simplifies Kubernetes cluster management across on-prem, cloud, and edge environments, providing security, visibility, automation, and governance features to ensure consistency and security. It also enables centralized management of clusters allocated to different departments or lines of business through Workspaces.
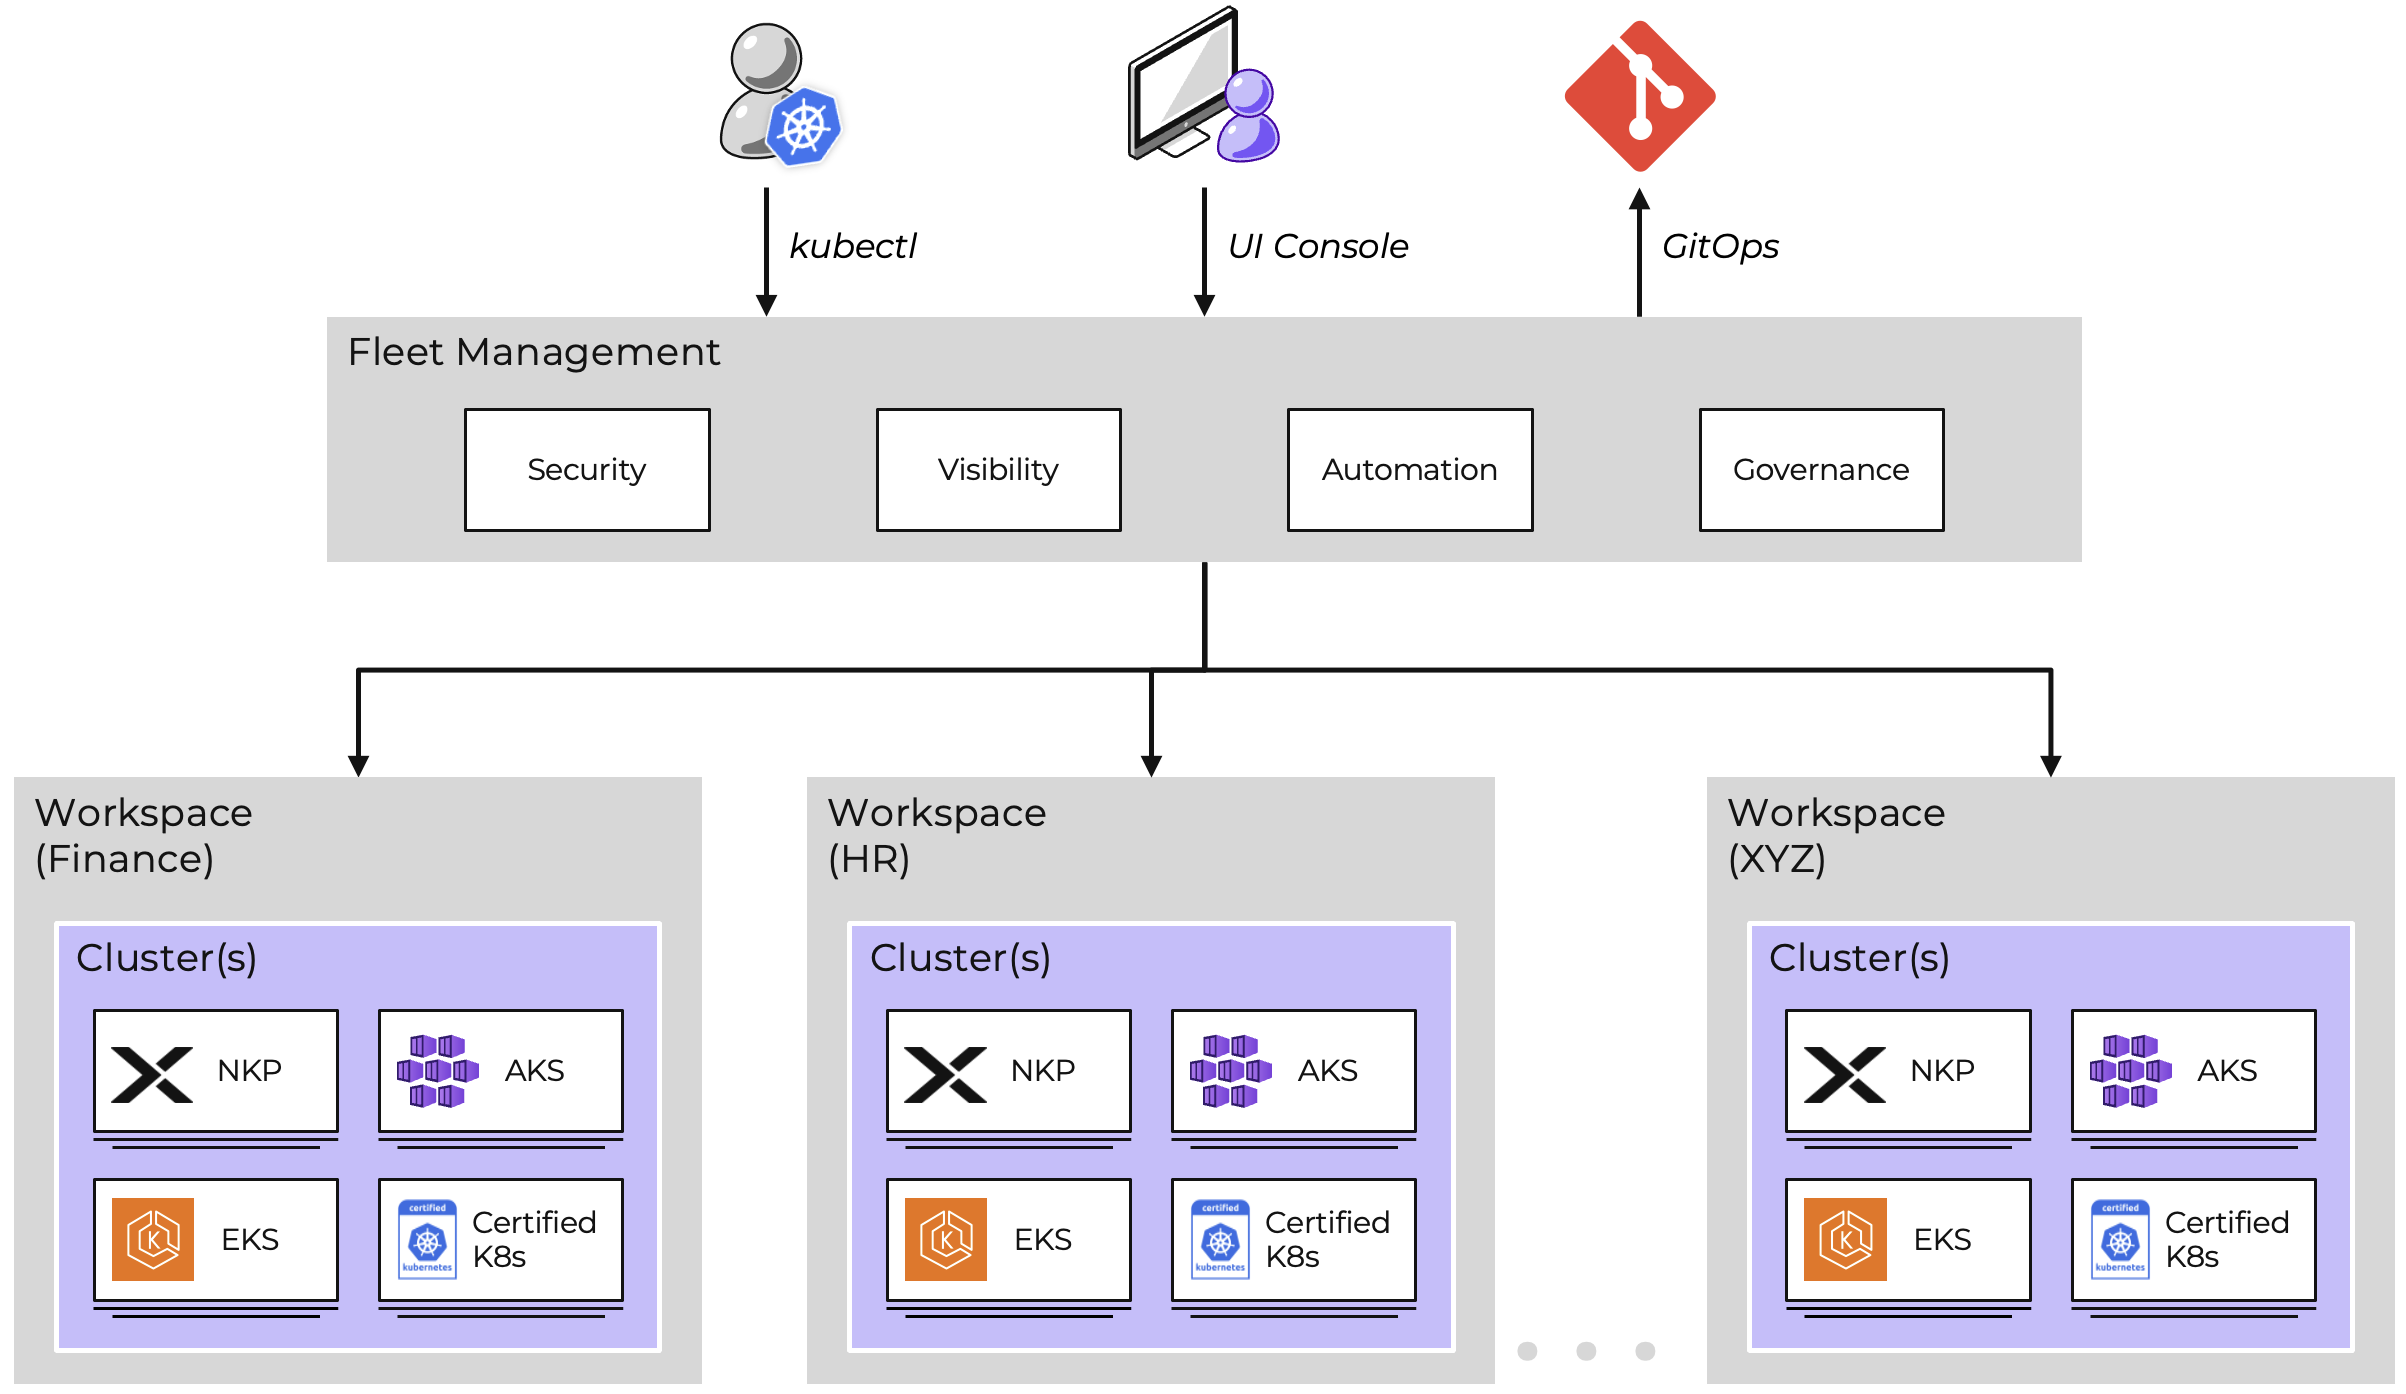
Architecture
The Nutanix Kubernetes Platform (NKP) architecture consists of several key components.
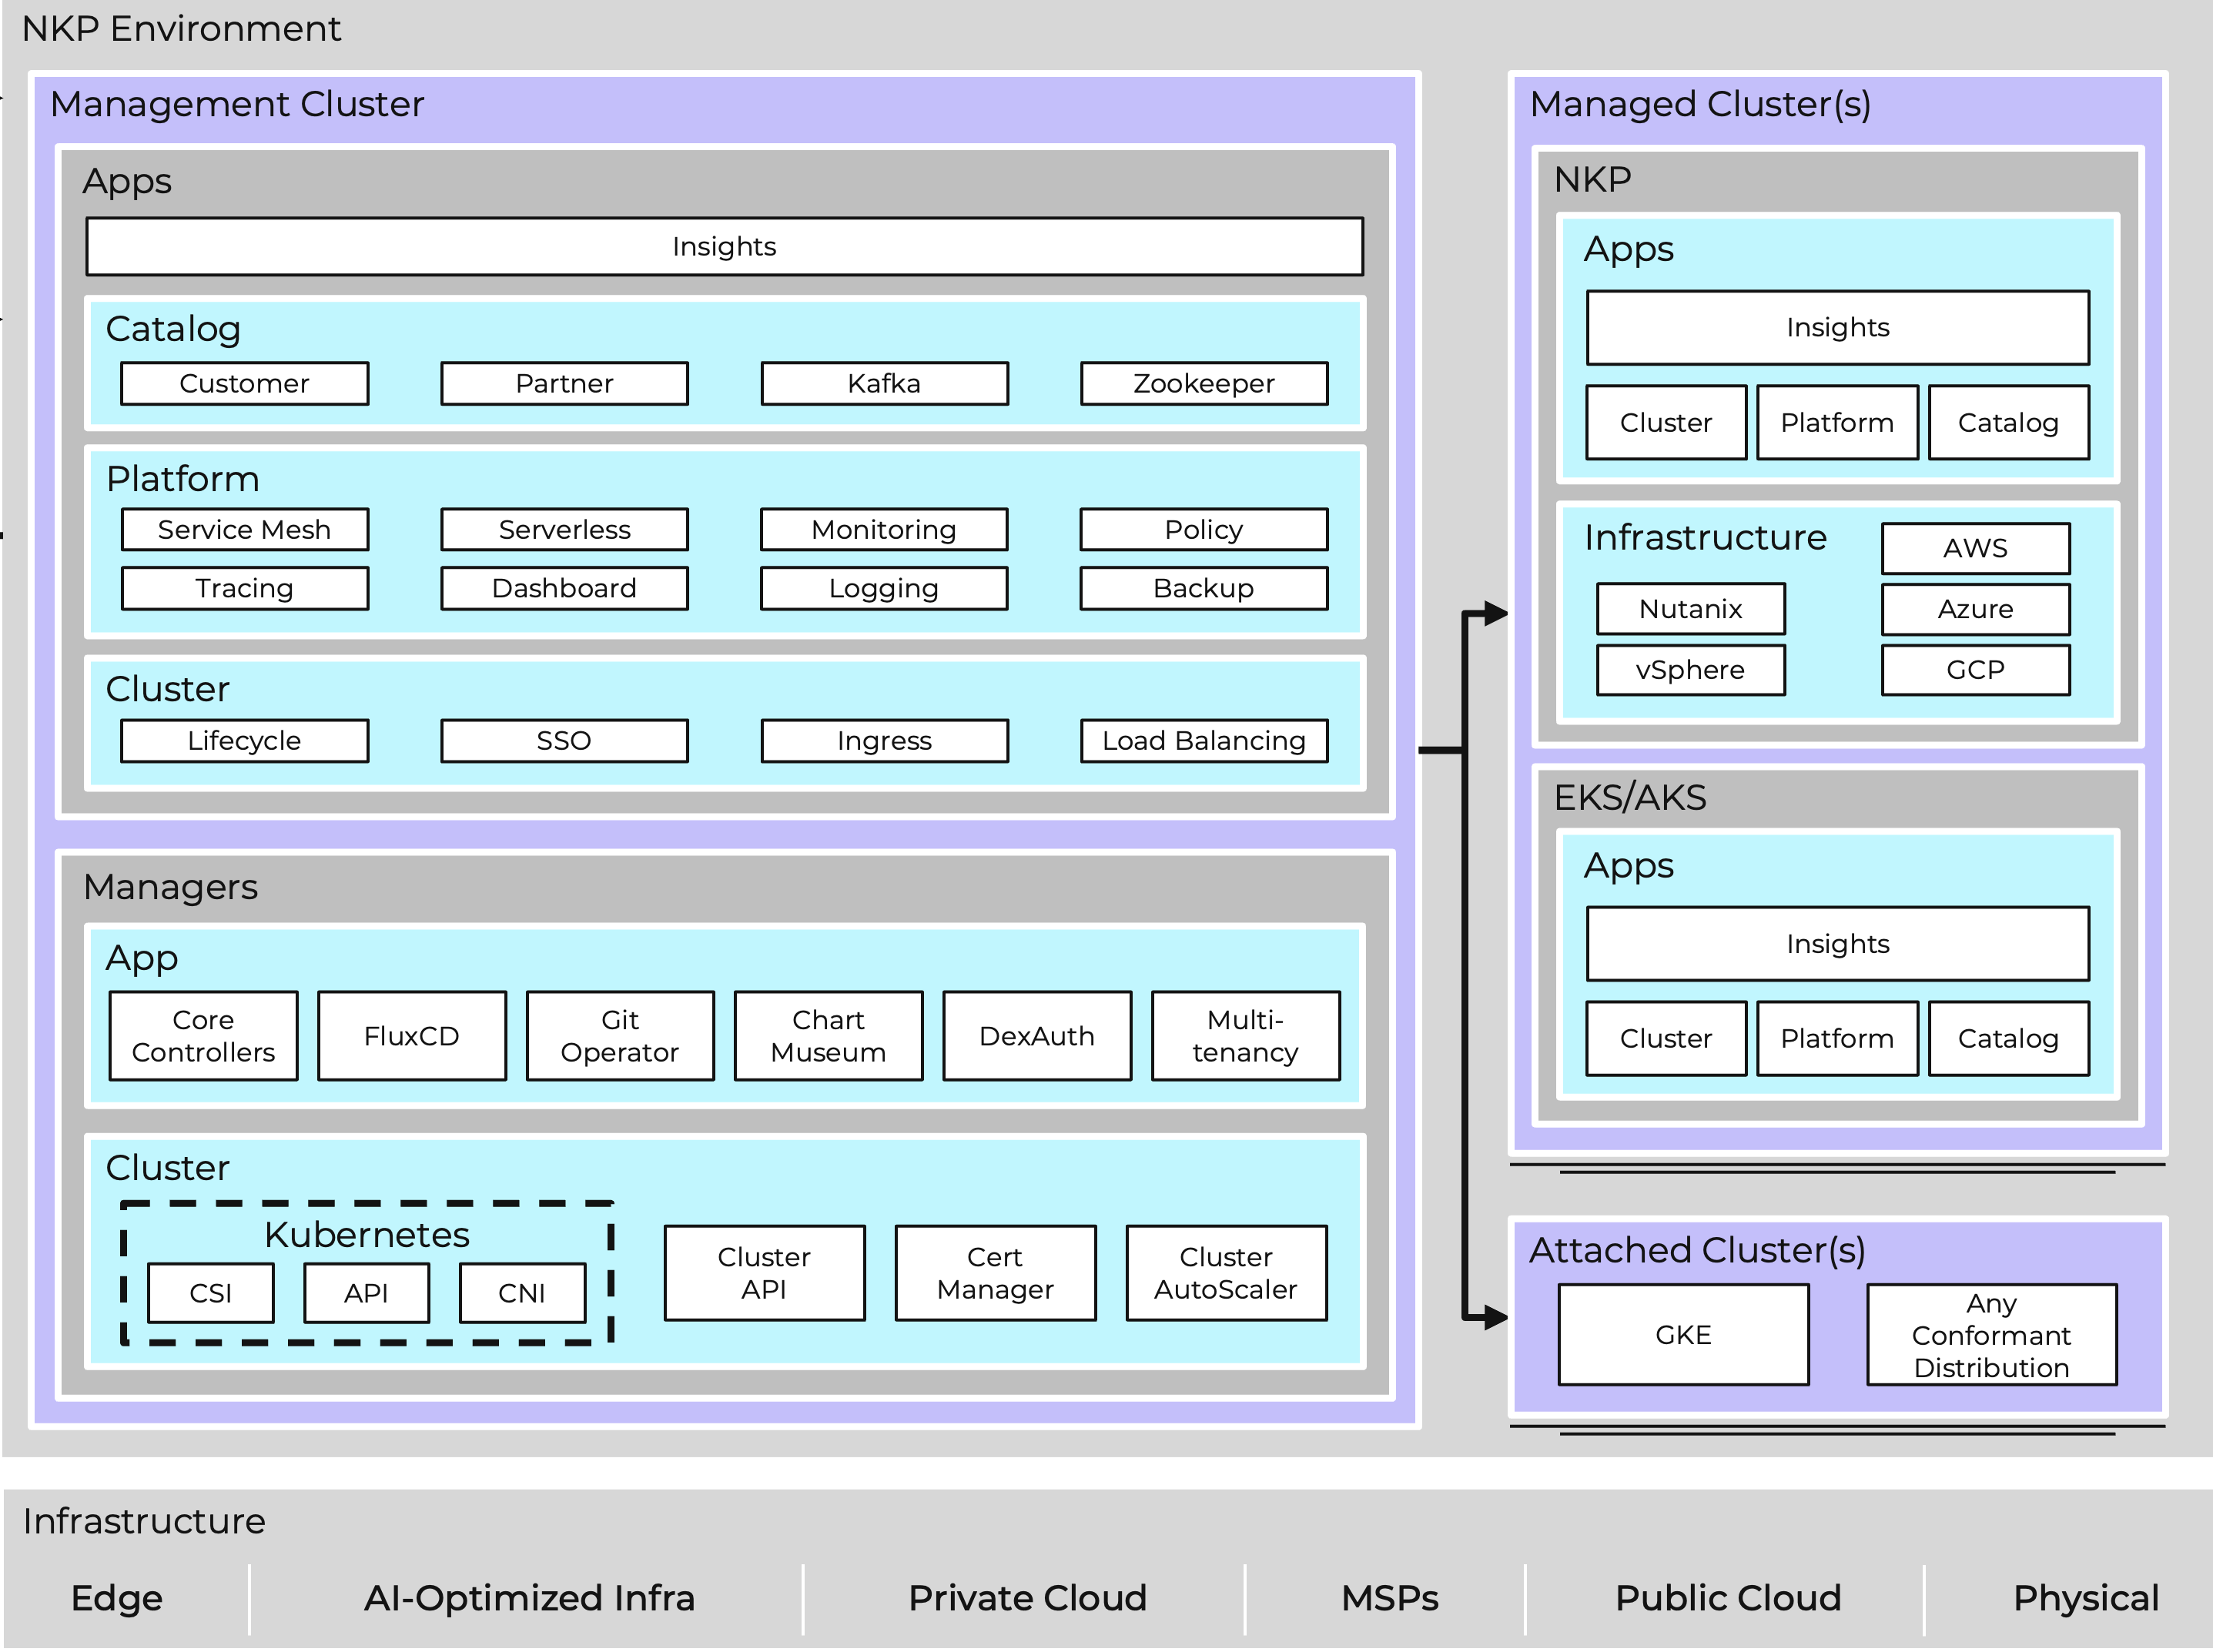
Management Cluster
The management cluster serves as the central hub for NKP operations. It hosts the managers, which are controllers responsible for managing cluster and application operations.
- Cluster Managers are responsible for managing the lifecycle of clusters. The primary controller is the Cluster API controller, which supports the lifecycle management of Kubernetes clusters.
- Application Managers handle environment-level integrations such as authentication, authorization, and other tasks.
Key Components
Cluster API
Cluster API (CAPI) is a crucial component of NKP, providing a standardized way to manage the lifecycle of Kubernetes clusters. It offers:
- Automated cluster lifecycle management, including creation, scaling, upgrading, and deletion.
- Provides a consistent API across multiple environments, supporting hybrid and multicloud strategies.
- Eliminates the need for custom scripts and automation, reducing complexity and improving reliability.
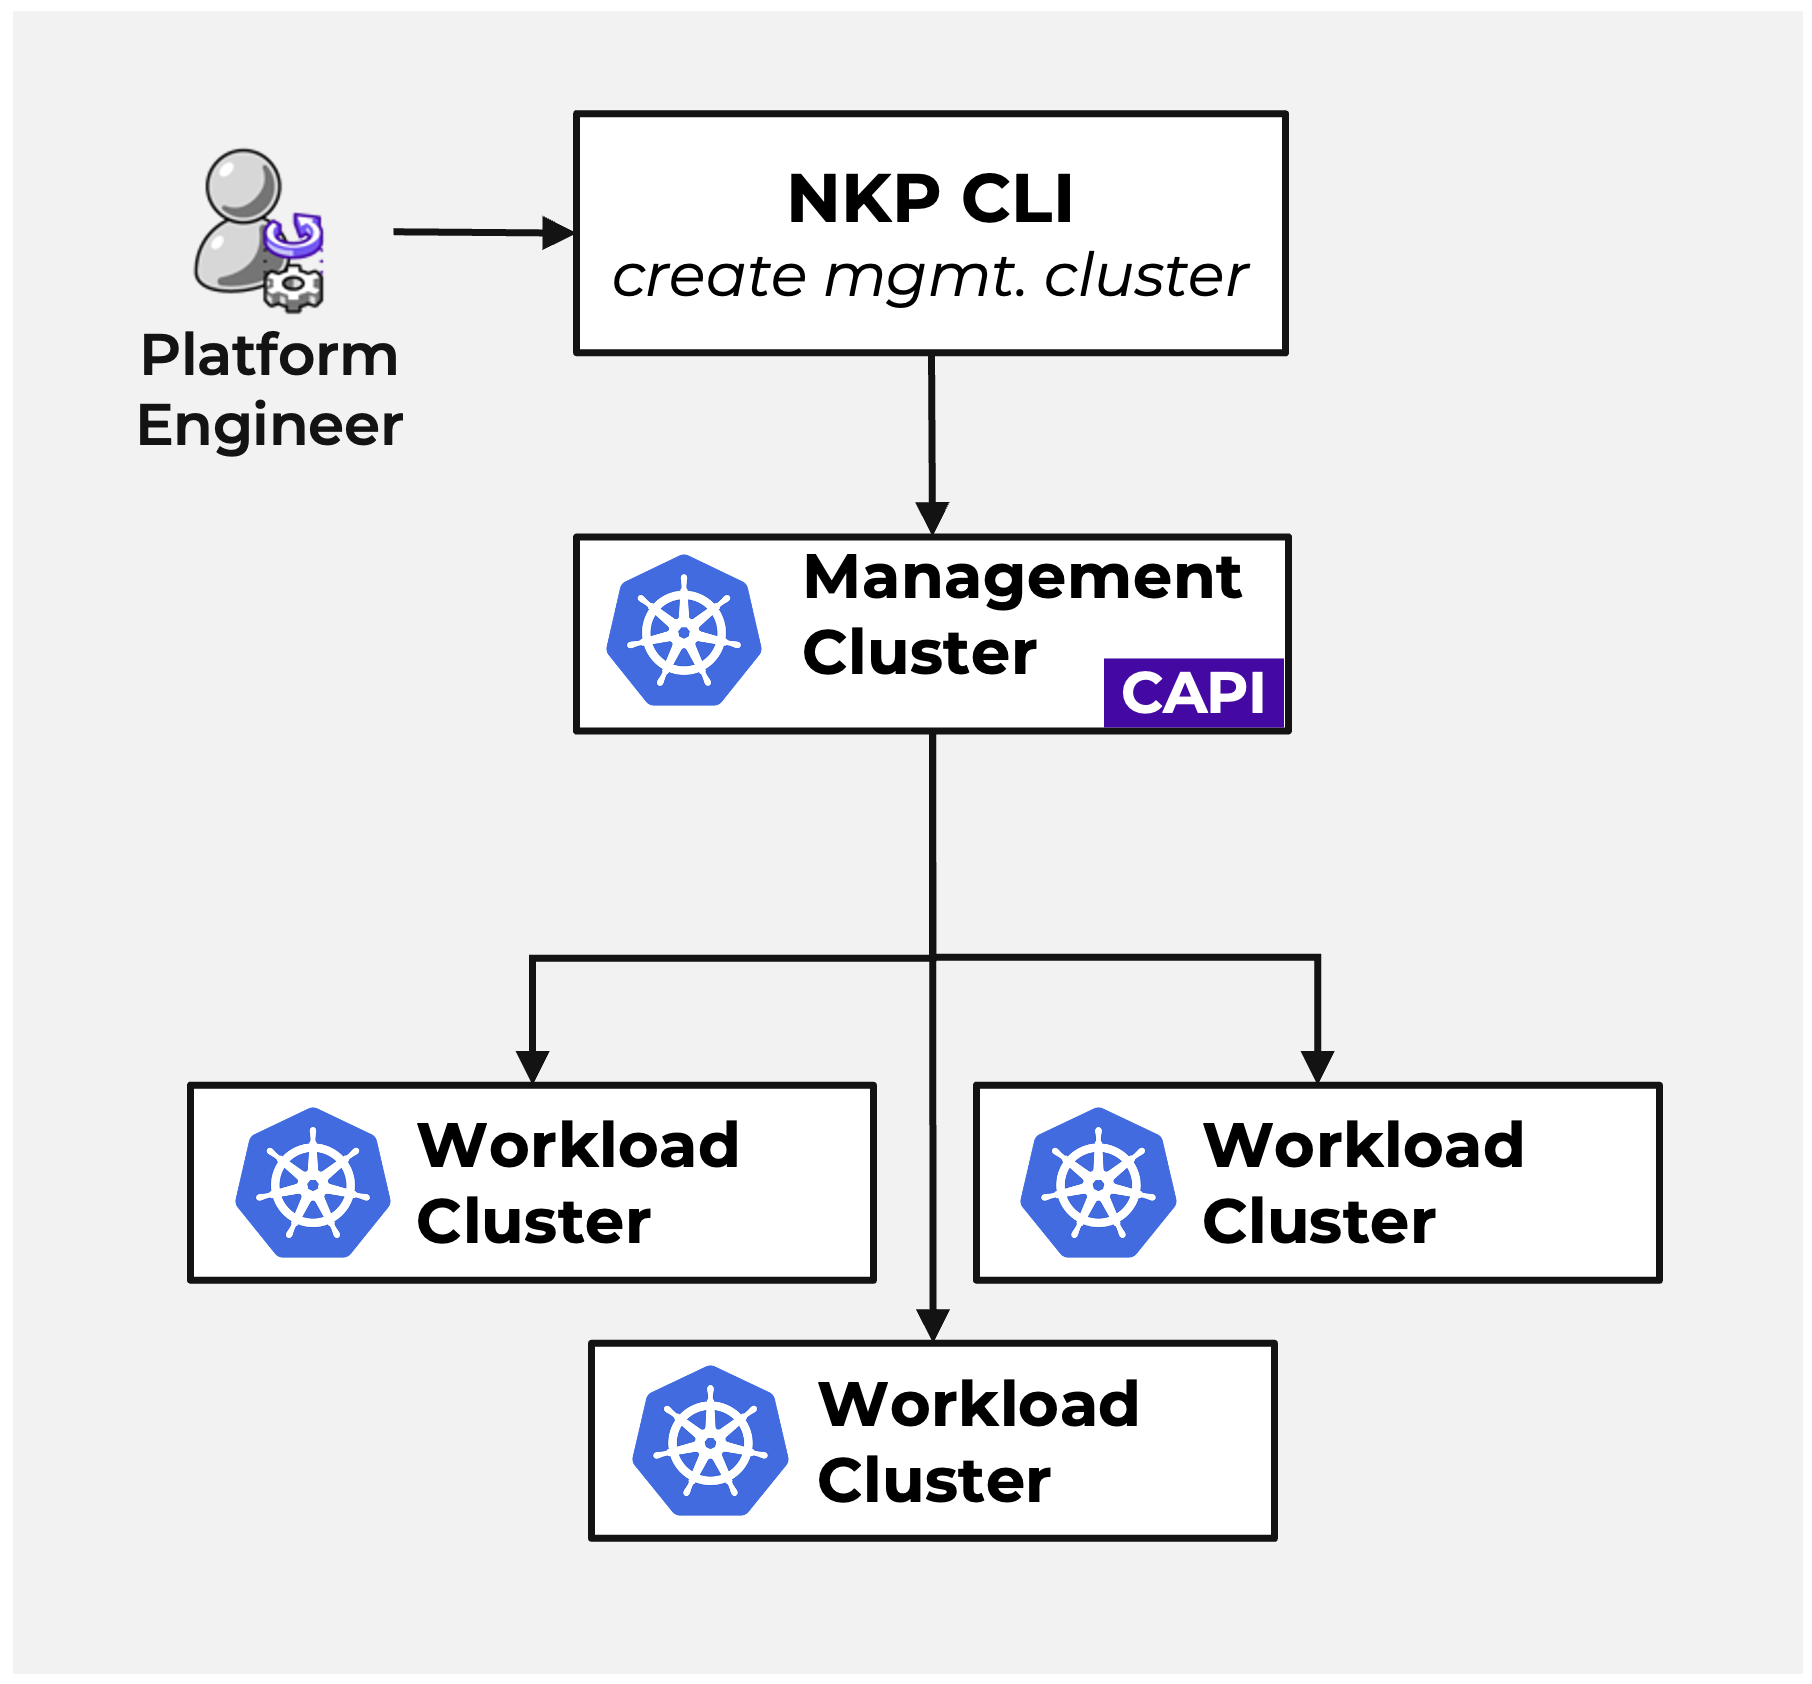
Networking and Storage
- NKP supports two container network interface (CNI) providers for network connectivity between containers: Cilium and Calico.
- Container Storage Interface (CSI): Provides standardized, persistent container storage management.
Security and RBAC
- Out-of-the-box SSO support with LDAP, SAML, OIDC, and GitHub.
- Granular RBAC at workspaces and projects level.
Cluster Services
Cluster Lifecycle Management
NKP Cluster Lifecycle Management (LCM) reduces operational burden and enhances cluster reliability and efficiency.
- Easy Cluster Upgrades.
- Built-in Cluster Autoscaler that scales In/Out clusters based on demand.
- Self-Healing Cluster Resiliency.
Load Balancing and Ingress
Load Balancing
- Built-in load balancer for on-premises installations such as MetalLB.
- Leverages native cloud provider load balancers when running in the cloud.
Layer 7 Service Routing (Ingress)
- NKP uses Traefik for Layer 7 service routing for HTTP traffic, allowing granular traffic management based on URL paths or headers.
Platform Services
Observability
NKP provides full-stack observability by monitoring, tracking, and analyzing your entire Kubernetes infrastructure and application stack using:
Grafana
Data visualization solution for metrics and logs with different dashboard options: built-in, custom, and community.
Prometheus
A monitoring and alerting toolkit that collects and stores metrics. It is designed for cloud-native environments and provides real-time monitoring and alerting capabilities to ensure operational stability and prompt issue resolution.
Thanos
Extension to Prometheus that aggregates its data and provides a highly available metrics platform with long-term storage capabilities.
Data Services
Nutanix Data for Kubernetes (NDK)
NDK enhances data protection and management capabilities using:
- Asynchronous Replication for stateful applications without impacting primary environment performance.
- Comprehensive Application Packaging.
- Lowering the RTO for efficient business operations.
Velero
Velero, an open-source tool included with NKP, provides:
- Disaster Recovery: Enables quick restoration of applications to a known good state.
- Data Migration: Version upgrades, Workload relocation, and Environment transitions.
- Data Protection: Scheduled backups and retention policies.
NKP Insights
The NKP Insights Engine collects events and metrics on your Kubernetes clusters to detect potential anomalies of varying criticality.
For more information on the Nutanix Kubernetes Platform, check out the following resources:
- Take Nutanix Kubernetes Platform for a Test Drive.
- Watch the experts talking about platform capabilities at .NEXT 2024.
» Download this section as PDF (opens in a new tab/window)
The Nutanix Cloud Platform is an ideal solution for running any certified Kubernetes distribution. Nutanix brings an enterprise-class platform with all the resources needed to successfully run your modern applications at scale.
Kubernetes distributions require compute, network, and storage. With Nutanix, these resources are easily accessible to IT administrators and developers to run their preferred Kubernetes distributions. Several leading Kubernetes distribution providers have certified their solutions for use with Nutanix including Red Hat OpenShift, Google Anthos, and several others. View our supported partner software solutions online on the Nutanix support portal.
Kubernetes architecture
All Kubernetes distributions have a base architecture with the following components at a minimum:
- etcd - the key-value store for storing all Kubernetes cluster configuration data, state data, and metadata.
- Kubernetes control plane - this includes the Kubernetes API server and other components for scheduling pods and detecting and responding to cluster events.
- Kubernetes worker nodes - Machines that host the application workloads.

In addition, these components run on all Kubernetes control plane and worker nodes.
- Kubelet
- Kube-proxy
- Container runtime
Detailed information on these components can be found in the Kubernetes documentation.
Red Hat OpenShift Container Platform
There are multiple supported installation methods for OpenShift Container Platform on Nutanix.
OCP is available from the Nutanix Marketplace to be deployed and consumed directly as an application.
From OCP 4.11 and onwards, the full stack automated installer-provisioned infrastructure method is available.
From OCP 4.12 and onwards, the Assisted Installer method is also supported.
In addition, the Nutanix CSI Operator that provides persistent storage is readily available from the OpenShift OperatorHub.
The Nutanix Validated Design for OpenShift on Nutanix is available, which is a joint validation of software, hardware and services. These are complete designs that undergone in-depth functional and scale tests to meet enterprise requirements. These solutions’ modularity and pre-built nature ensure that they can be easily used in production.
Amazon EKS-A
EKS Anywhere is an enterprise-class solution for deploying Kubernetes clusters on premises with simplified cluster creation and integrated 3rd party software. The Nutanix Cloud Platform and the AHV hypervisor provide supported infrastructure for EKS-A.
Cluster API Provider Nutanix (CAPX)
Cluster API is a Kubernetes sub-project that brings declarative, Kubernetes-style APIs to cluster creation and management. Nutanix provides an implementation of Cluster API for Nutanix Cloud Infrastructure known as CAPX. The Nutanix CSI driver is fully supported on CAPI/CAPX clusters.
Google Anthos
Google Anthos can be deployed on the Nutanix Cloud Infrastructure running Nutanix AHV hypervisor using the Anthos clusters on bare metal installation method.
Rancher
Rancher’s Kubernetes management tool can manage any Kubernetes cluster running on Nutanix. Rancher also supports provisioning Rancher Kubernetes Engine (RKE) clusters on the Nutanix platform.
After activating Rancher’s built-in Nutanix node driver and creating a node template from it, the RKE cluster can be provisioned with node pools.
Kubermatic
With the Nutanix and Kubermatic partnership, Nutanix is a supported infrastructure provider for the Kubermatic Kubernetes Platform.
Enterprise AILearn how Nutanix can help you implement Generative AI in your organization.
» Download this section as PDF (opens in a new tab/window)
With the birth of ChatGPT in 2022, Generative AI has taken the world by storm. Many industries are exploring how they can use Generative AI to drive business goals and gain efficiencies. This is known as Enterprise AI.
Desired outcomes from Enterprise AI include productivity gains, revenue growth, and value creation. The potential to drive these outcomes is inspiring organizations everywhere to implement Enterprise AI in their own organizations.
Successful Enterprise AI requires answers to key questions:
- Which AI models should we use/are we using?
- Which parts of our business are adopting Generative AI?
- How do we scale our infrastructure and operations to meet GenAI demand?
Let’s take a closer look at Enterprise AI and how organizations can find answers to these key questions.
» Download this section as PDF (opens in a new tab/window)
Key Use Cases of Enterprise AI
Key use cases include:
- Creating Better Security
- Build on traditional AI capabilities like fraud detection and threat monitoring by using generative AI to enable more adaptive threat simulations, automate incident response, and generate realistic data for training and testing security systems.
- Accelerating Code & Content Creation
- Enable code co-pilots, intelligent document processing, and fine-tuned models trained on domain-specific data to significantly accelerate the development of software and the generation of high-quality content.
- Supercharging the Customer Experience
- Leverage advanced analytics to understand customer feedback, deploy personalized chatbots, and deliver tailored interactions that drive deeper engagement and satisfaction.
Challenges with Enterprise AI
Typical challenges implementing Enterprise AI include:
- Not knowing where to begin
- The necessary skillsets are still evolving, making it challenging to find and hire qualified talent.
- Ensuring that intellectual property and data stay secure and private
- While public cloud solutions are easy to deploy, they may not always meet requirements for data sovereignty and security.
- Needing help to get a working solution
- Application developers and IT teams often have distinct expertise and requirements, so a platform that supports both groups is essential.
Building an Enterprise AI platform
Building an Enterprise AI platform involves integrating multiple components and technologies to ensure scalability, reliability, and performance.
- Private AI Cloud Infrastructure
- AI-Ready Storage
- Kubernetes
- Vector Databases
- AI Platform for Inferencing & Agents
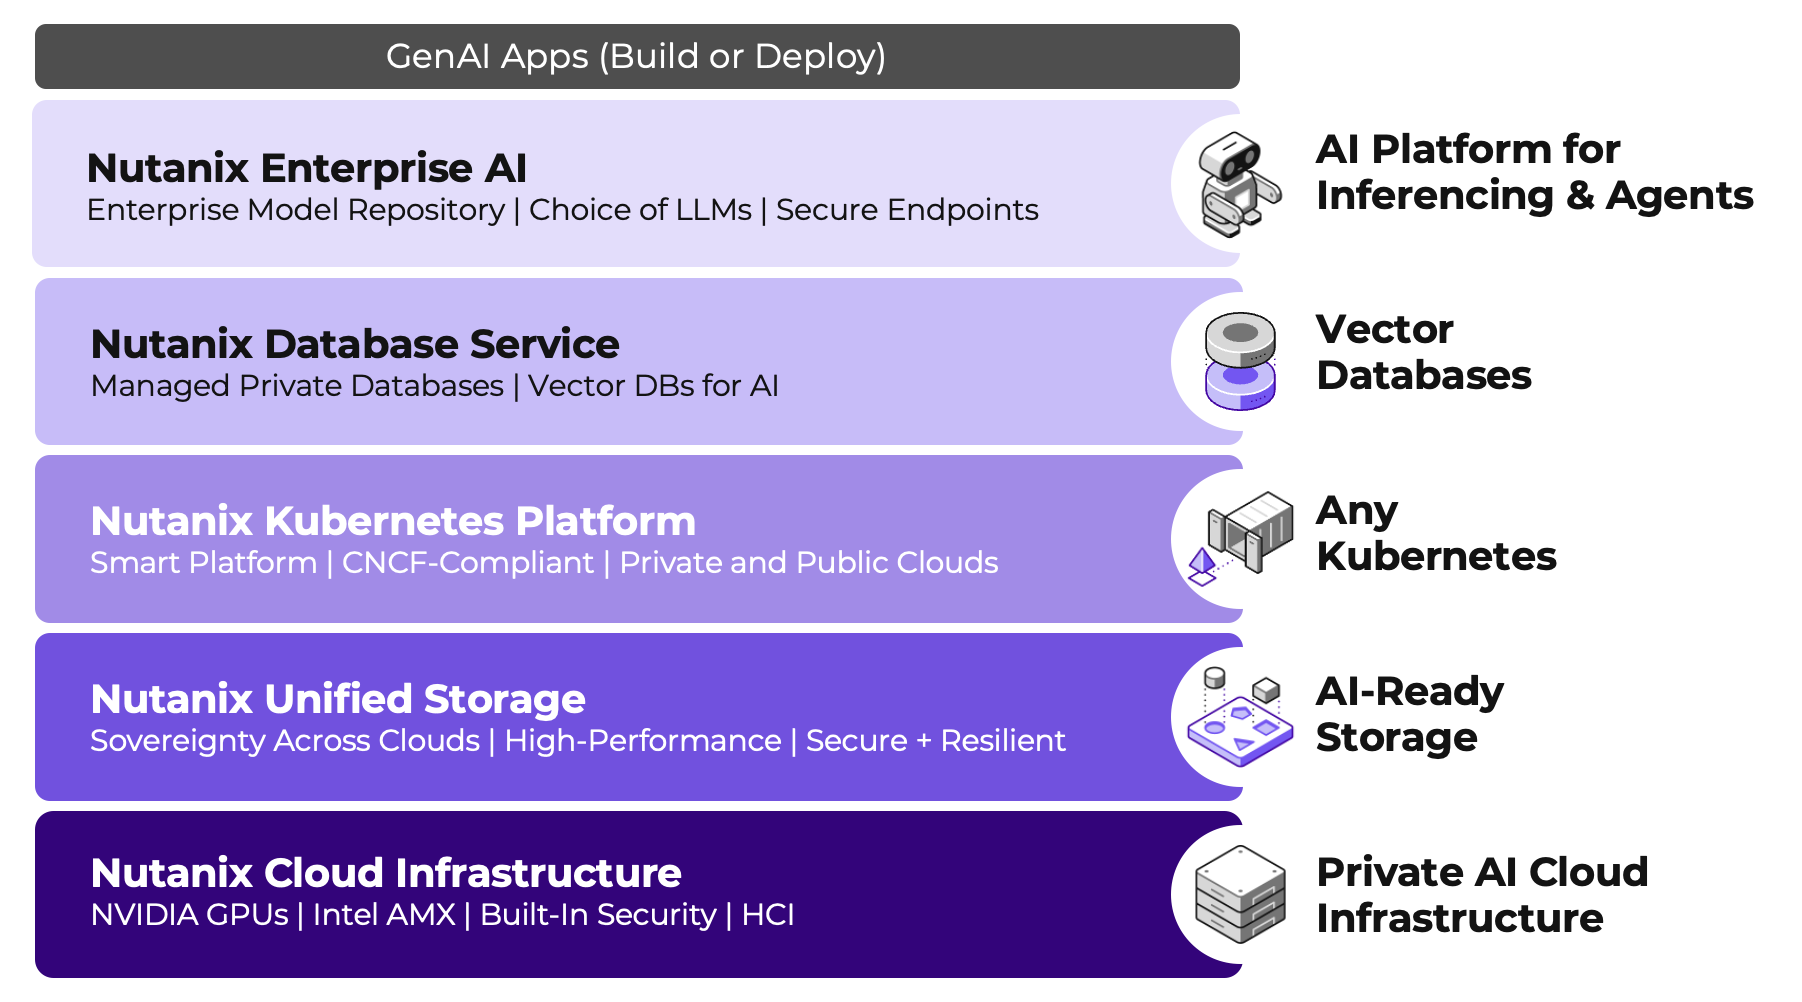
Nutanix Enterprise AI
Nutanix Enterprise AI is a Kubernetes application that enables the AI platform component of the Enterprise AI stack and enables IT organizations to manage and deploy LLMs and inference endpoints. Nutanix Enterprise AI can be deployed on:
- Nutanix Kubernetes Platform
- Amazon EKS
- Azure AKS
- Google Cloud GKE
How Nutanix Enterprise AI works
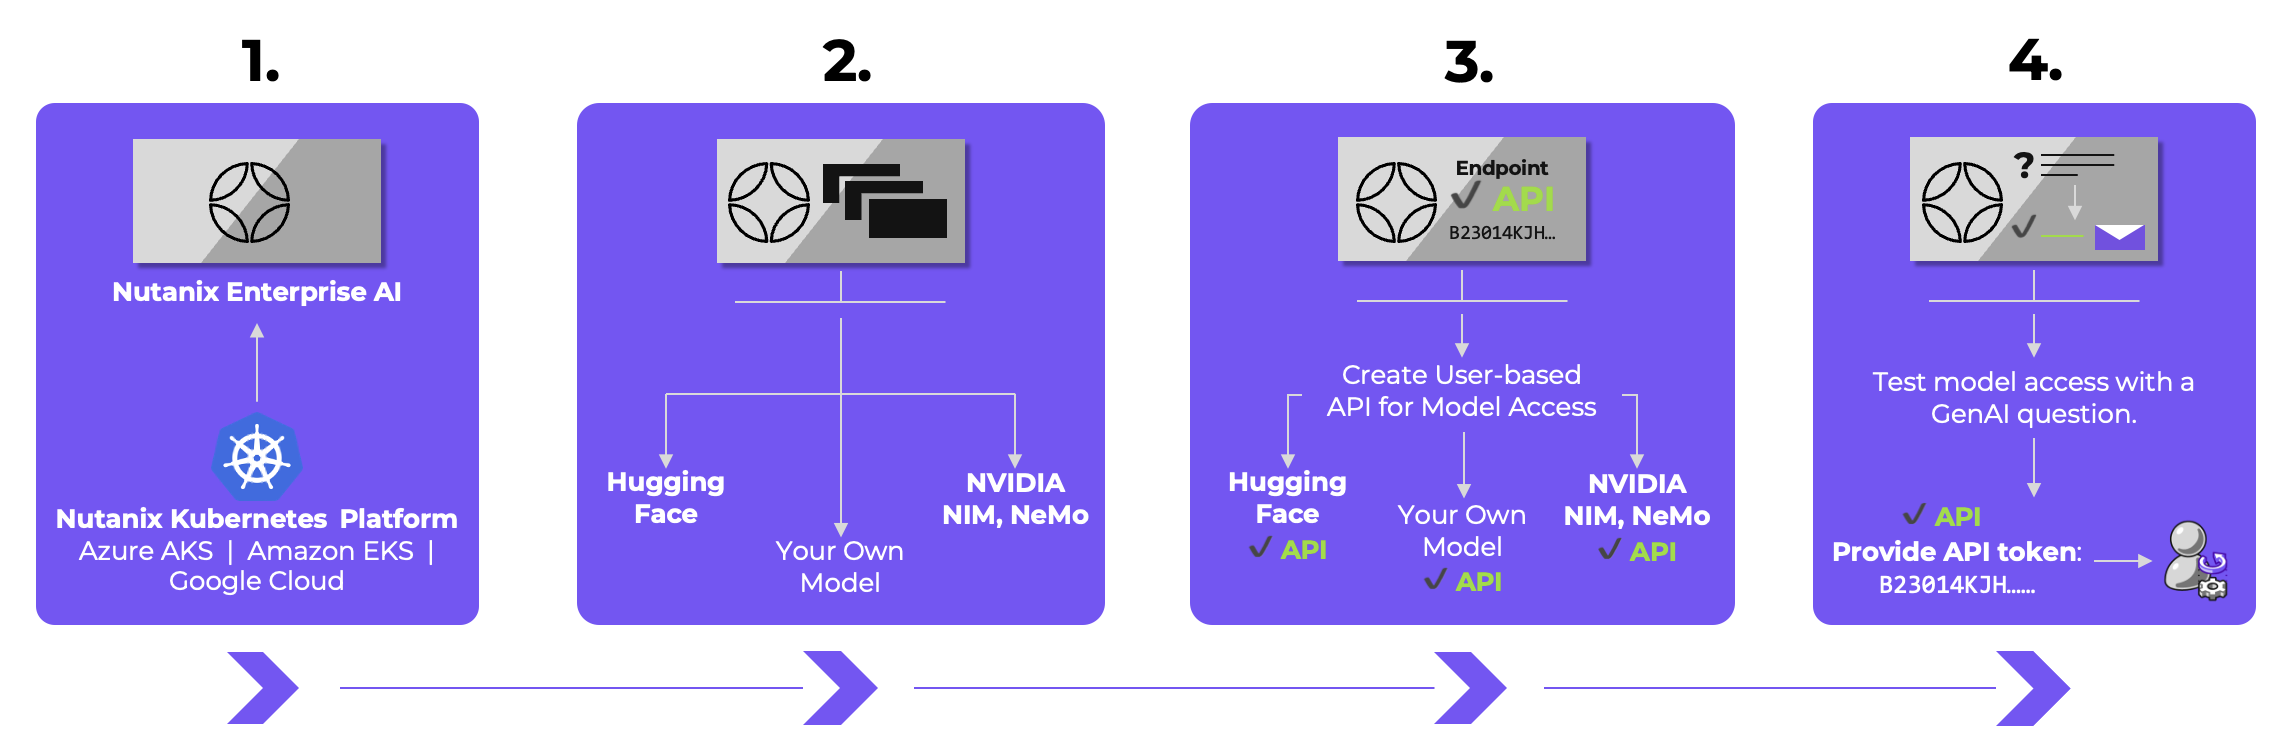
- Deploy and run Nutanix Enterprise AI on Kubernetes.
- Login to the interface and deploy your choice of LLM from Hugging Face, NVIDIA, or import your own custom model.
- Create a secure endpoint and API key.
- Test the model directly from the UI before sending the token to the application developer or data scientist.
Then, monitor and manage the endpoint usage, infrastructure, events, and other metrics for understanding how the organization is using AI and troubleshoot any issues.
Nutanix Enterprise AI Key Features
- Elegant user interface
- Choice of AI Models (LLMs) from Hugging Face or NVIDIA NIM, including Text Generation, Safety, Embedding, Reranker, and Vision models
- Upload Your Own AI Models (LLMs)
- API Token Creation and Management
- Partner API Token Management for Hugging Face and NVIDIA NIM
- API Code Samples
- Role-Based Access Controls (RBAC)
- AI Model Preflight Testing
- AI Model and API Monitoring
- Kubernetes Resource Monitoring
- GPU Usage Monitoring
- Event Auditing
- Integrated Nutanix Pulse Reporting
- Export Metrics with OpenTelemetry
- Hibernate and Resume Endpoints
Example Use Case - Retrieval Augmented Generation
Open source LLMs, such as Meta’s Llama, are pre-trained on vast amounts of data from the internet, but may not know anything about your own organization. For example, if you asked about your next company holiday, it might know about national holidays, but not holidays specific to your organization. That’s where Retrieval Augmented Generation (RAG) comes in.
A crucial part of RAG is the document store and vector database. The typical workflow involves ingesting documents from file or object storage, processing them with a function that splits and embeds the content, and then storing these embeddings in a vector database. Both open source and commercial tools are available to streamline this process.
Once your documents have been embedded, the end-user workflow of a RAG-enabled chatbot looks similar to the below diagram.
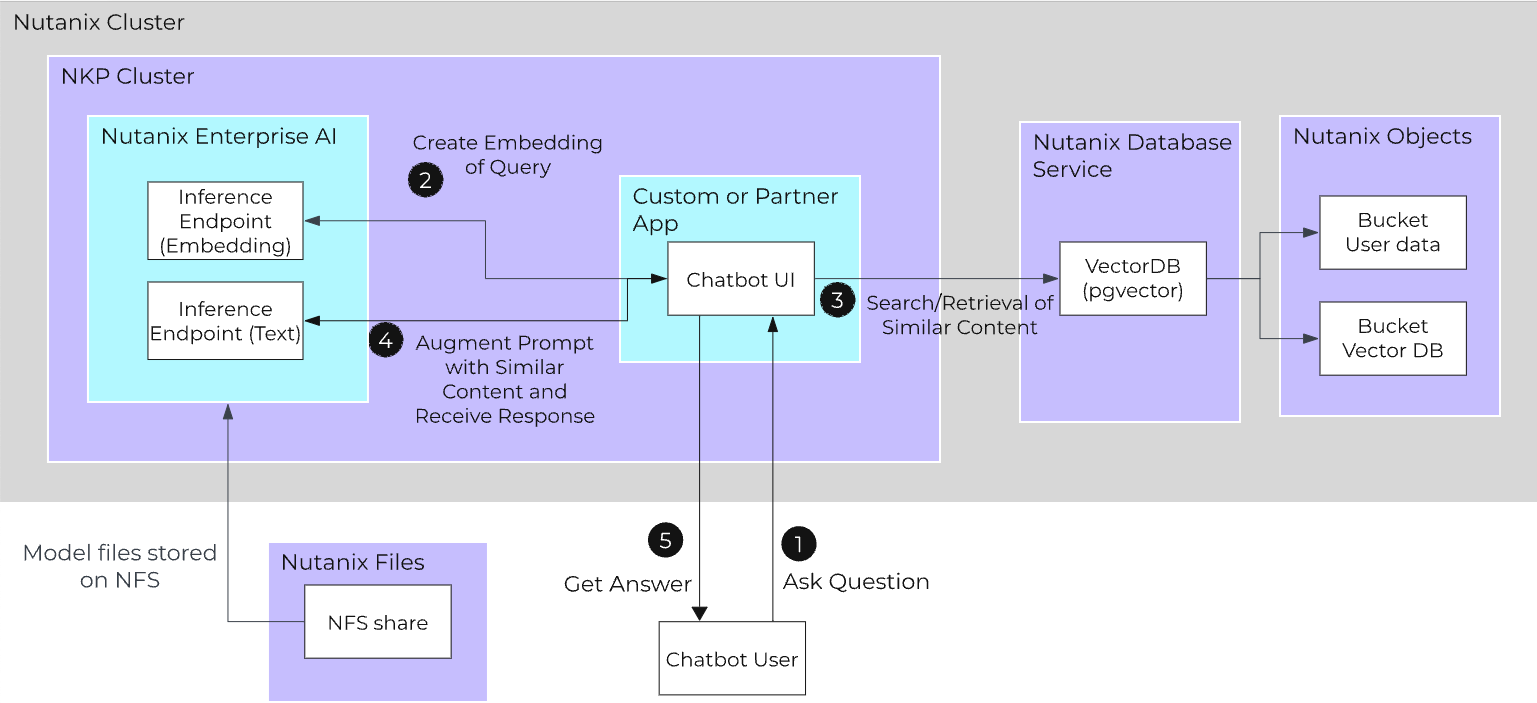
- Ask Question
- User asks a question to the chatbot.
- Create Embedding of Query
- Instead of going directly to the inference API, the application will first create an embedding of the query using an embedding model hosted on Nutanix Enterprise AI.
- Search/Retrieval of Similar Content
- With that embedding, the application will search for similar embeddings in the vector database that has been populated with the embeddings of source documents.
- Send Prompt to Inference API
- The application augments the user’s prompt with the found context and sends this to a text generation model hosted on Nutanix Enterprise AI.
- Get Answer
- The chatbot returns an answer to the user.
For more information for designing and implementing a Retrieval Augmented Generation workflow, check out the Nutanix Validated Design.
Other Resources
To learn more about Nutanix Enterprise AI and to see it in action, check out the following resources:
Addendum
Release Notes & Change LogNutanix Cloud Bible Release Notes & Change Log
Please use this document to stay up to date on The Nutanix Bible changes, updates and additions. This document will be updated each time a change is made to The Nutanix Bible content.Change Log
| Date | Summary | Details |
|---|---|---|
| June 12, 2026 | Updated v4 SDK Language Support List |
|
| June 4, 2026 | Added External Storage section |
|
| June 3, 2026 | Updates to Book of Cloud Management |
|
| May 8, 2026 | Moved and Updated Security Central |
|
| May 1, 2026 | Reorganized Book of AOS Storage |
|
| April 29, 2026 | Updates to Book of Network Services |
|
| March 12, 2026 | Updates to API Section |
|
| March 4, 2026 | Updates for AOS |
|
| March 3, 2026 | Updates to Book of AHV |
|
| March 3, 2026 | Updates to Book of AHV |
|
| February 20, 2026 | Updates to AOS Storage |
|
| February 9, 2026 | Added Nutanix Government Clusters on AWS Gov Cloud. |
|
| December 8, 2025 | Added Nutanix Clusters for Google Cloud section |
|
| October 28, 2025 | Removing last of Leap traces from Book of DR |
|
| September 8, 2025 | Updates to Backup/DR Services |
|
| September 8, 2025 | Updates to Cloud Management |
|
| August 8, 2025 | Updates to Book of NC2 |
|
| May 27, 2025 | Updates to Book of AI/ML |
|
| March 26, 2025 | Updates for Nutanix Database Service (NDB) 2.7 |
|
| February 25, 2025 | Update to Book of Hyper-V |
|
| January 14th, 2025 | Added Nutanix v4 API information |
|
| October 14th, 2024 | Added Nutanix Kubernetes Platform |
|
| September 23rd, 2024 | NC2 on AWS updates for AOS 6.8.1 |
|
| June 8th, 2024 | NC2 on AWS updates for AOS 6.8 |
|
| July 23, 2024 | Two new books for Nutanix Move and the Nutanix Database Service |
|
| May 21st, 2024 | Nutanix Cloud Bible Restructure |
|
| December 21, 2023 | Updates to Book of AHV and Book of Network Services |
|
| December 15, 2023 | Updates to Book of AOS and Book of AHV |
|
| November 29, 2023 | Updates to Book of Prism |
|
| October 30, 2023 | Updates to Book of Cloud Native |
|
| September 6, 2023 | Updates to Book of NC2 for AOS 6.7 |
|
| August 17, 2023 | Added Book of AI/ML |
|
| June 30, 2023 | Updates to the Book of Cloud Native |
|
| June 20, 2023 | Added Book of APIs |
|
| June 9, 2023 | Updates to the Book of Network Services |
|
| June 6, 2023 | Multiple Updates |
|
| June 2, 2023 | Update to the Book of NC2 |
|
| May 24th, 2023 | Update Cluster Maximums |
|
| May 18th, 2023 | Added Book of Cloud Management, updates to Nutanix Cloud Clusters section |
|
| April 5th, 2023 | Nutanix Rebrand |
|
| March 10th, 2023 | Updates to the Book of Network Services - Flow Virtual Networking |
|
| February 28th, 2023 | Updated images and Book of Basics product info |
|
| November 14, 2022 | Updates to the Book of Nutanix Cloud Clusters - AWS |
|
| September 9, 2022 | Updates to the Book of Storage Services - Files |
|
| July 28, 2022 | Fixed description of curator_cli command in Book of AOS |
|
| July 26, 2022 | Updates to the Book of Storage Services - Objects |
|
| July 25, 2022 | Updates to the Book of Storage Services under the Objects section |
|
| June 1st, 2022 | Updates to the Book of Nutanix Cloud Clusters |
|
| May 20, 2022 | Updates to the Book of Network Services |
|
| May 9, 2022 | Updates to the Book of AHV |
|
| May 3, 2022 | New Book of Cloud Native |
|
| April 15, 2022 | Updates to the Book of AOS |
|
| April 8, 2022 | Multiple updates |
|
| March 25, 2022 | Updates to The Nutanix Bible images |
|
| March 18, 2022 | Updates to the Book of AOS |
|
| March 16, 2022 | Updates to the Book of Network Services |
|
| February 18, 2022 | Updated resource links |
|
| December 3rd, 2021 | The Nutanix Bible Classic PDF added |
|
| November 19th, 2021 | Release notes added |
|
Have feedback? Find a typo? Send feedback to biblefeedback at nutanix dot com
To learn more about Nutanix, check it out for yourself by taking a Nutanix Test Drive!
Thank you for reading The Nutanix Cloud Bible! Stay tuned for many more upcoming updates and enjoy the Nutanix Cloud Platform!
©2025 Nutanix, Inc. All rights reserved. Nutanix, the Nutanix logo and all Nutanix product and service names mentioned are registered trademarks or trademarks of Nutanix, Inc. in the United States and other countries. All other brand names mentioned are for identification purposes only and may be the trademarks of their respective holder(s).