Book of Prism
Features and Usage
» Download this section as PDF (opens in a new tab/window)
In the following sections we’ll cover some of the typical Prism uses as well as some common troubleshooting scenarios.
Nutanix Software Upgrade
Performing a Nutanix software upgrade is a very simple and non-disruptive process.
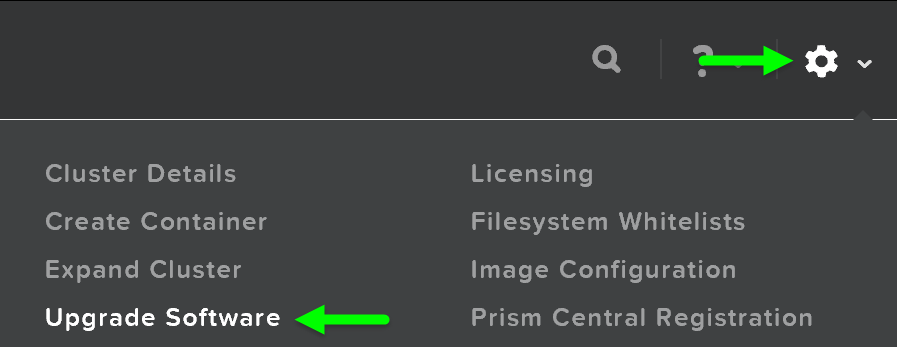
To begin, start by logging into Prism and clicking on the gear icon on the top right (settings) or by pressing ‘S’ and selecting ‘Upgrade Software’:
 Prism - Settings - Upgrade Software
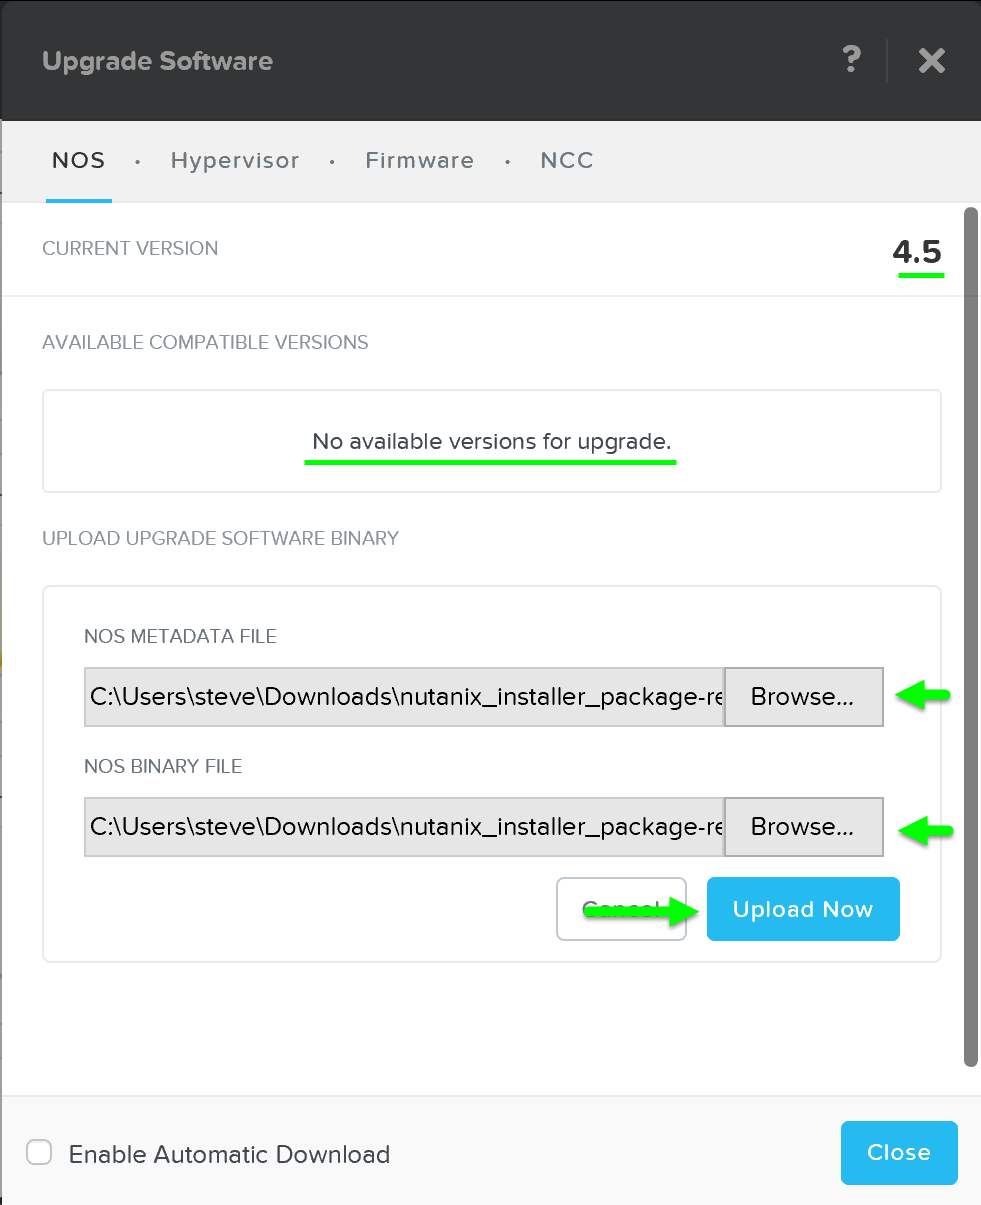
This will launch the ‘Upgrade Software’ dialog box and will show your current software version and if there are any upgrade versions available. It is also possible to manually upload a NOS binary file.
You can then download the upgrade version from the cloud or upload the version manually:
 Upgrade Software - Main
Note
Upload software from the CVM
In certain cases you may want to download the software and upload from the CVM itself. For example, this can be used to download builds locally to the CVM.
First SSH into a CVM and find the Prism leader:
curl localhost:2019/prism/leader
SSH to the Prism leader and download the software bundle and metadata JSON
Run the following command to "upload" the software to Prism:
ncli software upload file-path=PATH_TO_SOFTWARE meta-file-path=PATH_TO_METADATA_JSON software-type=SOFTWARE_TYPE
The following shows an example for Prism Central:
ncli software upload file-path=/home/nutanix/tmp/leader-prism_central.tar meta-file-path=/home/nutanix/tmp/leader-prism_central-metadata.json software-type=prism_central_deploy
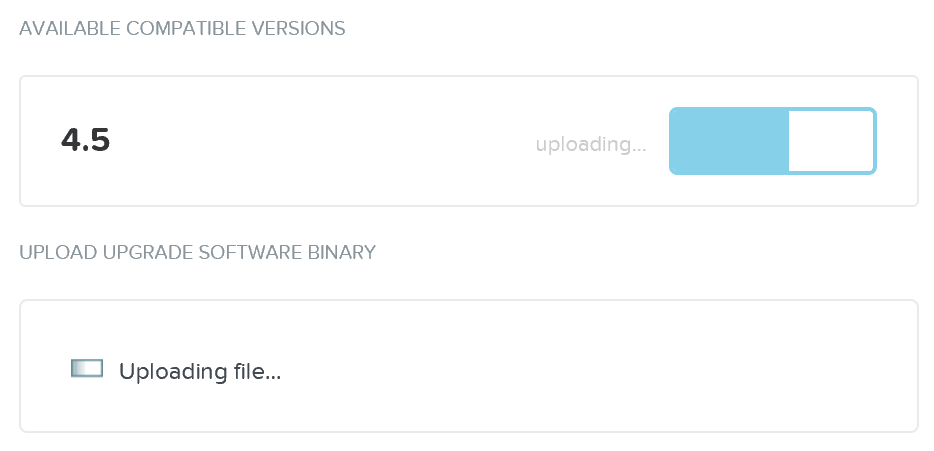
It will then upload the upgrade software onto the Nutanix CVMs:
 Upgrade Software - Upload
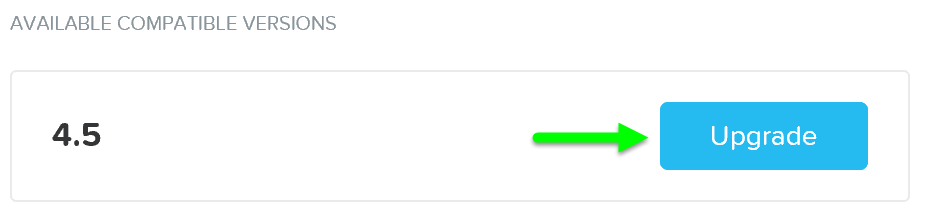
After the software is loaded click on ‘Upgrade’ to start the upgrade process:
 Upgrade Software - Upgrade Validation
You’ll then be prompted with a confirmation box:
 Upgrade Software - Confirm Upgrade
The upgrade will start with pre-upgrade checks then start upgrading the software in a rolling manner:
 Upgrade Software - Execution
Once the upgrade is complete you’ll see an updated status and have access to all of the new features:
 Upgrade Software - Complete
Note
Note
Your Prism session will briefly disconnect during the upgrade when the current Prism Leader is upgraded. All VMs and services running remain unaffected.
Hypervisor Upgrade
Similar to Nutanix software upgrades, hypervisor upgrades can be fully automated in a rolling manner via Prism.
To begin follow the similar steps above to launch the ‘Upgrade Software’ dialogue box and select ‘Hypervisor’.
You can then download the hypervisor upgrade version from the cloud or upload the version manually:
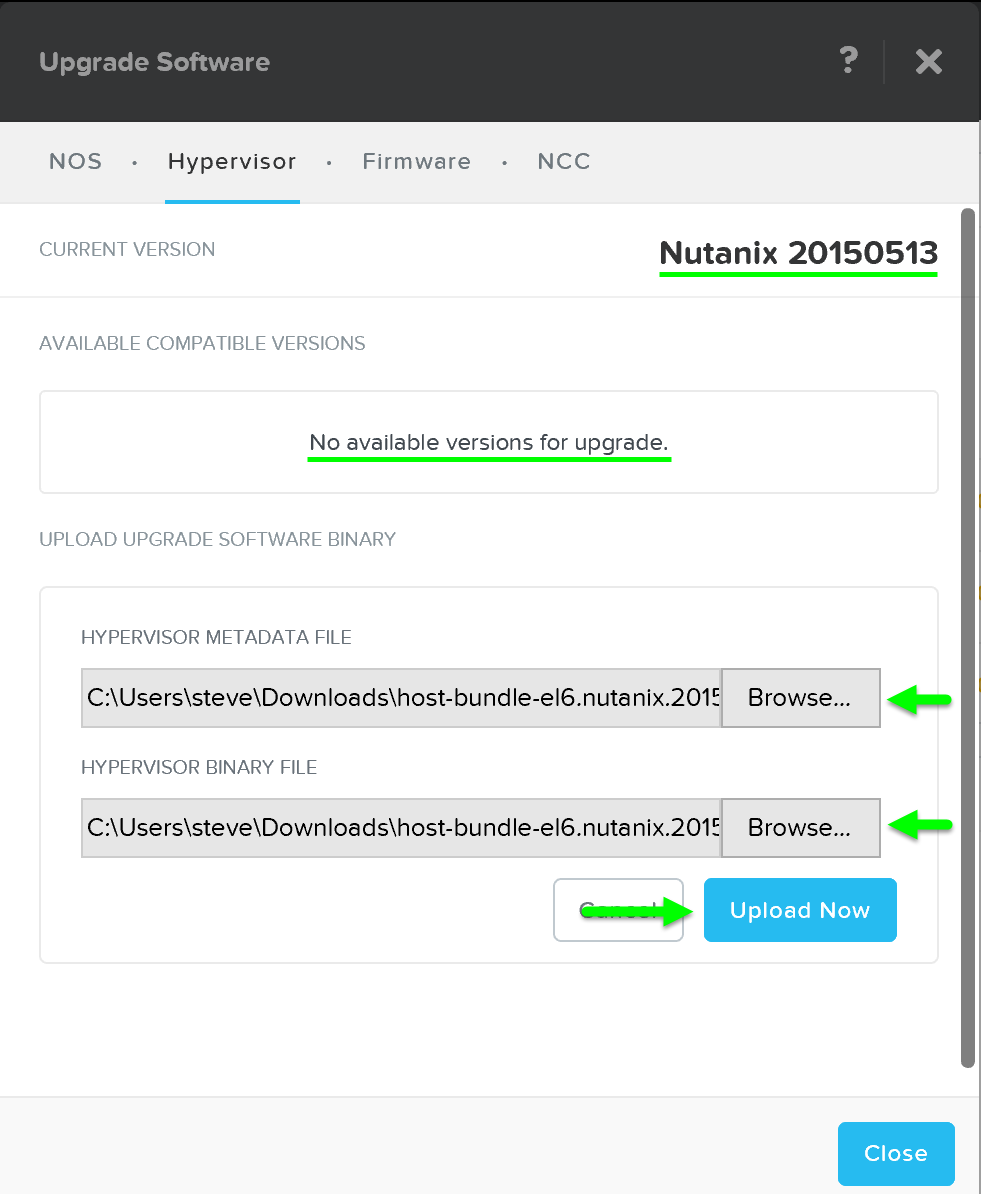 Upgrade Hypervisor - Main
It will then load the upgrade software onto the Hypervisors. After the software is loaded click on ‘Upgrade’ to start the upgrade process:
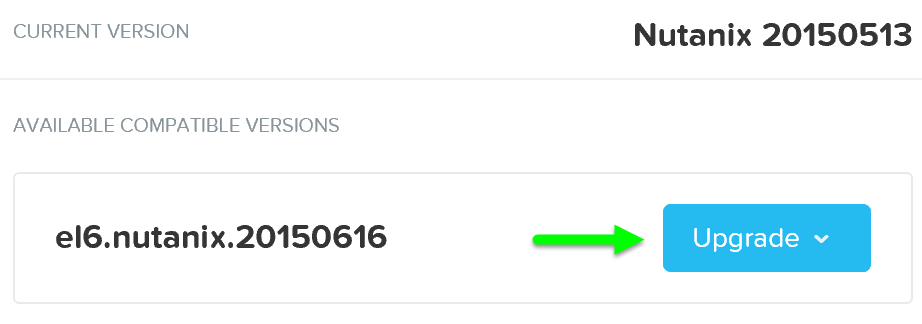 Upgrade Hypervisor - Upgrade Validation
You’ll then be prompted with a confirmation box:
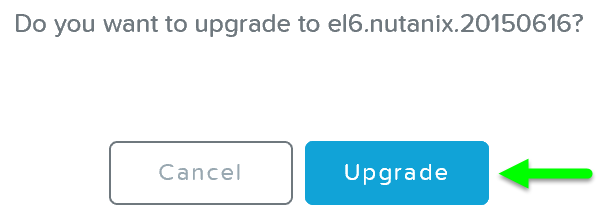 Upgrade Hypervisor - Confirm Upgrade
The system will then go through host pre-upgrade checks and upload the hypervisor upgrade to the cluster:
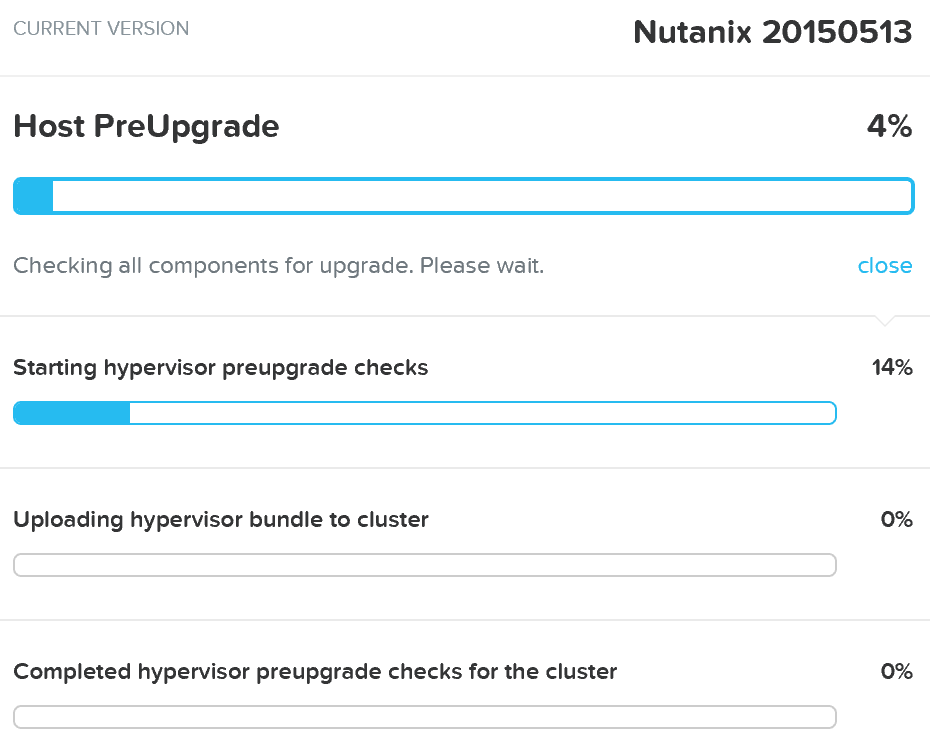 Upgrade Hypervisor - Pre-upgrade Checks
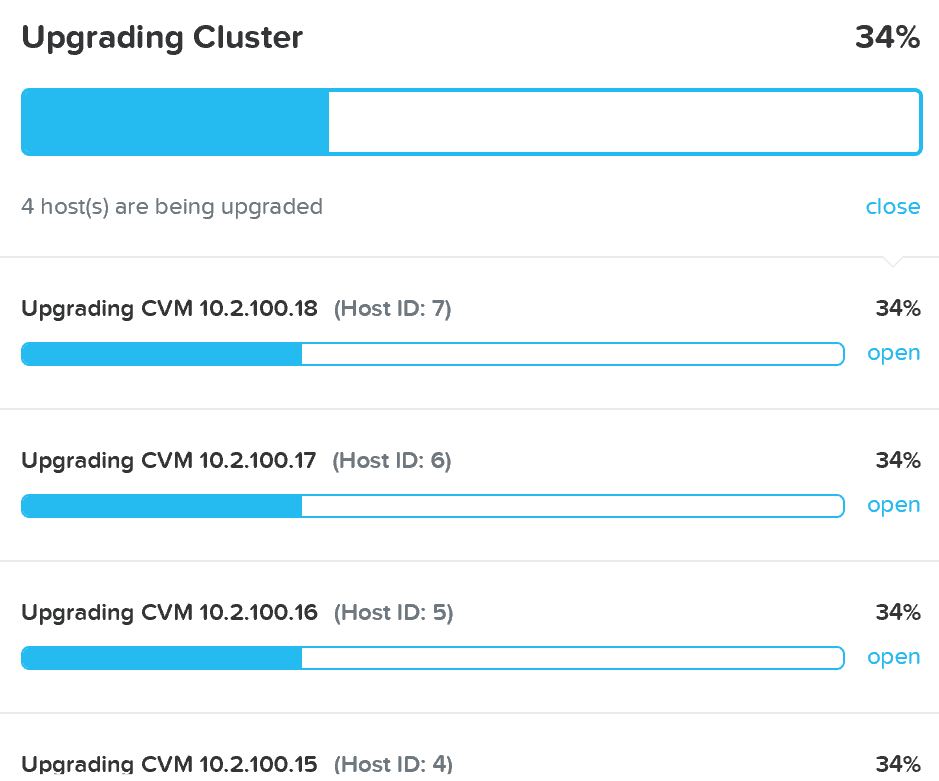
Once the pre-upgrade checks are complete the rolling hypervisor upgrade will then proceed:
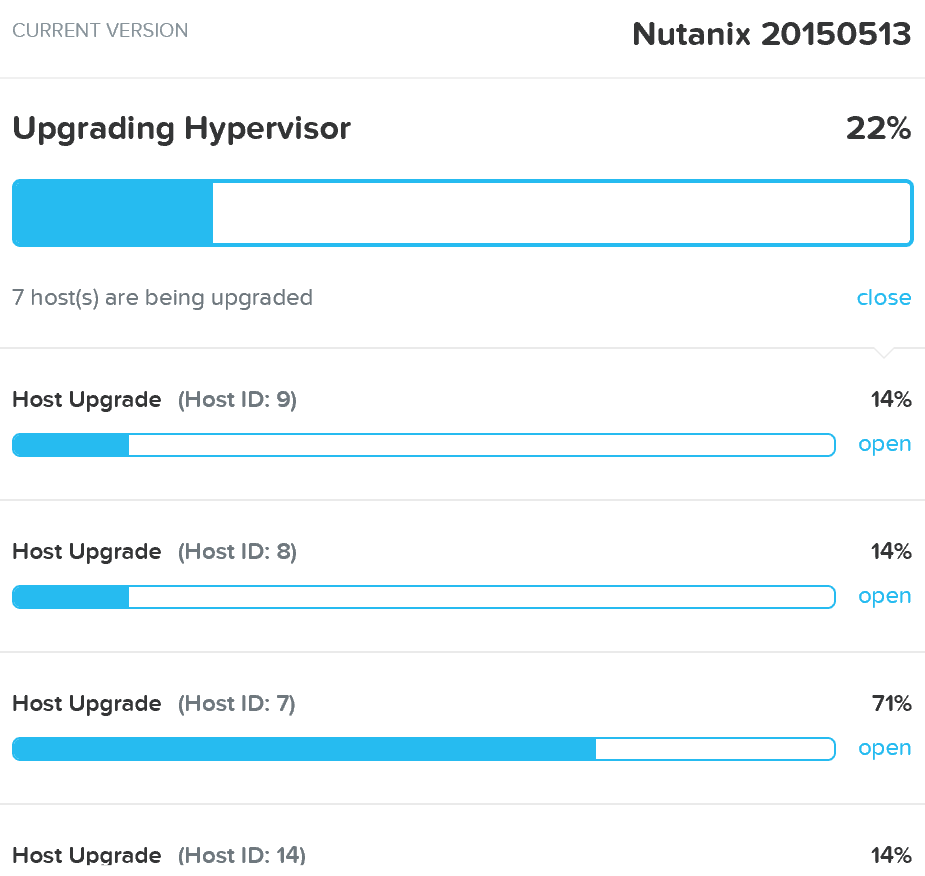 Upgrade Hypervisor - Execution
Similar to the rolling nature of the Nutanix software upgrades, each host will be upgraded in a rolling manner with zero impact to running VMs. VMs will be live-migrated off the current host, the host will be upgraded, and then rebooted. This process will iterate through each host until all hosts in the cluster are upgraded.
Note
Pro tip
You can also get cluster wide upgrade status from any Nutanix CVM by running 'host_upgrade --status'. The detailed per host status is logged to ~/data/logs/host_upgrade.out on each CVM.
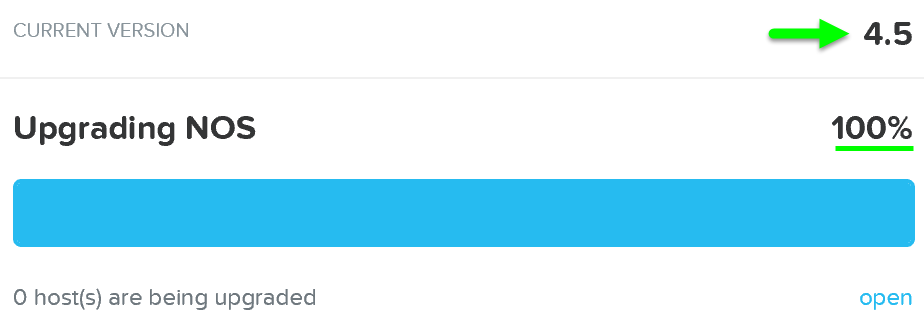
Once the upgrade is complete you’ll see an updated status and have access to all of the new features:
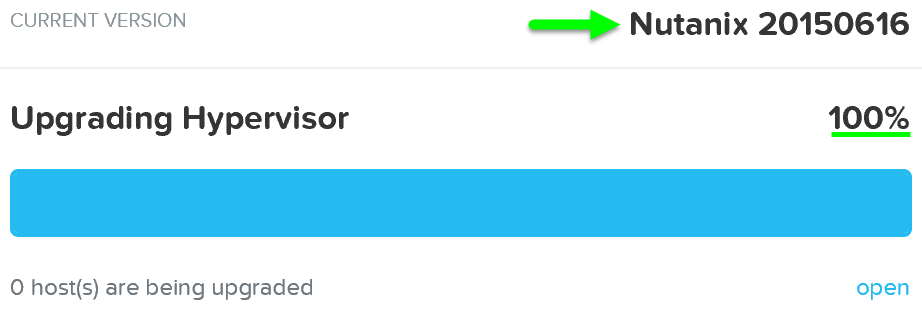 Upgrade Hypervisor - Complete
Cluster Expansion (add node)
 Cluster Expansion
The ability to dynamically scale the Nutanix cluster is core to its functionality. To scale an Nutanix cluster, rack / stack / cable the nodes and power them on. Once the nodes are powered up they will be discoverable by the current cluster using mDNS.
The figure shows an example 7 node cluster with 1 node which has been discovered:
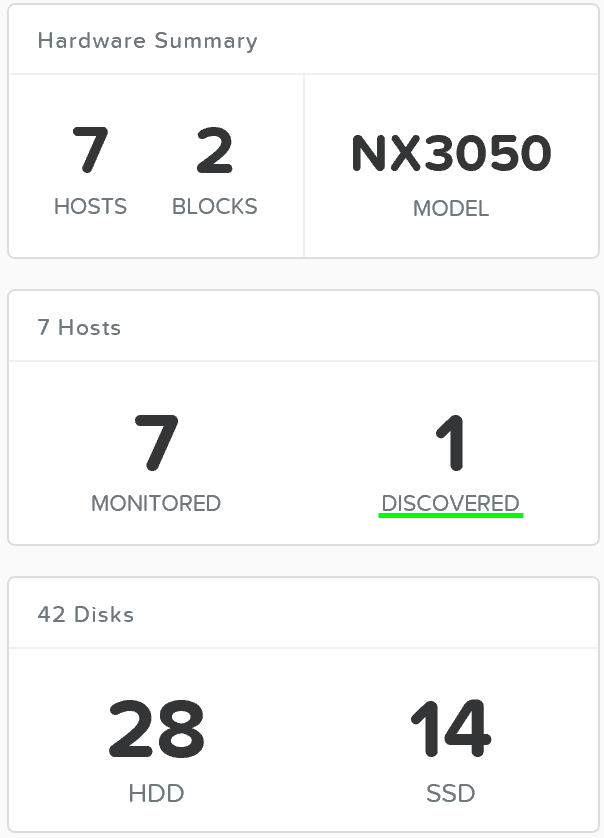 Add Node - Discovery
Multiple nodes can be discovered and added to the cluster concurrently.
Once the nodes have been discovered you can begin the expansion by clicking ‘Expand Cluster’ on the upper right hand corner of the ‘Hardware’ page:
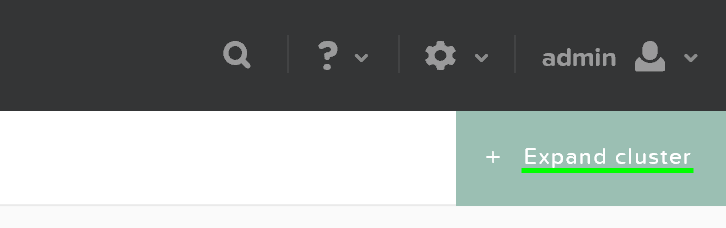 Hardware Page - Expand Cluster
You can also begin the cluster expansion process from any page by clicking on the gear icon:
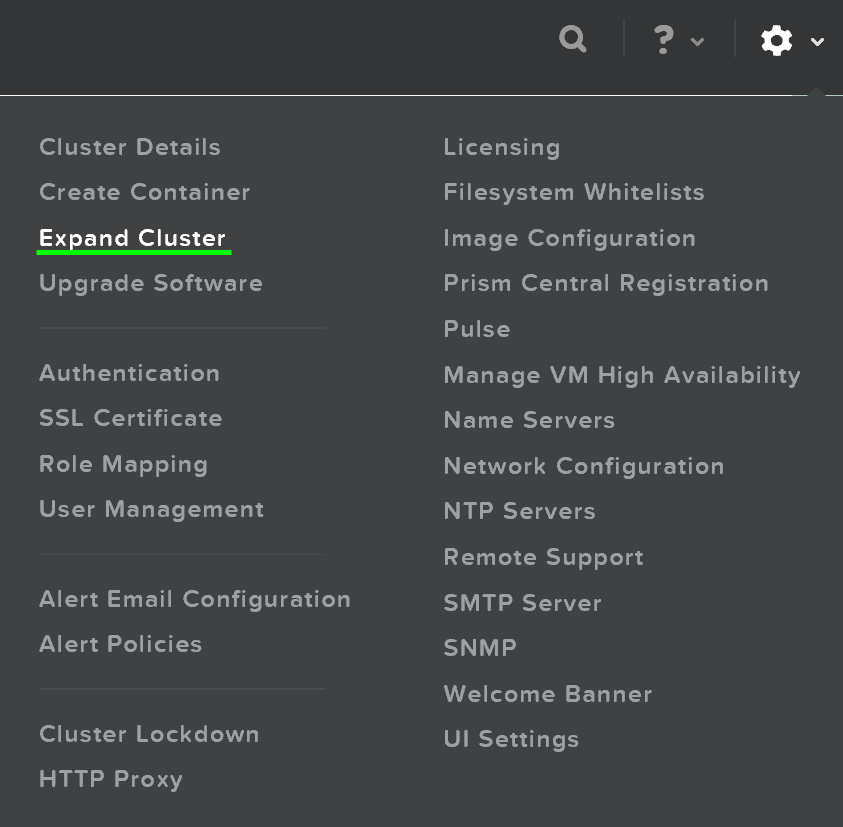 Gear Menu - Expand Cluster
This launches the expand cluster menu where you can select the node(s) to add and specify IP addresses for the components:
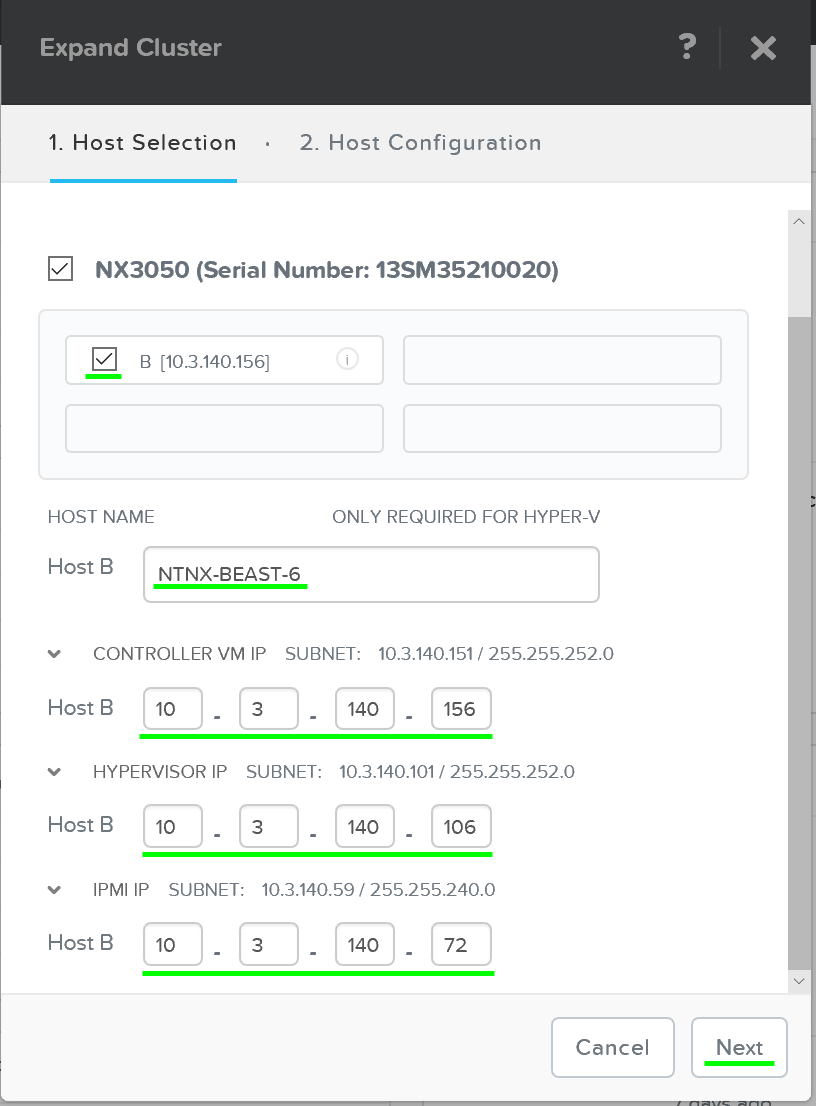 Expand Cluster - Host Selection
After the hosts have been selected you’ll be prompted to upload a hypervisor image which will be used to image the nodes being added. For AHV or cases where the image already exists in the Foundation installer store, no upload is necessary.
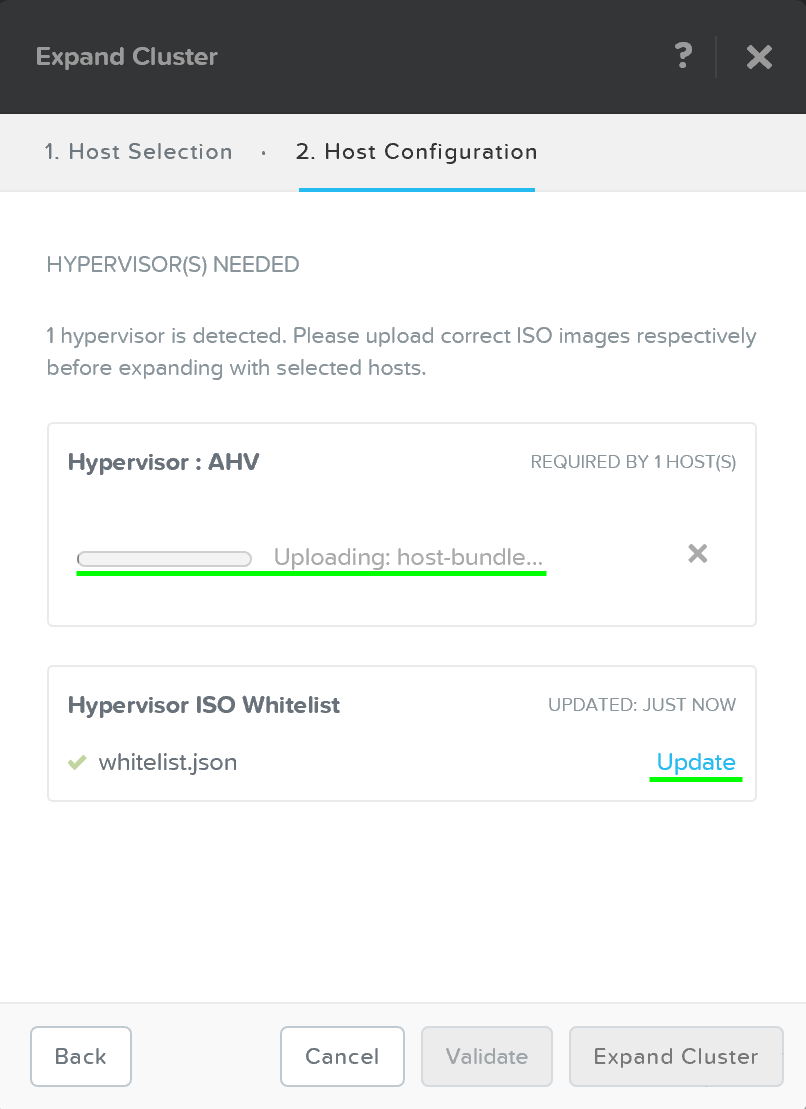 Expand Cluster - Host Configuration
After the upload is completed you can click on ‘Expand Cluster’ to begin the imaging and expansion process:
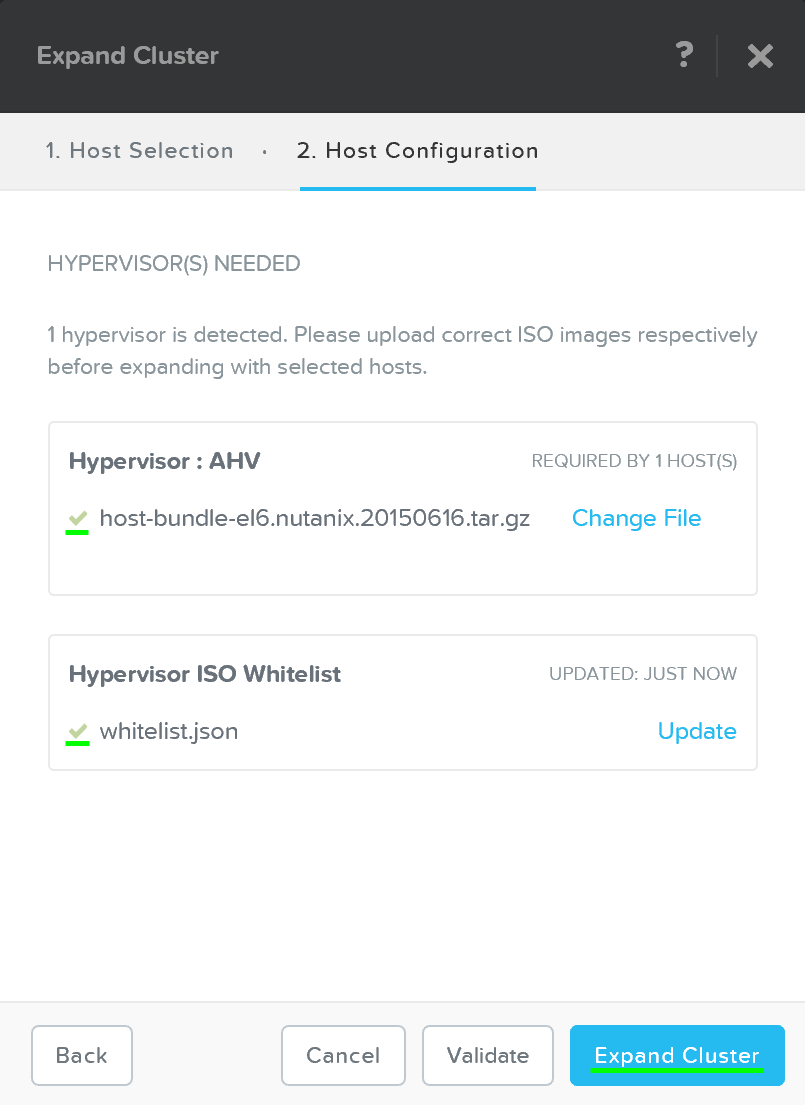 Expand Cluster - Execution
The job will then be submitted and the corresponding task item will appear:
 Expand Cluster - Execution
Detailed tasks status can be viewed by expanding the task(s):
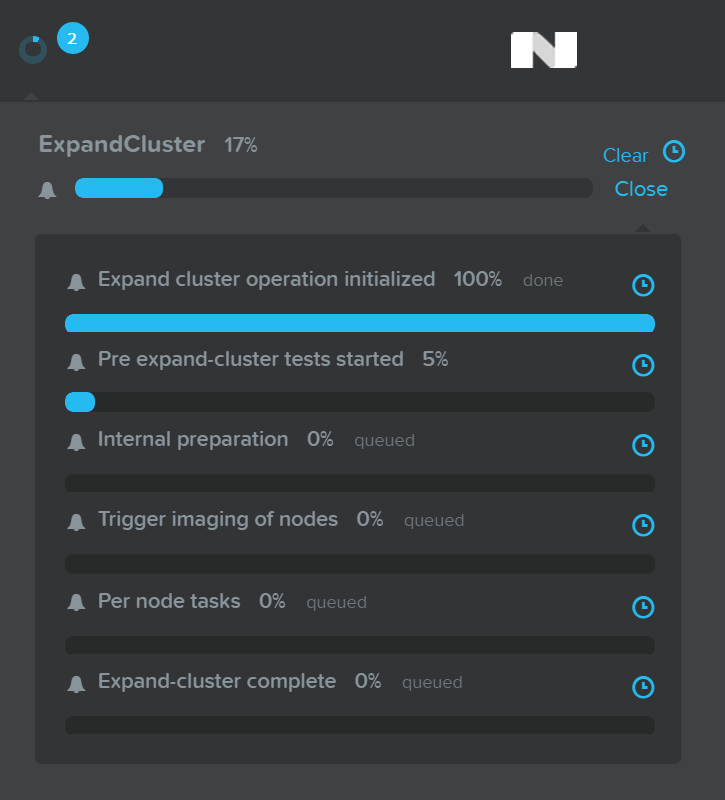 Expand Cluster - Execution
After the imaging and add node process has been completed you’ll see the updated cluster size and resources:
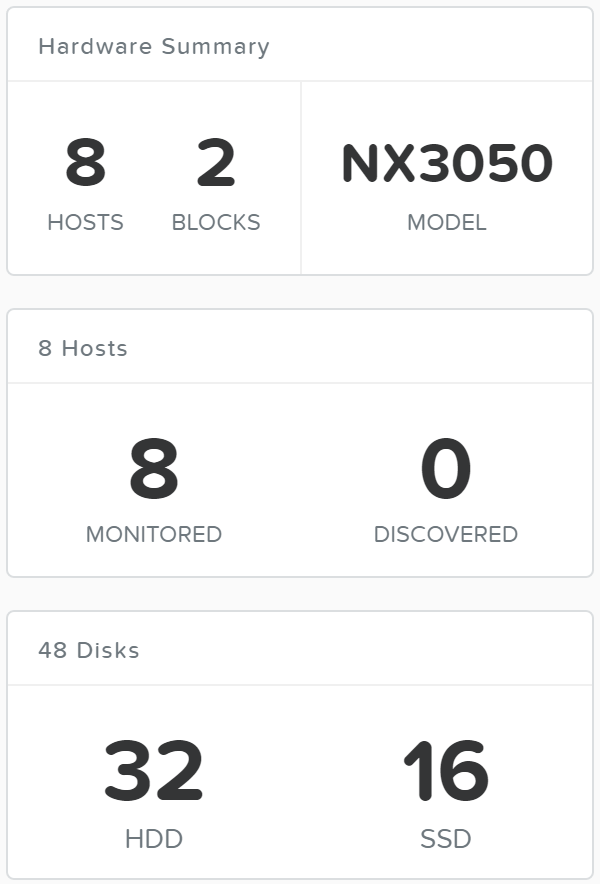 Expand Cluster - Execution
I/O Metrics
Identification of bottlenecks is a critical piece of the performance troubleshooting process. In order to aid in this process, Nutanix has introduced a new ‘I/O Metrics’ section to the VM page.
Latency is dependent on multitude of variables (queue depth, I/O size, system conditions, network speed, etc.). This page aims to offer insight on the I/O size, latency, source, and patterns.
To use the new section, go to the ‘VM’ page and select a desired VM from the table. Here we can see high level usage metrics:
 VM Page - Details
The ‘I/O Metrics’ tab can be found in the section below the table:
 VM Page - I/O Metrics Tab
Upon selecting the ‘I/O Metrics’ tab a detailed view will be shown. We will break this page down and how to use it in this section.
The first view is the ‘Avg I/O Latency’ section that shows average R/W latency for the past three hours. By default the latest reported values are shown with the corresponding detailed metrics below for that point in time.
You can also mouse over the plot to see the historical latency values and click on a time of the plot to view the detailed metrics below.
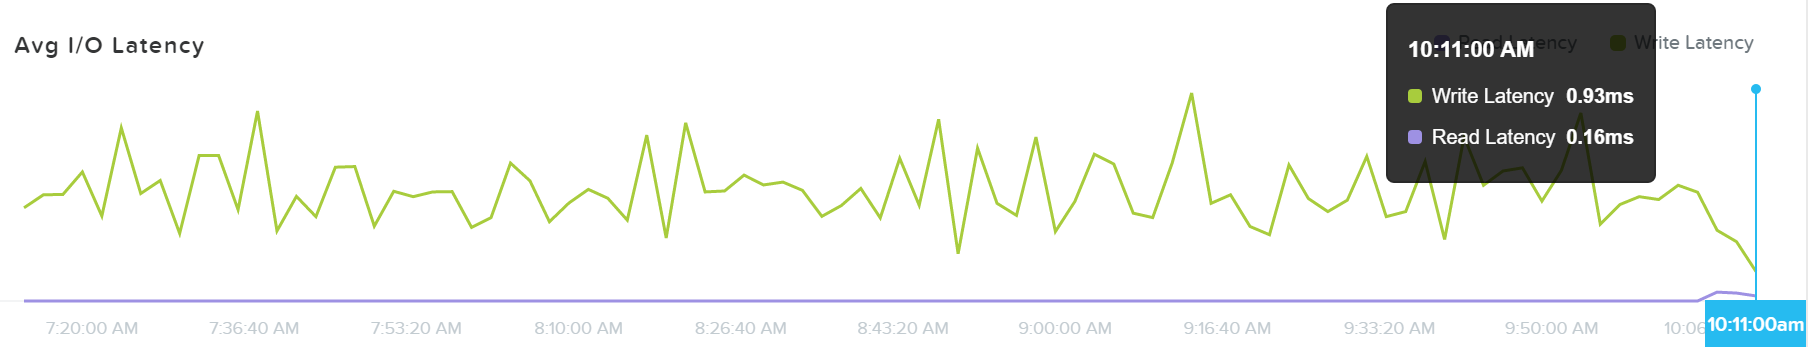 I/O Metrics - Latency Plot
This can be useful when a sudden spike is seen. If you see a spike and want to investigate further, click on the spike and evaluate the details below.
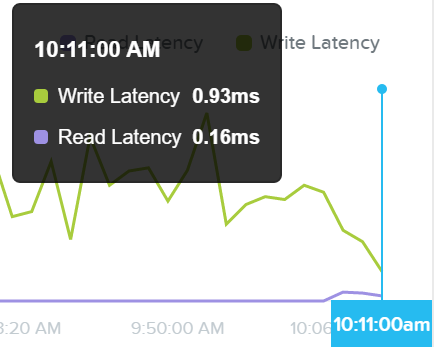 I/O Metrics - Latency Plot
If latency is all good, no need to dig any further.
The next section shows a histogram of I/O sizes for read and write I/Os:
 I/O Metrics - I/O Size histogram
Here we can see our read I/Os range from 4K to 32K in size:
 I/O Metrics - Read I/O Size histogram
Here we can see our write I/Os range from 16K to 64K with some up to 512K in size:
 I/O Metrics - Write I/O Size histogram
Note
Pro tip
If you see a spike in latency the first thing to check is the I/O size. Larger I/Os (64K up to 1MB) will typically see higher latencies than smaller I/Os (4K to 32K).
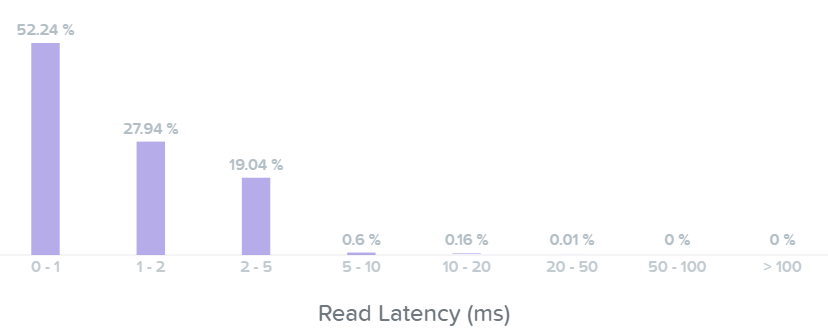
The next section shows a histogram of I/O latencies for read and write I/Os:
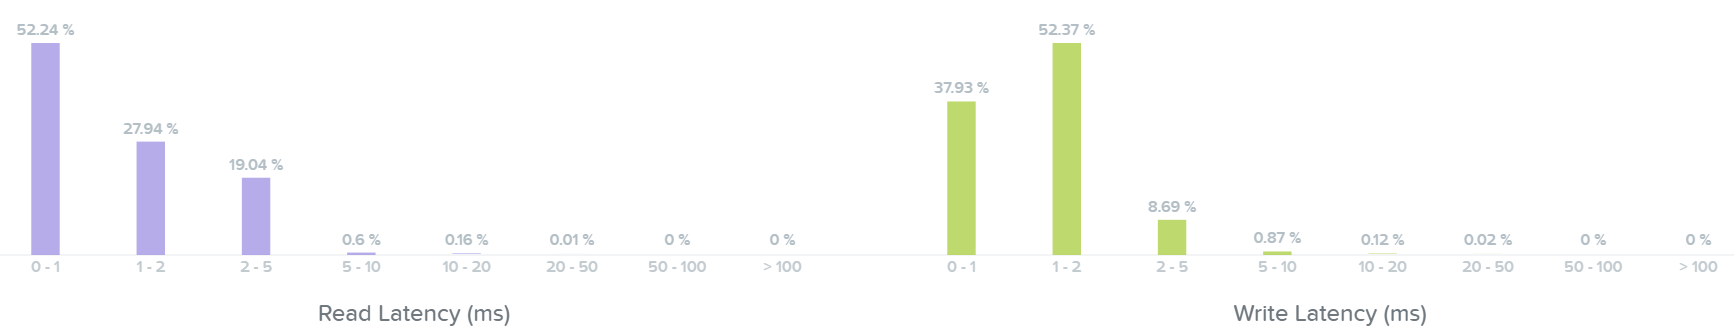 I/O Metrics - Latency histogram
Looking at the read latency histogram we can see the majority of read I/Os are sub-ms (<1ms) with some up to 2-5ms.
 I/O Metrics - Read Latency histogram
Taking a look below at the ‘Read Source’ we can see most I/Os are being served from the SSD tier:
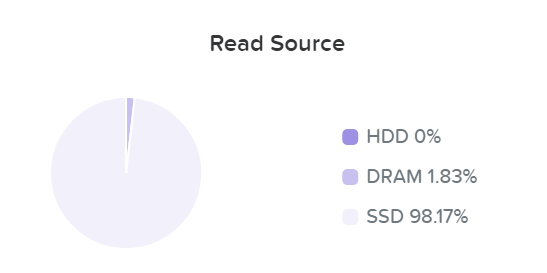 I/O Metrics - Read Source SSD
As data is read it will be pulled in to the Unified Cache realtime (Check the ‘I/O Path and Cache’ section to learn more). Here we can see the data has been pulled into the cache and is now being served from DRAM:
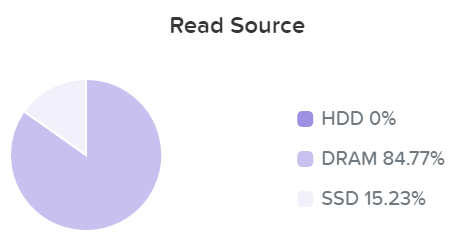 I/O Metrics - Read Source DRAM
We can now see basically all of our read I/Os are seeing sub-ms (<1ms) latency:
 I/O Metrics - Read Latency histogram
Here we can see the majority of our write I/O are seeing <1-2ms latency:
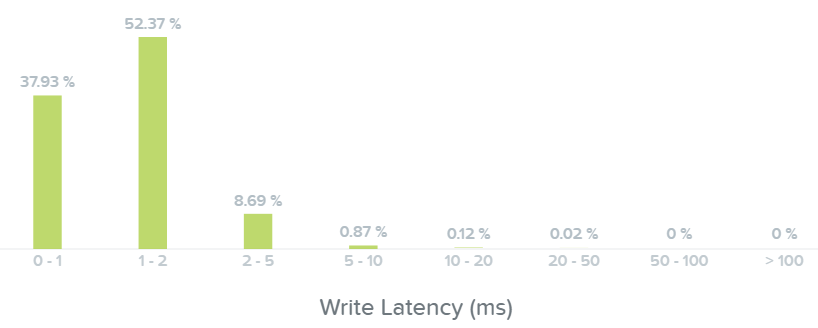 I/O Metrics - Write Latency histogram
Note
Pro tip
If you see a spike in read latency and the I/O sizes aren't large, check where the read I/Os are being served from. Any initial read from HDD will see higher latency than the DRAM cache; however, once it is in the cache all subsequent reads will hit DRAM and see an improvement in latency.
The last section shows the I/O patterns and how much is random vs. sequential:
 I/O Metrics - RW Random vs. Sequential
Typically I/O patterns will vary by application or workload (e.g. VDI is mainly random, whereas Hadoop would primarily be sequential). Other workloads will be a mix of both. For example, a database might be random on inserts or some queries, however sequential during ETL.